
ISSN: 2321-9653; IC Value: 45.98; SJ Impact Factor: 7.538
Volume 10 Issue XII Dec 2022- Available at www.ijraset.com


ISSN: 2321-9653; IC Value: 45.98; SJ Impact Factor: 7.538
Volume 10 Issue XII Dec 2022- Available at www.ijraset.com
 Mubasher Rashid Dand
1 , Er Sahilpreet Singh2
1M. Tech Scholar, Department Of Computer Science and Engineering, RIMT University, Mandi Gobindgarh, Punjab, India
2Assistant Professor, Department Of Computer Science and Engineering, RIMT University, Mandi Gobindgarh, Punjab, India


Abstract: The goal of this project is to create a deep learning-based visual crowd counting system. The objective of this project is to build a functioning system that can analyze pictures and determine the number of individuals present within these images. It will also demonstrate its approximate density map, a graph comparing the expected count to the actual count, and information on its accuracy in terms of Mean Absolute Error (MAE). To routinely supervise audiences, researchers recently moved to computer vision. This research analysis proposed the implementation of a Deep learning algorithm CNN for which the aim was to detect the crowd and estimate increased influx of people which has been successfully achieved by employing deep learning technique. We have used the shanghai tech dataset part B for our research purpose. CNN model detected the crowd and estimated the density with an absolute error of 21. In 312 we obtained a validation mean absolute error of 21.3, which means on average, the model will estimate 21 persons in excess or deficit.
The human population has been expanding at an astronomical rate in recent years, which has indirectly increased the prevalence of crowding. The purpose of gathering has a significant impact on a wide variety of assets and crowded behaviors. The examination of crowdmovements and behaviors has aroused a lot of scholarly interest in public service, security, and safety, as well as computer vision. Because human faces vary in color, stance, emotion, location, orientation, and illumination, the task of distinguishing a face in a crowd is difficult. A jam-packed situation causes enormous hordes of bewilderment, finishing in pushing, mass frenzy, rushes, or crowd pulverizes, and a deficiency of control. Weighty downpours killed22 individuals and harmed hundreds more in the early evening between Mumbai, Parel, and Elphinstone Road in 2017, while 27 walkers were killed in Andhra Pradesh state of India in 2015 as displayed in Fig. 1, 32 individuals kicked the bucket in a rush on the banks of the Godavari waterway in 2015. what's more, 26 others were harmed during the Stampedeoccurred on the event of Diwali at Gandhi Maiden 2014. To keep away from these misfortunes, the programmed location of dire and startling conditions in enormous groups is fundamental. Accordingly, it will certainly support the execution of crisis gauges just as suitable security and wellbeing measures. Group location is quite possibly the most troublesome errand in visual reconnaissance frameworks. This innovation might be utilized to identifyand tally individuals, just as screen swarm levels and conveyalerts when there is an enormous group.

ISSN: 2321-9653; IC Value: 45.98; SJ Impact Factor: 7.538 Volume 10 Issue XII Dec 2022- Available at www.ijraset.com

The goal of a crowded headcount is to determine the number of persons present in congested areas. There are a few uses for crowd detection, such as
1) Safety Control: Video surveillance cameras in places like games arenas, shoppingcenters, and air terminals have affirmed swarm checking for conduct examination, clog investigation, and irregularity location.
2) Disaster Management: Music exhibitions and political shows, for instance, are dependent upon disasters like charges. For early conclusion of overpopulation, it isimportant to utilize.
3) Public Areas: Many public scenes, like shopping centers, stations, air terminals, and different spots where human wellbeing might be impacted, mayhave a high group level.
4) Visual Surveillance: Because public spaces, for example, jungle gyms and huge fields are so packed, this sort of innovation might miss an individual among the group. The Visual Surveillance framework assists with decreasing disappointment rates by identifying and informingabnormalities.
A crowd is formed when a massive amount of people meets together and they principally agree on a common goal. This gathering may be noisy, laid-back, cheerful, and, interestingly, may initiate with unbelievable displays of negativity. The crowd is mainly referred to as the average number of people present in a particular place. A place is said to be crowded if the population of an area becomes much more than the capacity ofthat place. Thus, a crowd potentially result in a broad range of incidents. Excessive overpopulation sometimes results in individuals losing control & tear down the surroundings. People typically enjoy the benefits of this type of gathering to engage in brutal behavior like insulting ladies. Therefore, it is crucial to determine the number of people in a gathering in order to assure everyone's safe. To assess any crowd, it is necessary to estimate the density of the crowd. If the safe limit of the crowd is crossed, the warning signs can be easily given to avoid certain mishaps. This can lead to maintain the infrastructure and management of the area. The counting of people can help us to classify the area as crowded or non-crowded and if the place is crowded, the place can be monitored.
There is numerous population identification comment section that relate with the population detecting and analysis process, which include:
a) Man, identification as well as tracking
b) Object detection andanalysis
Among the above two sections, the detection of humans is a difficult process as it is influenced by various possible appearances due to expressed pose, outfits, illumination, and the surroundings but these limitations can improve the performance of detection task if we have its prior knowledge.
Human detection can be used in a varietyof situations, like: Identifying and spotting individuals in crowded places. Human recognition as well as tracing Categorization of gender
The individual being spotted via foot Fall protection with the aged Discovery of abnormal events
Crowd control is assessed by intellectuals, theorists, as well as surveyors, however information technology engineers are mostly interested in detection, smart environments, as well as abstract conditions. The present method of keeping an eye on mobs involves security systems that are individually operated by very far human employees. Since there are often more cops watching visual information than there are clips, of that kind monitoring models are important worthless for detecting and preventing in actual environments.
As illustrated in Fig. 2, the Crowd Detection System includes Embedding Information, Methods, Aspects, as well as Outcome. There are three approaches for crowd detection. These approaches aredetection based, regression based and density based.
The recognition model attempts to sort out the number of people there are by recognizing a solitary individual and their areas at the same time. Jones and Snow et al. portrayed a spatiotemporal data based filtering window walker identifier. [17].


ISSN: 2321-9653; IC Value: 45.98; SJ Impact Factor: 7.538 Volume 10 Issue XII Dec 2022- Available at www.ijraset.com
Supreme contrast, Haar- like channels. To catch moving items, three sorts of channels are utilized: the Haar channel, the moved distinction channel, and the moved contrast channel. The Adaboost learning calculation was utilized to prepare eight distinct passerby finders for eight unique movements. Moreover, utilizing both development and appearance information, this procedure is utilized to create and endeavor to mastermind the moving person. In a hierarchical division situation, Leibe et al. [19] recommended a strategy for recognizing walkers in clogged regions that utilizes a calculation that joins nearby and worldwide information. Their trials showed that they are dependant on the framework, and people on foot can be distinguished in any event, when there is a ton of cross-over. Lin et al. [20] proposed a recognition approach for swarmed assessments dependent on wavelet layouts and vision-based advances. The Haar Wavelet Transform (HWT) was used to determine the component's determination of head shape. Any vector support devices (SVM) was used to arrange a featured district as having or not having a head. In complex situations where the head was not apparent, this strategy was restricted, and it end up being a computationally requesting arrangement continuously applications [21]. For distinguishing and searching for swarmed individuals, Zhao and Nevatia [22] proposed a 3D human shape model. The solution they offer is based on separating the foreground blobs to determine the top of the head. For the identification and tracking of people, a Posteriori problem was developed. There is an occlusion problem in the Using the Markov-Chain Monte Carlo method that prevents the combined likelihood of different people (MCMC).
Local picture patches are utilized in the relapse based way to deal with get include planning for tallying purposes. A portion of the qualities used to encode low-level data are forefront, highlights, edge components, surface, and inclination highlights. Nearby Binary Pattern (LBP), Practices In order Clustering (HOG), and Gray Level Co-event Matrices (GLCM) are instances of approaches to further develop results by catching neighborhood and worldwide scene highlights. Subsequent to removing nearbyand worldwide information, distinctive relapse calculations, like straight relapse, edge relapse, and neural networks [15], are utilized to figure out how to plan for swarm tallying purposes. Idrees et al. [22] found that nobody element or identification technique is adequately dependable to precisely evaluate the presence of the great thickness issue, hence they offered Fourier examination, head recognition, SIFT interest point, or alternate approaches to separate elements.


A thickness-based procedure is utilized to attempt a straight planning between nearby way includes and related thing thickness maps. It ought to be referenced, nonetheless, that dominating direct planning is troublesome. Pham et al. [23] proposed learning a non-direct planning between neighborhood fix elements and thickness maps. Backwoods of Chance Voting for thickness of a few objective options is finished utilizing relapse from various picture patches
Figure 2. General structure of crowd detection system
Fig 1: soil

ISSN: 2321-9653; IC Value: 45.98; SJ Impact Factor: 7.538


Volume 10 Issue XII Dec 2022- Available at www.ijraset.com
The proposed work is to achieve a set of research objectives which are listed below:
1) To study the already existing crowd detection techniques by conducting a systematicstudy.
2) To design a crowd detection tool to filter outperformance and efficiency.
3) To assess the effectiveness of the designed approach by comparing the results withthe existing methodologies and interpreting them to draw appropriate conclusions.

To solve any problem, a systematic approach must be followed efficiently to reach the desired solution. The research methodology that might be executed in this work is presented in Figure 4.
Study and analysis of crowd detection and people counting
Listing of various techniques based on deep learning
Define proposed technique and model

To understand the extent of work done in this field, a comprehensive literature survey has been done for better understanding the concepts related to the problem. A detailed review of literature about the research problem has been done by going through various books, papers, journals etc. and framework or model will be proposed.
The next phase would be the implementation of these models on hardware or software-based system and then experiments might be executed to calculate the efficiency of the model. The hardware and the software required would be identified for effective implementation. Then the results obtained will be compared and analyzed for validation.
ISSN: 2321-9653; IC Value: 45.98; SJ Impact Factor: 7.538 Volume 10 Issue XII Dec 2022- Available at www.ijraset.com

This chapter starts with a brief introduction to crowd detection. An overview of the research gaps and challenges is presented followed by the problem formulation. The research objectives are also mentioned along with the research methodology to carry out the research work. The diagrammatic flow of the research work is also presented in the chapter. The next chapter (chapter 4) presents the proposed models for human tracking and crowding recognition.


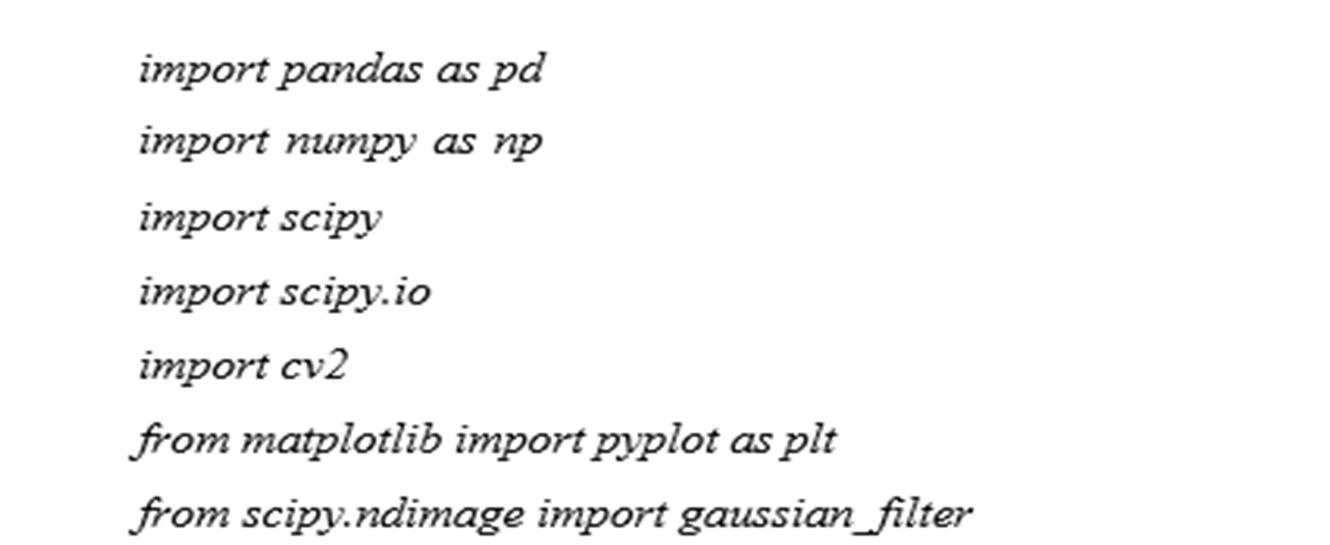
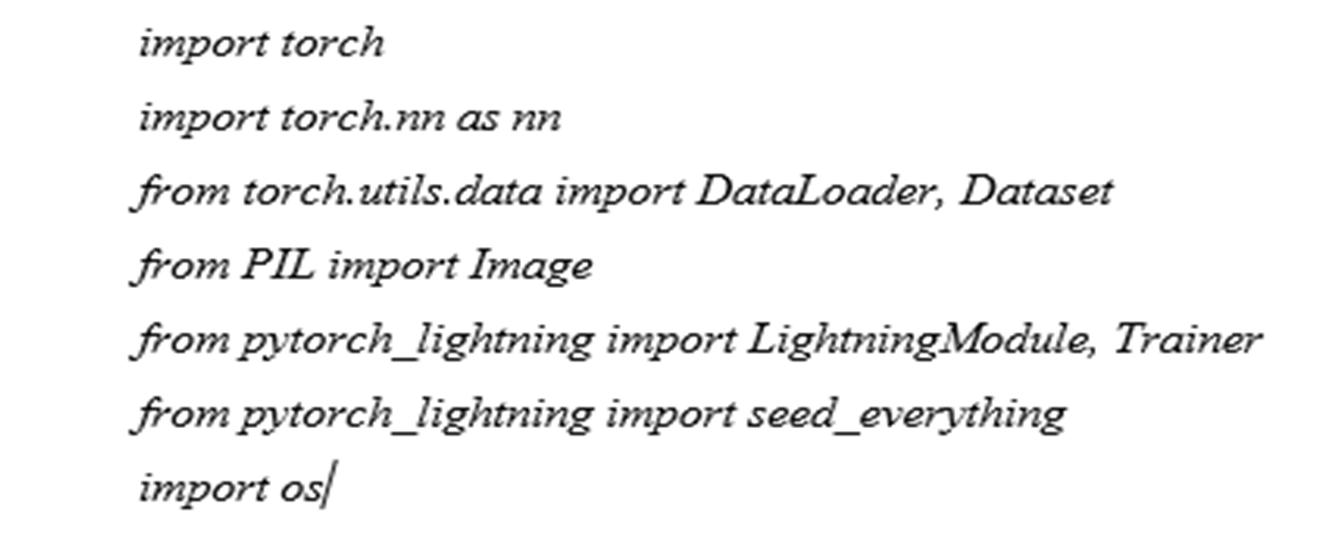
The dataset that we use for training the model is Shanghai Tech Part B. We have implemented our model in python using the Pytorch Lightening library. We will discuss each of our code blocks here. We will begin bymaking all the necessaryimports.


ISSN: 2321-9653; IC Value: 45.98; SJ Impact Factor: 7.538 Volume 10 Issue XII Dec 2022- Available at www.ijraset.com

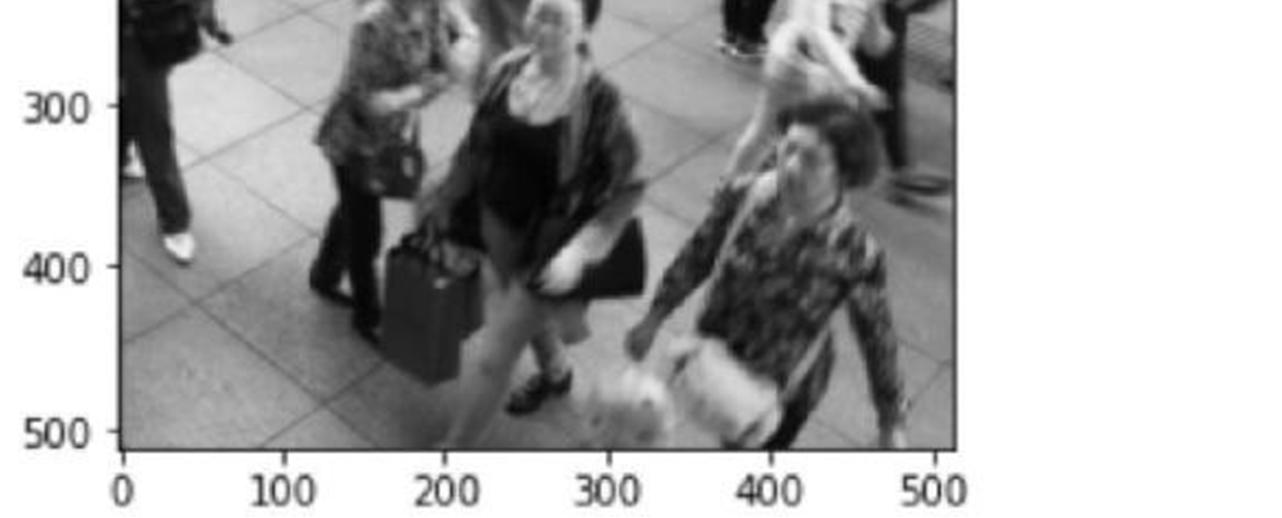
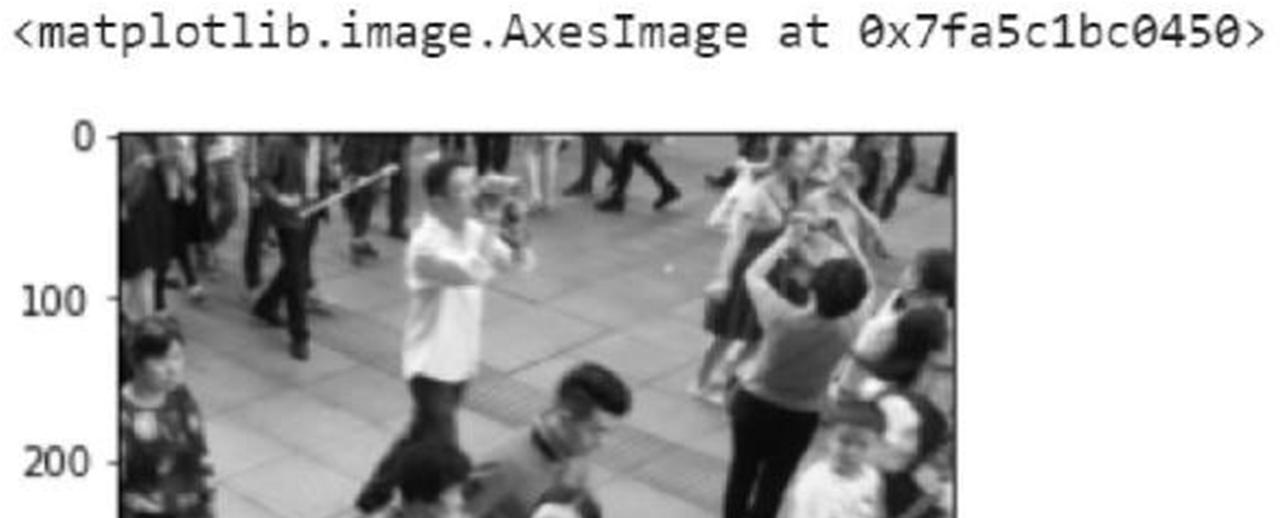
After making the necessary imports, we define a function to display our images. Once, wehave defined this function, we call it for some of the images in thedataset. im = cv2.imread('../input/shanghaitech/ShanghaiTech/part_B/train_data/images/IMG_1.jpg', cv2.IMREAD_COLOR) show(im) def show(im): After making thenecessaryimports, we define a function to displayour images. def show(im): plt.figure(figsize=(10, 10))


Once, we have visualized one of our data points, we proceed to prepare our data. We use thetrain test split module of Scikit learn for this purpose.
This will give us the number of instances used for training and testing.

ISSN: 2321-9653; IC Value: 45.98; SJ Impact Factor: 7.538 Volume 10 Issue XII Dec 2022- Available at www.ijraset.com

Once we have split the data into training and testing sets, we proceed to perform some data augmentation. Data augmentation routines are found in the pytorch lighting. The most important augmentation routines that we will use are Horizontal flip and Random Brightness contrast. Once these routines are called, we will define a class to implement them. The next step after data augmentation is to apply Gaussian filters to head annotations for density estimation. All of this is implemented in the following lines of code.
im_size = 512 aug_train = A.Compose([
A.RandomCrop(im_size, im_size), A.HorizontalFlip(p=0.5), A.RandomBrightnessContrast(), A.Normalize((0.5), (0.5)), ], keypoint_params=A.KeypointParams(format='xy', angle_in_degrees=False))

aug_val = A.Compose([
A.Resize(768, 1024), A.Normalize((0.5), (0.5)), ], keypoint_params=A.KeypointParams(format='xy', angle_in_degrees=False))
class MyDataset(Dataset): def init (self, files, aug): self.files = files self.aug = aug
def len (self): return len(self.files)
ps = m['image_info'][0][0][0][0][0] rst = self.aug(image=im, keypoints=ps) im = rst['image'] ps = rst['keypoints'] dm = np.zeros((im.shape[0], im.shape[1]), dtype=np.float32) for x, y in ps: x = int(x) y = int(y) dm[y, x] = 1 sigma = 4 dm = gaussian_filter(dm, sigma=sigma, truncate=4*sigma)
dm = cv2.resize(dm, (im.shape[1] // 4, im.shape[0] // 4), interpolation=cv2.INTER_LINEAR) dm *= 1 im = torch.from_numpy(im) dm = torch.from_numpy(dm)
return it, dm
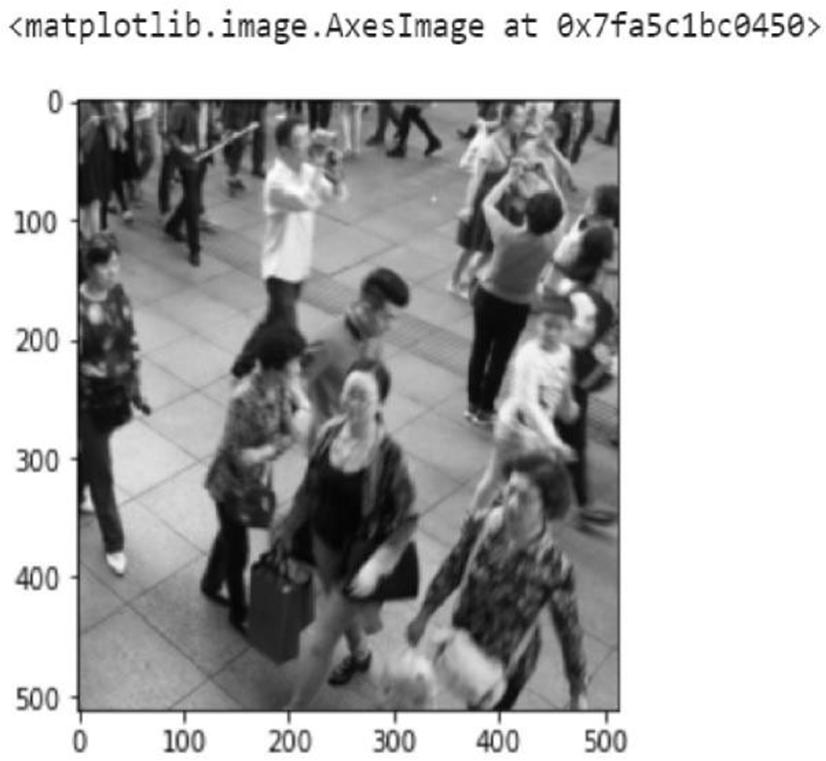
We now display some of our data instances after data augmentation. ds = MyDataset(train, aug_train) im, dm = ds[0] plt.imshow(im, cmap='gray') Subsequently, we display the Gaussian filters. plt.imshow(dm)
These steps conclude our data visualization and preparation.
ISSN: 2321-9653; IC Value: 45.98; SJ Impact Factor: 7.538 Volume 10 Issue XII Dec 2022- Available at www.ijraset.com


The next step is that of designing building and training CNN, We will design some helper functions which will be called for convenience throughout the model building process. The following class and function define a CNN model and a forward pass in PyTorch lightening.
In the following class and function, we build our CNN model by making calls to thepreviouslydefined function and class. class MCNN(LightningModule):


ISSN: 2321-9653; IC Value: 45.98; SJ Impact Factor: 7.538 Volume 10 Issue XII Dec 2022- Available at www.ijraset.com
Multi-column CNN ''' def init (self, lr, batch_size, max_steps, bn=False): super(MCNN, self). init () self.lr = lr self.save_hyperparameters() self.use = 0 x = self.fuse(x) elif self.use == 1: x = self.out1(x1) elif self.use == 2: x = self.out2(x2) elif self.use == 3: x = self.out3(x3) return x.squeeze(1) Now having defined our model, we proceed to train the model. For training, we define the following helper functions and subsequentlycall them. gt_sum = torch.round(y.sum(dim=(1,2))).int() acc = (pred_sum == gt_sum).float().mean() mae = torch.abs(pred_sum –gt_sum).float().mean() self.log('train_loss', loss) self.log('train_acc', acc) self.log('train_mae', mae) return loss def validation_step(self, batch, batch_idx): with torch.no_grad(): self.eval() x, y = batch
pred = self(x) loss = self.crit(pred, y) pred_sum = torch.round(pred.sum(dim=(1,2))).int() gt_sum = torch.round(y.sum(dim=(1,2))).int() acc = (pred_sum == gt_sum).float().mean()
scheduler = { 'scheduler':torch.optim.lr_scheduler.OneCycleLR(optimizer,max_lr=self.lr, total_steps=self.hparams.max_steps, pct_start=0.1, cycle_momentum=False), 'interval': 'step', 'frequency': 1 } return [optimizer], [scheduler]

We now pass our training parameters, begin training and generate the densitymap. batch_size = 32 epochs = 300 max_steps = epochs * len(train) // batch_size trainer=Trainer(gpus=1,max_steps=max_steps,precision=16,benchmark=True,callbacks=[checkpoint_cb, LearningRateMonitor()])
lr = 3e-4
After this, we proceed to display the results on the testing dataset. Note that we can use any crowdimages here. ds = MyDataset(valid, aug_val) d = ds[50][0] plt.imshow(d, cmap='gray') plt.imshow(model(d.unsqueeze(0)).detach()[0]) model(d.unsqueeze(0)).detach()[0].sum()
ISSN: 2321-9653; IC Value: 45.98; SJ Impact Factor: 7.538 Volume 10 Issue XII Dec 2022- Available at www.ijraset.com
A. This research analysis proposed the implementation of a Deep learning algorithm CNN for which the aim was to detect the crowd and estimate increased influx of people which has been successfully achieved by employing deep learning technique.


B. For this study, a dataset was downloaded from the GITHUB website, which has a variety of datasets. This website also has the ShanghaiTech dataset.


C. This dataset from ShanghaiTech has 1198 photos with 330,165 labeled heads. There are two aspects to this: part A and part B.
D. Part A is made up of 482 photographs chosen at random from the internet, while Part B is made up of images taken from surveillance on Shanghai's streets and consists of 716 images.
E. We have used the shanghai tech dataset part B for our research purpose.
F. The result acquired in this technical report is promising. CNN model detected the crowd and estimated the density with an absolute error of 21.

ISSN: 2321-9653; IC Value: 45.98; SJ Impact Factor: 7.538 Volume 10 Issue XII Dec 2022- Available at www.ijraset.com

[1] S. Haque, M. S. Sadi, M. E. H. Rafi, M. M. Islam, and M. K. Hasan, “Real-Time Crowd Detection to Prevent Stampede,” 2020, vol. 56, pp. 665–678.
[2] D. B. Sam, S. V. Peri, N. S. Mukuntha, A. Kamath, and R. V. Babu, “Locate, Size and Count: Accurately resolving people in dense crowds via detection,” arXiv, pp. 1–12, 2019, vol.3,DOI: 10.1109/tpami.2020.2974830.
[3] A. Ghotkar, M. D. Chaudhari, and A. S. Ghotkar, “A Study on Crowd Detection and Density Analysis for Safety Control Indian sign language interpretation View project Hand Gesture Recognition for HCI View project A Study on Crowd Detection and Density Analysis for Safety Control,” Artic. Int. J. Comput. Sci. Eng., 2018, vol.6,doi: 10.26438/ijcse/v6i4.424428.
[4] Z. Huo, B. Lu, A. Mi, F. Luo, and Y. Qiao, “Learning Multi-level Features to Improve Crowd Counting,” IEEE Access, pp. 211391–211400, 2020, vol.8,DOI: 10.1109/ACCESS.2020.3039998.
[5] M. B. Shami, S. Maqbool, H. Sajid, Y. Ayaz, and S. C. S. Cheung, “People Counting in Dense Crowd Images Using Sparse Head Detections,” IEEE Trans. Circuits Syst. Video Technol., vol. 29, no. 9, pp. 2627–2636, 2019, DOI: 10.1109/TCSVT.2018.2803115.
[6] M. Liu, Z. Guo, Z. Wang, N. Y. City, and the U. States, “CROWD COUNTING WITH FULLY CONVOLUTIONAL NEURAL NETWORK JD Finance, Beijing , China . School ofGeosciences and Info-physics , Central South University , Changsha , 410083 , China . Department of Gastroenterology , Beijing ChaoYang Hospital , Beijing , C,” pp. 953–957, 2018. https://ieeexplore.ieee.org/document/8451787/citations#citations
[7] Chen, K.; Loy, C.C.; Gong, S.; Xiang, T. Feature mining for localized crowd counting. In Proceedings of the British Machine Vision Conference; BMVA Press: Surrey, UK, 2012, Volume 1, p. 3. [CrossRef]
[8] Idrees, H.; Saleemi, I.; Seibert, C.; Shah, M. Multi-source multi-scale counting in extremely dense crowd images. In Proceedings of the IEEE Conference on Computer Vision and Pattern Recognition, Portland, OR, USA, 23 Jun 2013; pp. 2547–2554. 43. Vu, T.H.; Osokin, A.; Laptev, I. Context-aware cnns for person head detection. In Proceedings of the IEEE International Conference on Computer Vision, Santiago, Chile, 7 December 2015; pp. 2893–2901.
[9] Lempitsky,V.;Zisserman,A.Learningtocountobjectsinimages. In Advances in Neural Information Processing Systems, Proceedings of the Neural Information Processing Systems 2010, Vancouver, BC, Canada, 6 December 2010; Neural Information Processing Systems Foundation, Inc.: San Diego, CA, USA, 2010; pp. 1324–1332. 47. Loy,C.C.;Chen,K.;Gong,S.;Xiang,T.Crowd counting and profiling: Methodology and evaluation. InModeling, Simulation and Visual Analysis of Crowds; Springer: Berlin/Heidelberg,Germany,2013;pp.347–382. 48. Teo, C.H.; Vishwanthan, S.; Smola, A.J.; Le, Q.V. Bundle methods for regularized risk minimization. J. Mach. Learn. Res. 2010, 11, 311–365.
[10] S Pham, V.Q.; Kozakaya, T.; Yamaguchi, O.; Okada, R. Count forest: Co-voting uncertain number of targets using random forest for crowd density estimation. In Proceedingsof the IEEE International Conference on Computer Vision, Santiago, Chile, 3–17 December 2015; pp. 3253–3261.
[11] Dollar, P.; Wojek, C.; Schiele, B.; Perona, P. Pedestrian detection: An evaluation of the state of the art. IEEE Trans. Pattern Anal. Mach. Intell. 2012, 34, 743–761. J. Imaging 2020.
[12] Li, M.; Zhang, Z.; Huang, K.; Tan, T. Estimating the number of people in crowded scenesby mid based foreground segmentation and head-shoulder detection. In Proceedings of the 19th International Conference on Pattern Recognition (ICPR 2008), Tampa, FL, USA, 8 December 2008; pp. 1–4.
[13] Brox, T.; Bruhn, A.; Papenberg, N.; Weickert, J. High accuracy optical flow estimation based on a theory for warping. In EuropeanConferenceonComputerVision; Springer: Berlin/Heidelberg, Germany, 2004; pp. 25–36.
[14] Dalal, N.; Triggs, B. Histograms of oriented gradients for human detection. In Proceedings of the Computer Vision and Pattern Recognition, CVPR 2005, San Diego, CA, USA, June 20 2005; Volume 1, pp. 886–893.

[15] Wu, B.; Nevatia, R. Detection of multiple, partially occluded humans in a single image bybayesian combination of edge let part detectors. In Proceedings of the 10th IEEE International Conference on Computer Vision (ICCV’05), Beijing, China, 17 October 2005; Volume1, pp. 90–97.
[16] Ali,S.;Shah, M.Alagrangian particle dynamics approach for crowd flow segmentation andstability analysis. In Proceedings of the 2007 IEEE Conference on Computer Vision and Pattern Recognition, Minneapolis, MN, USA, 22 June 2007; pp. 1–6.
[17] Sabzmeydani, P.; Mori, G. Detecting pedestrians by learning shapelet features. In Proceedings of the Computer Vision and Pattern Recognition (CVPR’07), Minneapolis, MN, USA, 17 June 2007; pp. 1–8.
[18] Chang, C.C.; Lin, C.J. LIBSVM: A library for support vector machines. ACM Trans. Intell. Syst. Technol. (TIST) 2011, 2, 1–27.
[19] Gall, J.; Yao, A.; Razavi, N.; Van Gool, L.; Lempitsky, V. Hough forests for object detection, tracking, and action recognition. IEEE Trans. Pattern Anal. Mach. Intell. 2011, 33, 2188–2202.
[20] Lempitsky, V.;Zisserman, A .Learning to count objects in images. In Advances in Neural Information Processing Systems, Proceedings of the Neural Information Processing Systems 2010, Vancouver, BC, Canada, 6 December 2010; Neural Information Processing Systems Foundation, Inc.: San Diego, CA, USA, 2010; pp. 1324–1332.
[21] Sirmacek, B.; Reinartz, P. Automatic crowd density and motion analysis in airborne image sequences based on a probabilistic framework. In Proceedings of the 2011 IEEE International Conference on Computer Vision Workshops (ICCV Workshops), Barcelona, Spain, 6–11 November 2011; pp. 898–905.
[22] Chen, K.; Loy, C.C.; Gong, S.; Xiang, T. Feature mining for localised crowd counting. In Proceedings of the British Machine Vision Conference; BMVA Press: Surrey, UK, 2012, Volume 1, p. 3.
[23] Idrees, H.; Saleemi, I.; Seibert, C.; Shah, M. Multi-source multi-scale counting in extremely dense crowd images. In Proceedings of the IEEE Conference on Computer Vision and Pattern Recognition, Portland, OR, USA, 23 Jun 2013; pp. 2547–2554.
