https://doi.org/10.22214/ijraset.2023.49779

11 III
2023
March
ISSN: 2321-9653; IC Value: 45.98; SJ Impact Factor: 7.538
Volume 11 Issue III Mar 2023- Available at www.ijraset.com

https://doi.org/10.22214/ijraset.2023.49779
ISSN: 2321-9653; IC Value: 45.98; SJ Impact Factor: 7.538
Volume 11 Issue III Mar 2023- Available at www.ijraset.com
Hariprsad G1, Megha Yadav2, SantoshKumar3, Nagesh Sugandhi4
1PG Student, 2, 3, 4Assistant Professor
1, 2Department of Civil Engineering, Bheema Institute of Technology and Science, Kurnool, Andra Pradesh, India
3, 4Department of Civil Engineering, Navodaya Institute of Technology, Raichur, Karnataka, India

Abstract: Traffic analysis is basically the process of intercepting and examining the number of vehicles on the road and deducing the pattern of traffic movement. A traffic survey on Basaveshwara Circle, Chandra mouleshwara circle and Osman Gunj Circle Intersection of Raichur city has been carried out which includes calculation of present traffic density and analysis of traffic volume by adopting the manual method of counting PCU estimations are made and appropriate design by Webster method and corrections are suggested for highway geometry. For the proposed design geometry, the signal time is optimized.
Keywords: Signal Optimization, Traffic Volume Count, PCU Estimation and Geometric Design.
Transport Planning or Transportation is a fundamental element for functioning of any society, region or state and also an important place in modern life and contributes to the Economic, Industrial, Social and Cultural development of any country. The Ability to move people and goods from one location to another is the primary function of a transport of a system. The capabilities of modern transport technology have not been fully exploited to a large extent in Indian cities due to the limitations imposed by uncontrolled urban growth and rapid industrialization.
From the definition of transportation planning we find that “Transportation planning is the field involve with the siting of Transportation facilities (generally street, highways, sidewalks, bike lanes and public transport lines). Traffic capacity of any road is an important part of planning.
It influences the traffic flow in a city. Traffic capacity is expressed as the maximum number of vehicles a lane that can pass a specified point in unit time usually an hour. The volume of traffic repeats not only the number of people requiring to be moved but also their affluences. The volume of transport between two urban centres depends upon the quantity of highways and availability of various transportation modes between these urban centres. The volume also depends upon the interaction between these urban centres.
The selected intersection which is having a much traffic flow due to the less width of the roads and the maximum people will travel in this intersection. Such that due to this problem it will lead to accidents, traffic congestions and delay in travel time. To solve these problems, the study of the present traffic volume and analysis should be made with regard to road geometry like increasing the road width and signal time. By addressing these two issues, the traffic problem can be solved to little extent.

Theextensive literaturereview paved thewayfor defining thefollowing objectives for this study:
1) To achieve smooth and easyflow of the traffic atintersection
2) To develop methods for improvement in generaland solving specific problem in particular.
3) Tohavesafe, convenient, rapid and economic transport of persons and goods.
4) To improve the speed of vehicle.
5) To provide a basis for future studies of road expansion.
6) Toremove the traffic congestion.
7) To reduce the chances of road accidents to aminimum.
ISSN: 2321-9653; IC Value: 45.98; SJ Impact Factor: 7.538
Volume 11 Issue III Mar 2023- Available at www.ijraset.com
Raichur District is a district in the state of Karnataka. The district is bounded by the Krishna River on the north and the Tungabhadra River on the south. The general slope of the district is from the north-west towards the south-east, its average height above the Mean Sea-Level being just 1,311 feet. Among the type of vehicles plying on Raichur roads, two wheelers constitute majority share with 28% of the total vehicles. Public transport i.e. Buses, contributes only 3%of traffic to Raichur roads whereas share of intermediate transport i.e. auto-rickshaw and maxi-cabs, is about 16% of the total vehicular traffic. However, the nonmotorized mode of transport i.e. cycles, constitutes a substantial share of the total traffic (about 24%).
The study area is selected at Basaveshawara Circle Intersection in Raichur.

In the present study, traffic volume studies are studied at an intersection for a period of 4 months for a period of 8 hours along the different movement at a intersection. General observations were made for a period of two months for Raichur city roads and Sindhanur- Gadwal road stretch is selected because of the more traffic flow in this road section Intersection at Basaveshwara Circle with traffic signal is identified located near the railway crossing in thecity. Traffic volume count analysis methods were studied and formats for traffic volume count were prepared. Traffic volume studies are conducted to determine the type of vehicles and movements at a given location. These data can help identify critical flow time periods, determine the influence of large vehicles orpedestrians or on vehicular traffic flow or document traffic volume trends.

The length of the sampling period depends on thetype of count being taken andtheintended use ofthe datarecorded. For example, an intersection count may be conducted during the peak flow period. If so, manual count with 15- minute intervals could be used to obtain the traffic volume data.
Manual counts are typically used to gather data for determination of vehicle classification, turningmovements, direction of travel, pedestrian movements, or vehicle Occupancy. In the present study, manual count method is adopted for studying the type and traffic volume composition at Basaveshwara Circle Intersection.
The following Table 1 represent the format adopted for traffic volume count for morning peak andevening peaks. Traffic counts during a Monday morning rush hour and a Friday evening rush hour mayshow exceptionally high volumes and are not normally used in analysis; therefore, counts are usually conducted on a Tuesday, Wednesday Thursday. Analysis of results will be made using plots and graphs.
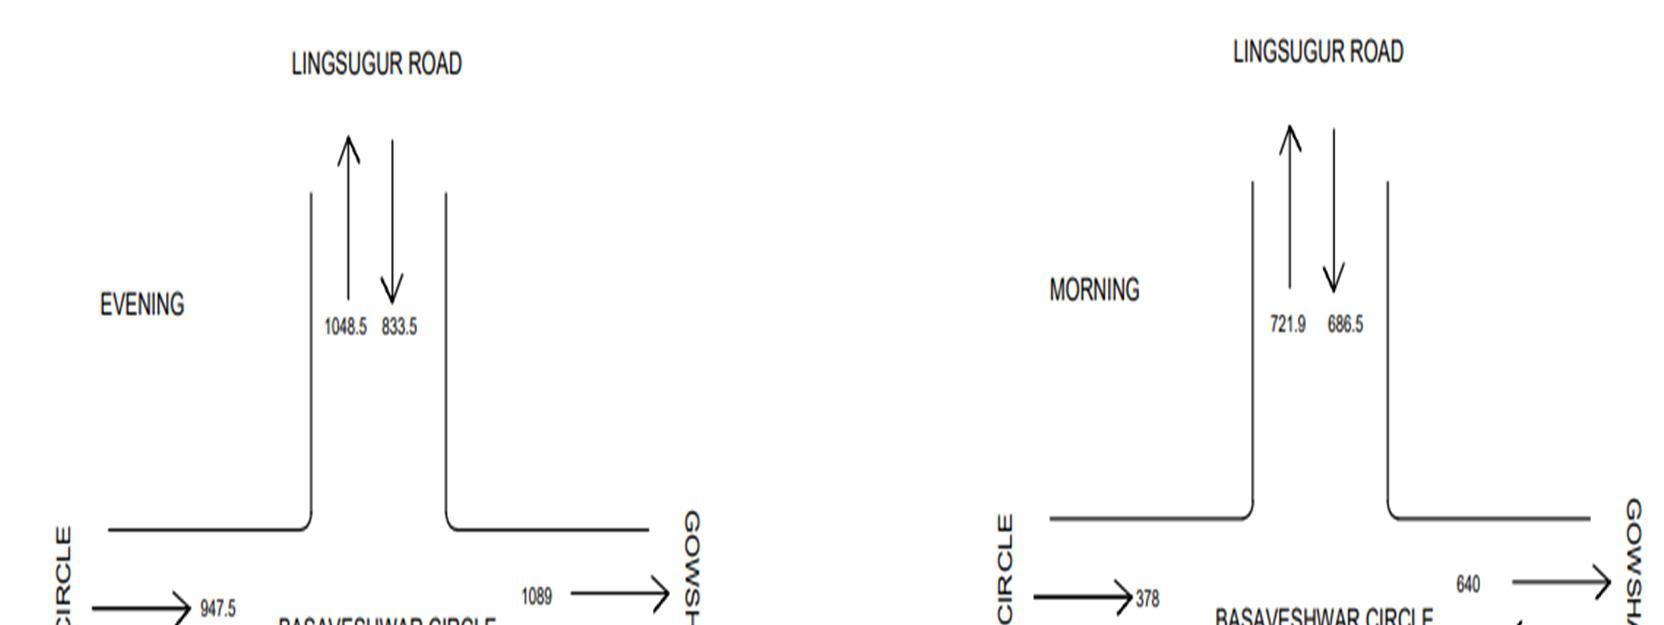
The results analysis made using bar chart and pie chart can be used to analyze the result.Appropriate geometric designs are made based on the volume of traffic.
In the second phase of the work, existing signal time was recorded for the Aruna Circle Intersection. Using trial cycle method, the traffic signal time is optimised.


ISSN: 2321-9653; IC Value: 45.98; SJ Impact Factor: 7.538


Volume 11 Issue III Mar 2023- Available at www.ijraset.com
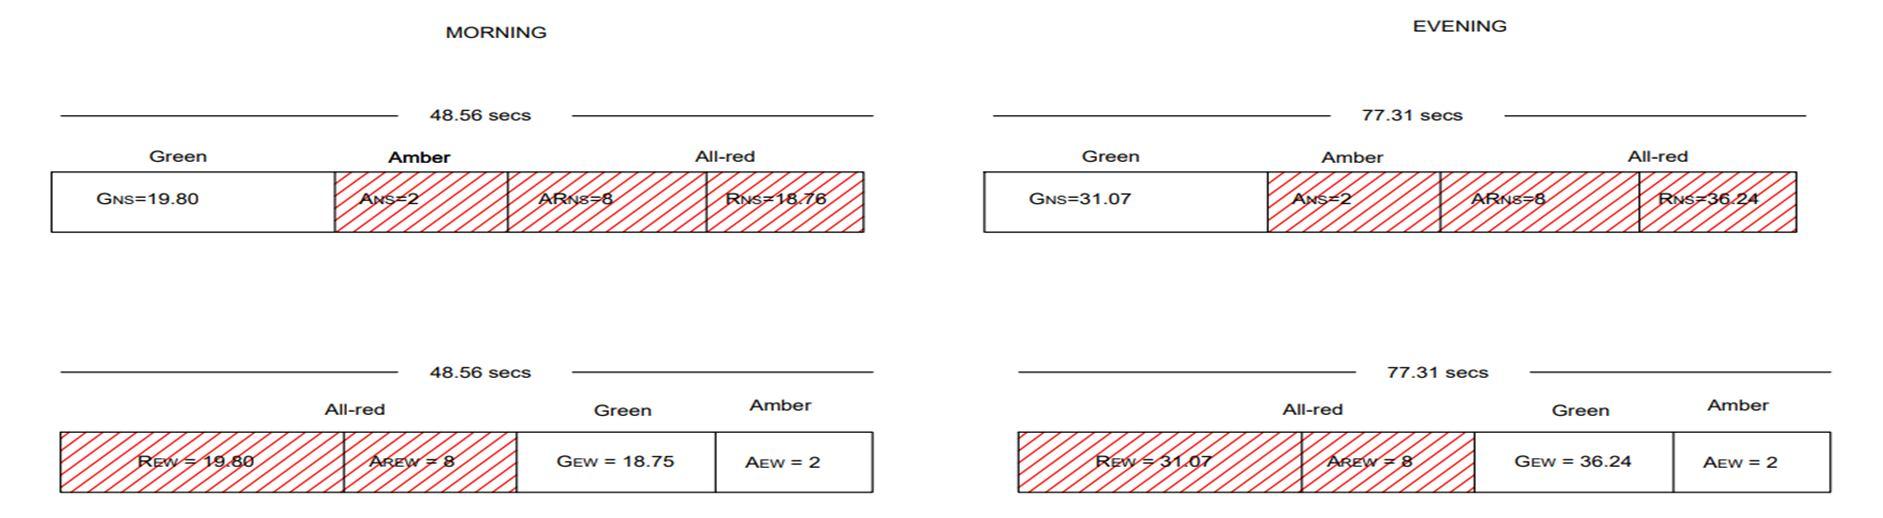
Webster’s Method: The optimum signal cycle is given by: Co = 1.5L + 5/1 – Y where L = total lost time per cycle, seconds = 2n + R (n is the number of phase and R is all red-time) and Y = y1 + y2 Then, G1 = y1/Y(Co – L) and G2 = y2/Y(Co – L). Similar procedure is followed when there is more number of signal phases.


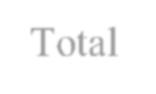
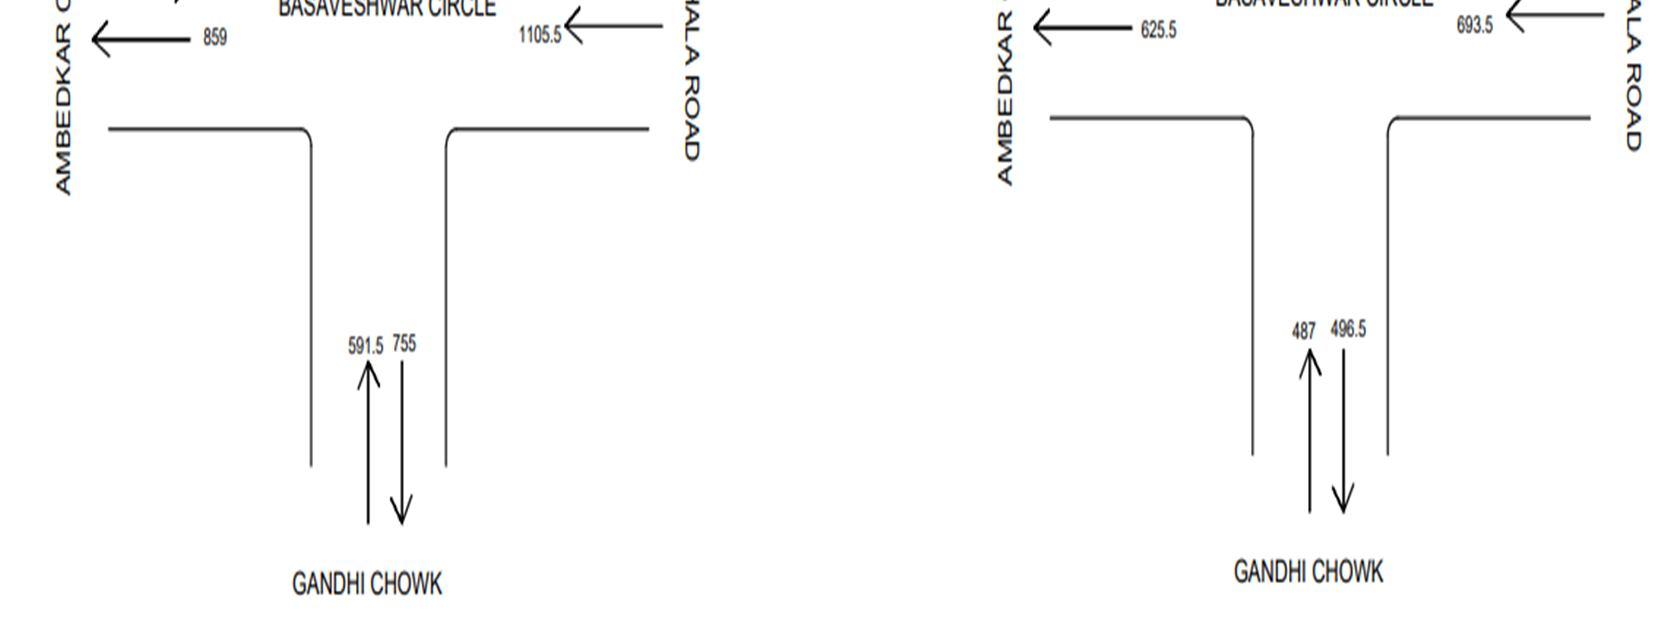
The following observations were made at Basaveshwara Circle Intersection with eight different movements of traffic is tabulated and theresults areplotted.


ISSN: 2321-9653; IC Value: 45.98; SJ Impact Factor: 7.538


Volume 11 Issue III Mar 2023- Available at www.ijraset.com
ISSN: 2321-9653; IC Value: 45.98; SJ Impact Factor: 7.538


Volume 11 Issue III Mar 2023- Available at www.ijraset.com

ISSN: 2321-9653; IC Value: 45.98; SJ Impact Factor: 7.538
Volume 11 Issue III Mar 2023- Available at www.ijraset.com
ISSN: 2321-9653; IC Value: 45.98; SJ Impact Factor: 7.538
Volume 11 Issue III Mar 2023- Available at www.ijraset.com
The present study concludes that the proposal suggested at Basaveshwar circle can be adopted for the smooth and easy flow of traffic without causing delays. The proposal is made with the design corrections in highway geometry like widening the roads at intersection, providing adequate drainage facilities, signal optimization, pedestrian crossings, increasing in turning radius for safe convenient rapid and economic travel of road users. The width of the intersection is increased from 18 m to 22 m with appropriate design aspects. The signal time is optimized to 90and 69seconds for each lane according to the proposed design geometry. The proposed signal time is increased from 60 seconds to 90seconds and 69seconds for Basaveshwar circle respectively. Hence, it can be concluded that this increase in signal time will reduce the traffic delays and also it reduce the road accidents. It can also be concluded that due to the adequate provision of pedestrian crossing the rate of pedestrian accidents may be minimized.
[1] “Highway Engineering” – Khanna S.K. and Justo, Nemchand and Bros.
[2] “Highway Engineering” – Srinivas Kumar.
[3] “Traffic Engineering and Transport Planning” – L.R. Kadiyalikhanna Publishers.
[4] “Traffic Flow Theory” – Drew McGraw Hill & Co.
[5] “Transportation Engineering and Planning” – Papa Coastas and Prevendors, PHI, New Delhi.
[6] “Indian Transport Yearbook 2014-15”
[7] IRC Journals: Journal of Transportation Engineering/Vol. 122, Issue 6, Nov. 1996
[8] Sanjana Kulkarni et.al , “Sustainable Traffic Management and Signal Time Optimisation at aruna intersection, Davanagere” 2018. – Infra-Road Tech 2019 Proceeding of Fourth National Conference on Road and Infrastructure.
[9] Ramyashree S et.al , “Traffic Impact Study and Signal Design at Nagvara Junction” Benguluru, Karnataka, India 2019. Infra-Road Tech 2019 Proceeding of Fourth National Conference on Road and Infrastructure.
[10] Shreyansh N. Rawalet al. 2019 “Traffic volume count and signal optimization at railway station circle and pooja circle, davanagere”-Infra-Road Tech 2019 Proceeding of Fourth National Conference on Road and Infrastructure.
[11] Venugopala et al.2019 “Analysis of junction and traffic data for the improvement of the Yelahanka police station circle” -. Infra-Road Tech 2019 Proceeding of Fourth National Conference on Road and Infrastructure.
[12] S Raj et al. 2019 “Vehicle volume actuated variable timing signal design”-Infra-Road Tech 2019 Proceeding of Fourth National Conference on Road and Infrastructure.
[13] Likhita M et al. 2018 “Study of Traffic Flow characteristics on urban divided roads”- Infra-Road Tech 2019 Proceeding of Fourth National Conference on Road and Infrastructure.
[14] IRC:9-1972, “Traffic Sensus of Non-urban Roads”.
[15] IRC:86-1983, “Geometric Design Standard for Urban Roads in Plain Area”.
[16] IRC:93-1985, “Guidelines for Design and Installation of Traffic Signals”.
[17] IRC:106-1990, “Guidelines for capacity of Urban Road in Plain Area”.