10 XI November 2022 https://doi.org/10.22214/ijraset.2022.47322
ISSN: 2321 9653; IC Value: 45.98; SJ Impact Factor: 7.538 Volume 10 Issue XI Nov 2022 Available at www.ijraset.com

ISSN: 2321 9653; IC Value: 45.98; SJ Impact Factor: 7.538 Volume 10 Issue XI Nov 2022 Available at www.ijraset.com
Mr. Mohd. Aqdas Y Fadnaik 1, Mr. Vinay Deulkar 2
2Asst. Professor & Head, 1Department of Civil Engineering, Jawaharlal Institute of Technology Borawan, Khargone (M.P.) 451228

Abstract: Hubli Dharwad is now increasing in importance as a Commercial, Industrial, and educational centre. Traffic congestions in the city is increasing day by day due to extensive urbanization and industrialization along the Hubli-Dharwad belt, this has led to major intersections in the cities being saturated resulting in traffic congestion and delays subsequently increasing the vehicle operating cost and pollution levels in the cities. Rani Chennamma Junction in the city of Hubli is one such junction, its seven arms serve as the arterial roads of the Hubli city. The old NH-4 connecting the NH 48 is the southern arm of the junction, NH 67 (previously NH 63) forms the two arms of the junction, NH 52 heading towards Vijayapura makes the north arm of the junction, the rest arms of the junction are Arterial roads of Hubli city. As per the Comprehensive Traffic & Transportation Plan (CTTP) report, some of the junction experiences traffic snarls and needs an immediate attention in terms of engineering interventions. It is also noted that there is lack of pedestrian’s facilities at most of the major junctions that need to be investigated to avoid pedestrian vehicular conflicts at junction. The traffic trend observed in the CTTP report requires treatment at this junction to decongest the junction in the form of grade separated structures so that the majority portion of vehicles can bypass the at-grade conflicts and greatly reduce the traffic conflict points. This Study shall provide engineering solutions to cater to the increased congestion on the seven arm Rani Chennamma junction.

The Hubli Dharwad corridor is one of the important industrial corridors and the government wants to tap the potential of this corridor to facilitate the investment along this corridor [2] Since this corridor is between the two cities of Hubli & Dharwad, the government wants to upgrade the transport infrastructure along this corridor to facilitate seamless transportation movement. Hubli Dharwad city has a well developed road network system, connecting it to various cities across the states. The major roads in both cities follow a radial pattern. Roads originating from the centre of Hubli city connect the city with major towns like Bijapur, Karwar, Marmagoa, and Sholapur. Various National Highways such as NH 48 (Mumbai Bengaluru), NH 67 (Ramnagar, near Belgavi to Krishnapatnam Port road in Andhra Pradesh) & NH 52 (Punjab Ankola, Karnataka) are connected to Hubli. To access the Industrial corridor along the Hubli Dharwad Road, the heavy vehicles need to enter the city further congesting its roads. The Traffic congestion is the most at the major junctions such as Rani Chenamma junction, Hosur Junction, Vikas Nagar junction, Kamaripeth Junction, New English Medium School Junction & Bankapur Junction. The twin city has a large share of registered two wheelers (approximately 71%). During the past decade, Hubli has seen considerable economic and per capita growth rate due to which the number of motor vehicles has increased. The registered vehicles are growing at 7.1% annually In some Tier 2 cities, trip generation is increasing every year due to urban migration and transportation infrastructure facilities become the backbone of the city. The available capacity of transport network in terms of number of vehicle (PCU) in peak hour as per IRC 106 1990 is to be studied To decongest Rani Chennamma junction & other various nearby junction, existing decongestion levels are to be studied & various decongestion solutions are to be studied to provide ease of flow of traffic plying on these roads and junctions. It is necessary to maintain both quality and quantity of road infrastructure continuously to maintaining good Level of Service and safety on roads. However, due to lack of Mass Transit / Transit Oriented Developments and improper transportation planning, commuters face major traffic issues during peak hour.
The primary objective of this study is to decongest the traffic on Rani Chenamma junction in the city of Hubballi & provide seamless connectivity from Hubli Railway Station to Hubli Airport by proposing various traffic decongestion solutions. The Study will make use of the primary and secondary data available for the corridor and of the influence area around the project.
ISSN: 2321 9653; IC Value: 45.98; SJ Impact Factor: 7.538

Volume 10 Issue XI Nov 2022 Available at www.ijraset.com
To achieve the above objectives, following studies are proposed to be done:
1) Reconnaissance survey to study the existing site features, traffic flow, traffic circulation, Carriageway type & width, to identify the bottlenecks along the site corridor, if any, vehicle characteristics along the project corridor, etc.
2) Collection of Primary Data from the site through the following surveys:
a) Road Inventory & Condition Survey
b) Classified Traffic Volume Count at Mid blocks
c) Turning Movement Survey at Junctions
d) Origin Destination Survey
e) Axle Load Survey
f) Subgrade characteristics and strength
3) Along with the Primary Data collection through various surveys listed, secondary data will also be collected from client.
4) Detailed traffic analysis will be done based on the data collected. This traffic analysis will provide results like current Level of Service of project corridor, traffic pattern along the project corridor, travel characteristics of road users, bottlenecks on the road network, etc.
5) Based on Traffic analysis, traffic solutions to decongest the project corridor and to provide various traffic mitigation solutions to provide seamless connectivity between the Hubli airport and railway station.
As per the scope of the work, various surveys are conducted for to understand the existing traffic scenario of the project corridor Reconnaissance Survey was initially done to check the various site characteristics such as area, topography, terrain, no. of lanes along the project road, presence of median, existing ROW available, no. of major intersections, minor intersections, existing pavement type and pavement conditions, presence of drains along the project corridor, type of drain, land use pattern, presence of any important buildings, identification of congestion area/bottlenecks, presence of any utilities along the project corridor and other project specific parameters required. Primary Data collection is done on the project site such as Topographic Survey, Road Inventory surveys to get the details of the various parameters of the road, Road condition Survey, Traffic surveys are conducted on the site such as Classified Traffic Volume count, Origin Destination Survey, Turning Movement Count Survey at main intersections, Benkelman Beam Deflection test to ascertain the pavement strength, Axle Load Survey. Secondary Data collection will be done for procuring the various data in the form of reports published by various government agencies such as PWD, NHAI, BRTS, Town Planning & other agencies. Based on the primary data and secondary data available, Traffic Survey analysis is done according to the various guidelines given in IRC 106 1990 (Guidelines for Capacity of Urban Roads in Plain Areas), IRC:65 2017 (Guidelines for planning and design of Roundabouts), IRC: SP 90 2010 (Manual for Grade separators and Elevated structures). Study Approach and Methodology for Traffic Analysis & Design solutions is shown in the flow chart below.
ISSN: 2321 9653; IC Value: 45.98; SJ Impact Factor: 7.538
Volume 10 Issue XI Nov 2022 Available at www.ijraset.com
To arrive at the present traffic scenario and appreciate the travel characteristics of the road users in this area, primary studies were done based on the traffic survey inputs
The observations from the field studies have been presented below: The objective of these surveys is to collect primary data on all factors that are likely to influence travel patterns. The work involves a number of traffic surveys so as to have an inventory of existing transportation facilities and an inventory of existing land use and economic activities.
The data collection is done through both primary surveys and also through secondary data collection. The primary surveys that have been conducted are as follows:
Selected locations have been chosen with major traffic flow for volume count. It is also necessary to estimate the number of passengers traveling in passenger vehicles. This can be achieved by enumerating number of passengers traveling by passenger vehicles. The survey has provided the traffic composition by various modes and relative importance of the links in the road network. The directional classified traffic volume counts, observed at various count stations, have been analysed to obtain:
1) Hourly variation and
2) Peak Hour Flows
3) Directional distribution
4) Traffic composition (Modal Split)
The traffic survey was carried out continuously for 24 hours. The traffic count survey provides useful data for assessing the traffic movements from existing and proposed developments within the study area. The mid block traffic count survey was conducted as per the provisions of IRC Guidelines.
Turning movement count survey provides inputs for developing capacity augmentation proposals in the study area along with conceptual layout of grade separators etc. Turning movement counts were taken at the nominated intersections in the study area for 24 hour duration.
The classified turning movement counts, observed at various intersections were analysed to obtain:
1) Total Passenger Car Units (PCUs) on each turning movement.
2) Junction flow diagram.
3) Hourly variation and peak hour flows.
4) Traffic Composition.
The traffic survey was carried out continuously for 24 hours. The turning movement count survey was conducted as per the provisions of IRC Guidelines (IRC SP 41:1994). Turning movements were undertaken at all major junctions along the project stretch.
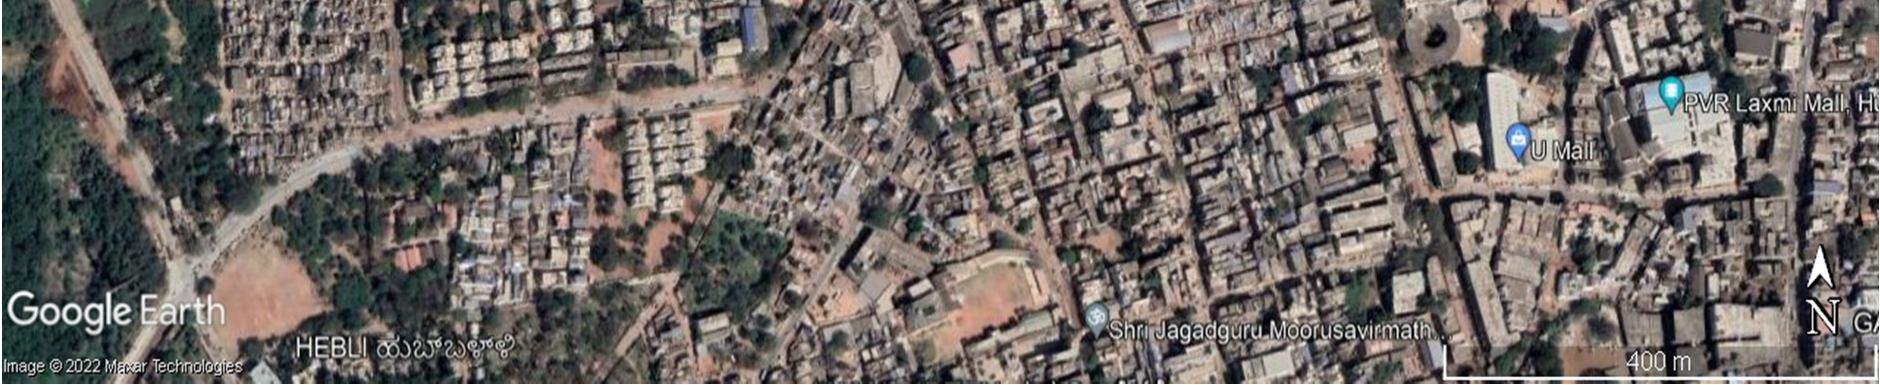
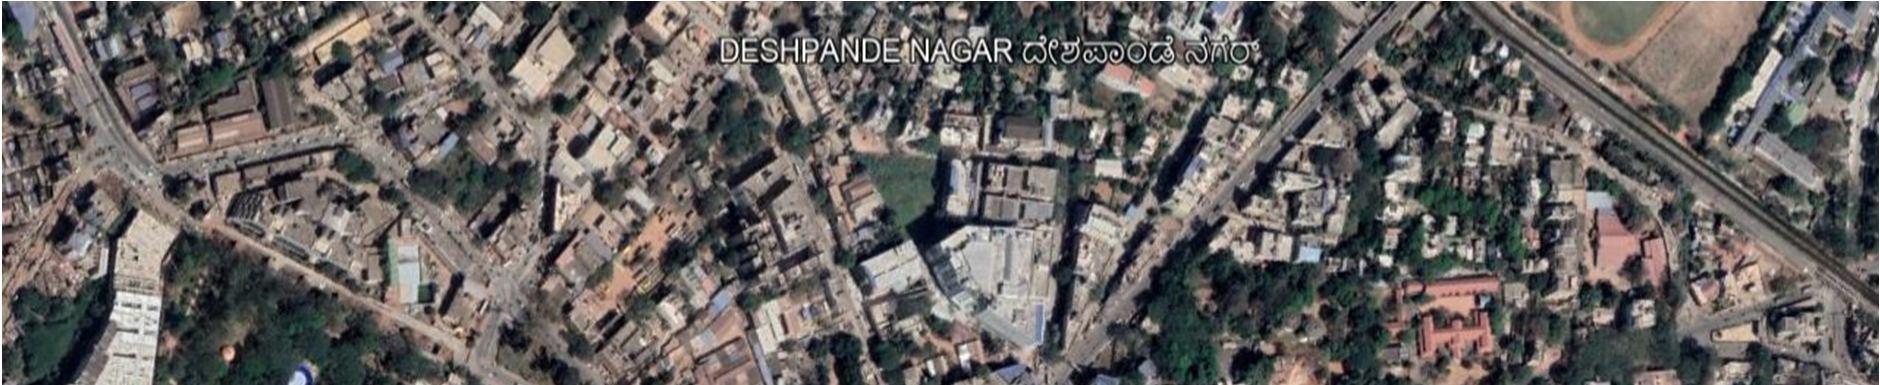
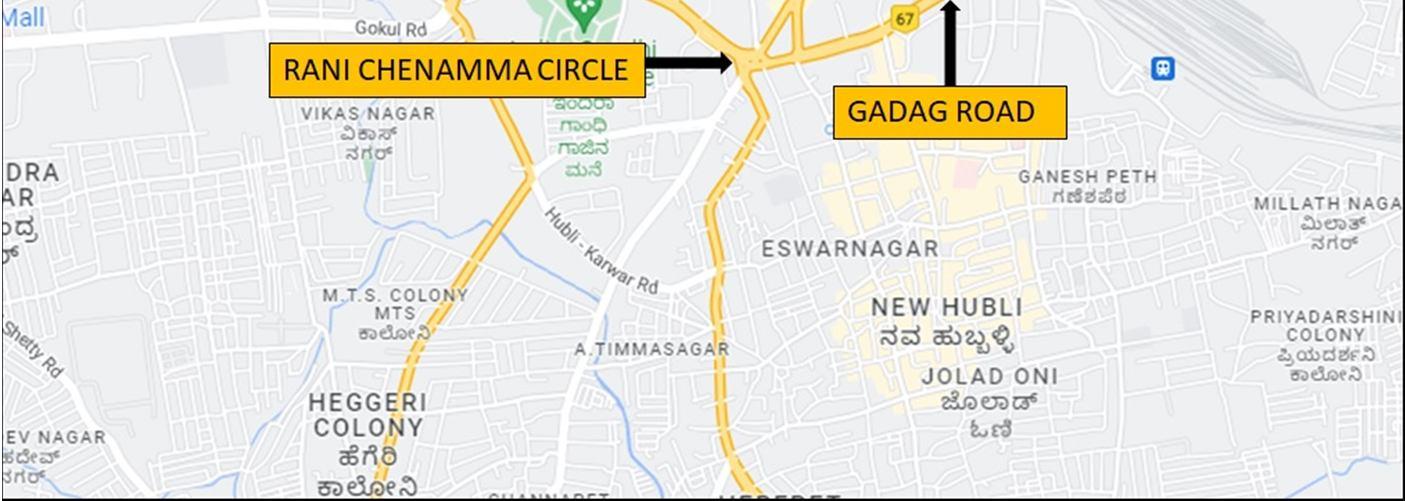
The following surveys were conducted in Hubli as shown in figure 1:
1) Midblock Count Survey at: Gadag Road Dharwad Road
2) Turning Movement Count at: Rani Chennamma Circle
ISSN: 2321 9653; IC Value: 45.98; SJ Impact Factor: 7.538 Volume 10 Issue XI Nov 2022 Available at www.ijraset.com
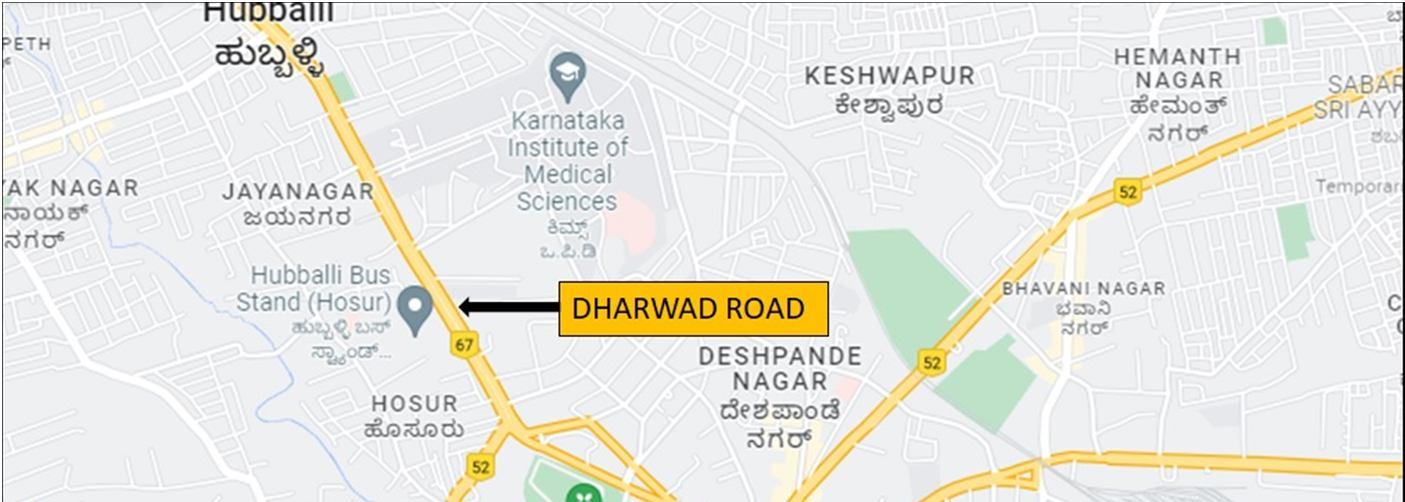
This is a major intersection and attracts about 1.6 lakhs vehicles in day. Being adjacent to Old Hubballi Bus Depot and old city markets it attracts heavy traffic for entire day. The road connecting Railway Station on the west and Hubli Airport / at the west and Dharwad at the north of this junction.
ISSN: 2321 9653; IC Value: 45.98; SJ Impact Factor: 7.538 Volume 10 Issue XI Nov 2022 Available at www.ijraset.com
Major traffic is coming from Rayanamma circle A (50%) from Gadag Road, and Bus stand road E i.e., Dharwad side (30%).
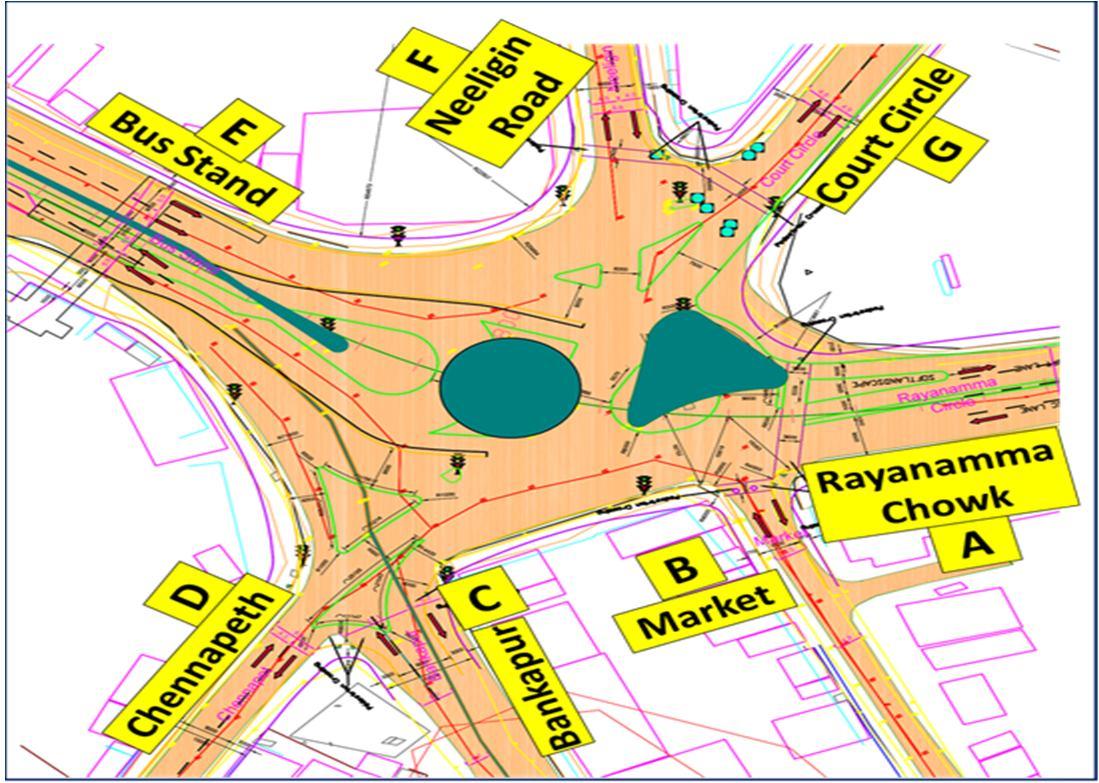
Table 1 Peak Hour Distribution
Sr. No. Leg Name AM(PCU’s) Noon (PCU’s) PM(PCU’s) 11.00 12.00 01.00 02.00 06.00 07.00
A Rayanamma Circle 39% 43% 52%
B Market Road 1% 1% 0%
C Bankapur Road 9% 16% 12%
D Chennapet road 11% 9% 5%
E Bus Stand (Dharwad) 32% 25% 23%
F Neelgin Galli 8% 7% 8% G Court Circle One way One way One way
Total 100% 100% 100% 10536 11559 12515
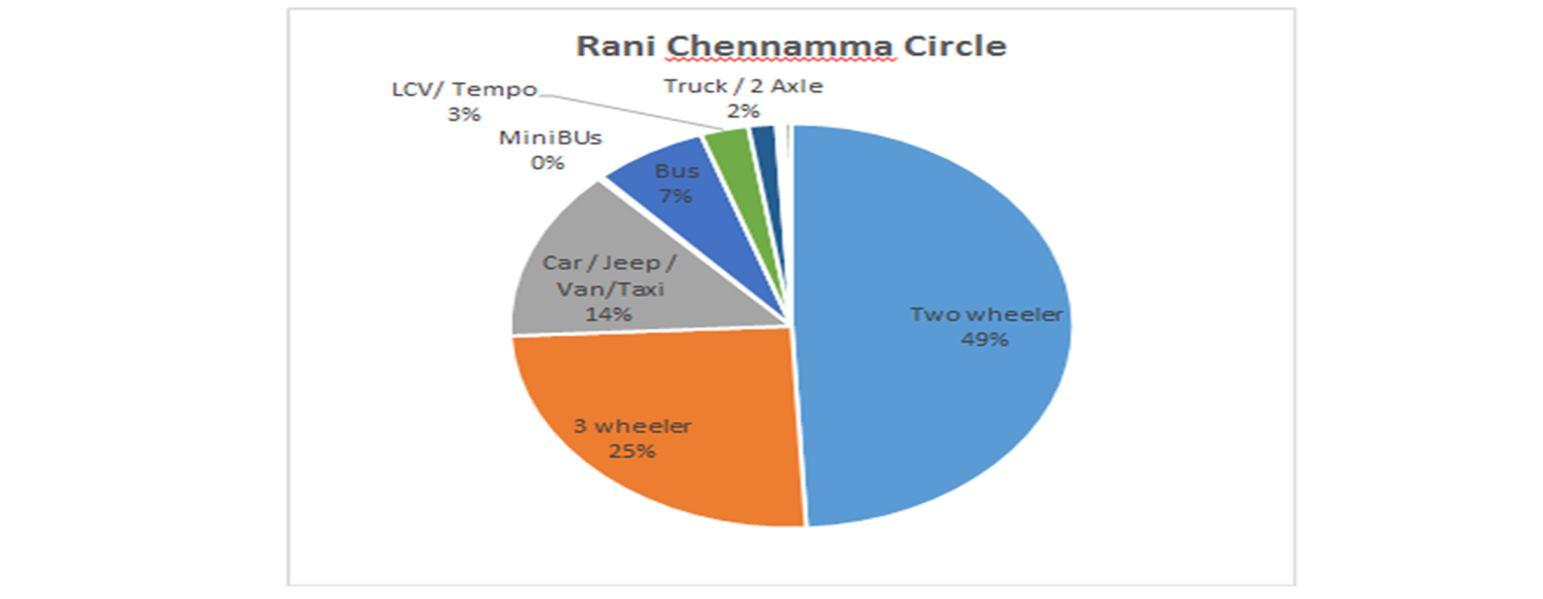
The modal split analysis yields that the majority of vehicles are 2 wheelers (49%) followed by 3 wheelers / Auto rickshaw (25%) and then by Car (14%).
ISSN: 2321 9653; IC Value: 45.98; SJ Impact Factor: 7.538
Volume 10 Issue XI Nov 2022 Available at www.ijraset.com
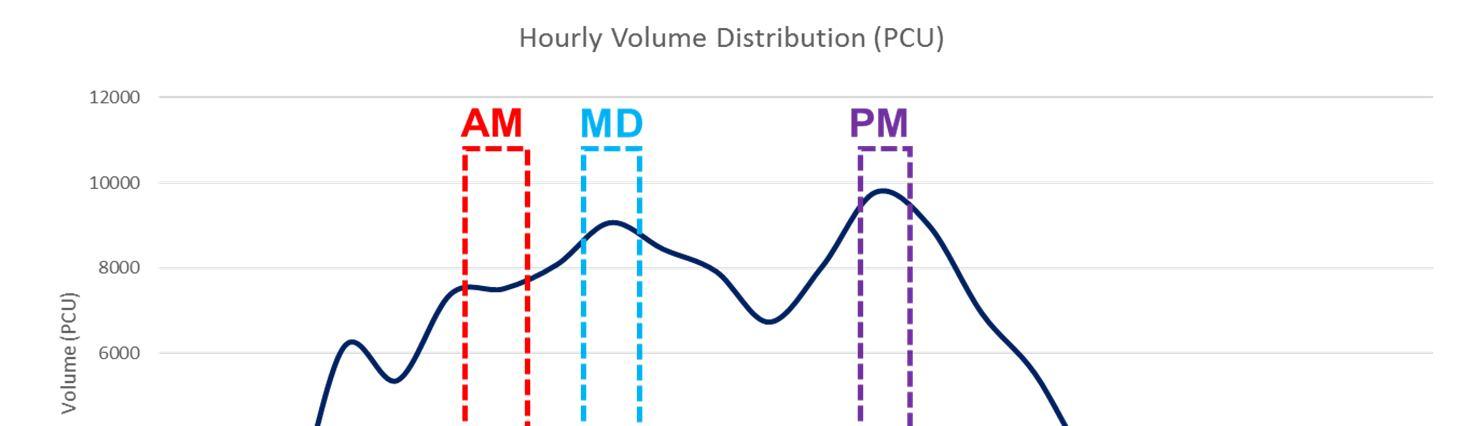
The hourly variation analysis indicates three peak hours, in morning, evening and mid afternoon. The maximum of these three happens in evening between 6 7pm.
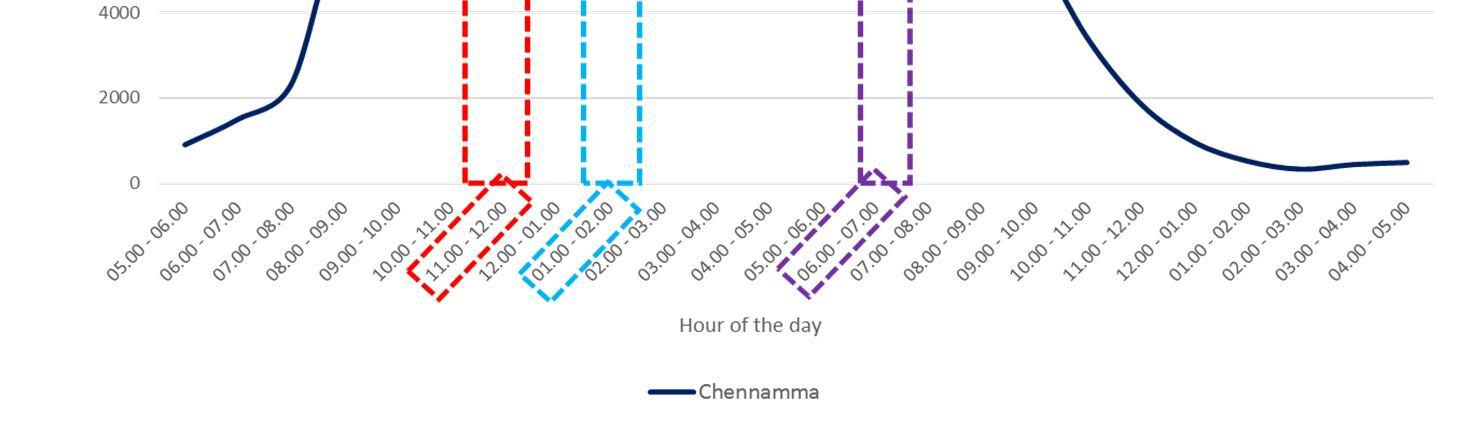
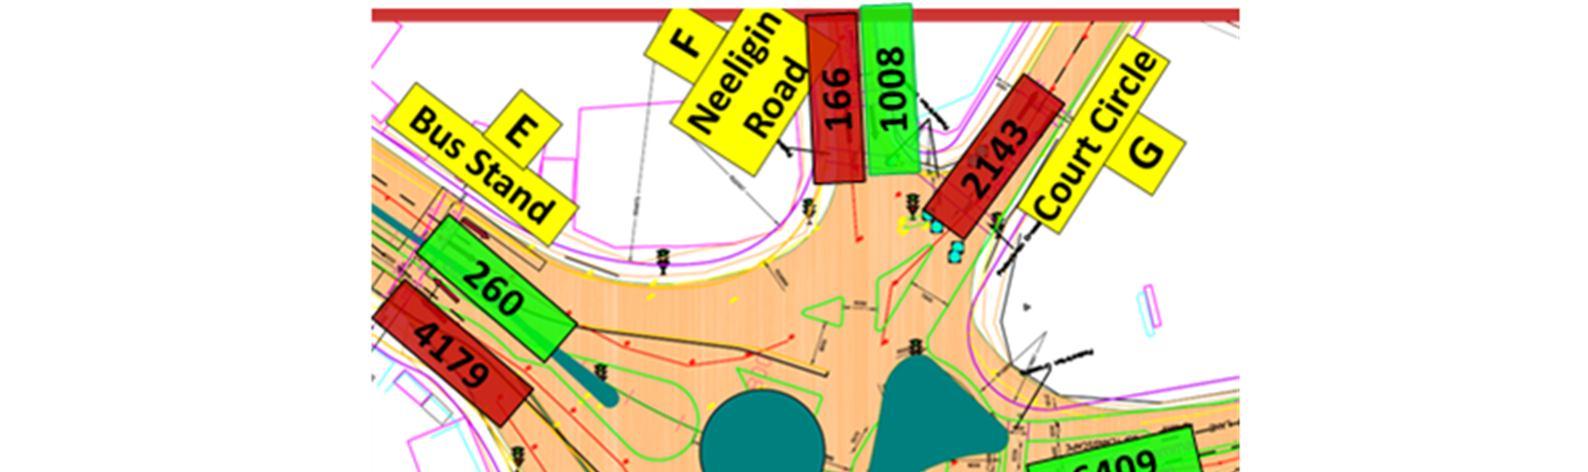
The chart below indicates peak hour directional distribution of traffic, observed during evening peak hour i.e. 7:00pm to 8:00pm
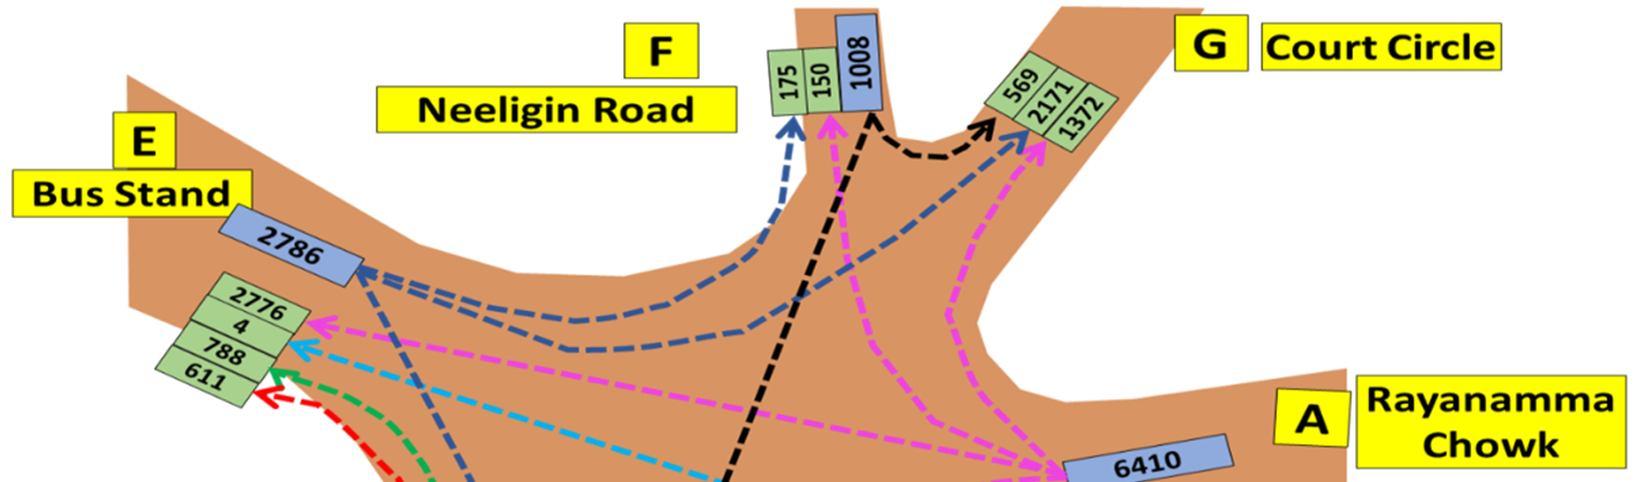
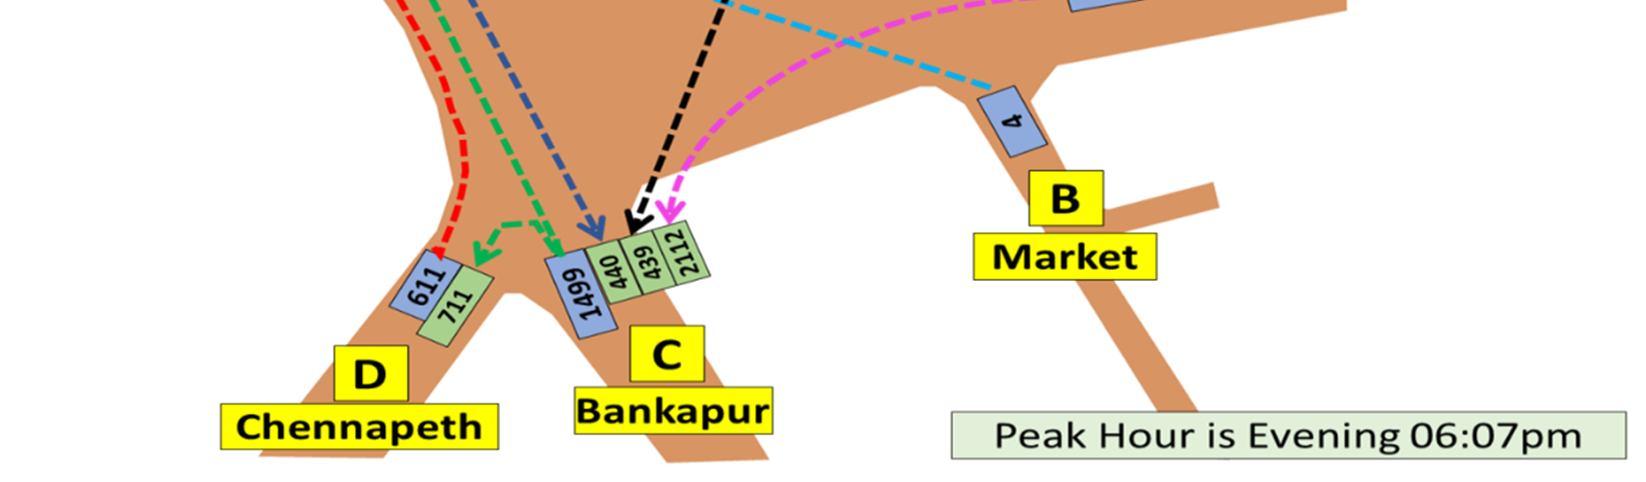
Major Directions at Rani Chennamma Circle can be noted as follows :
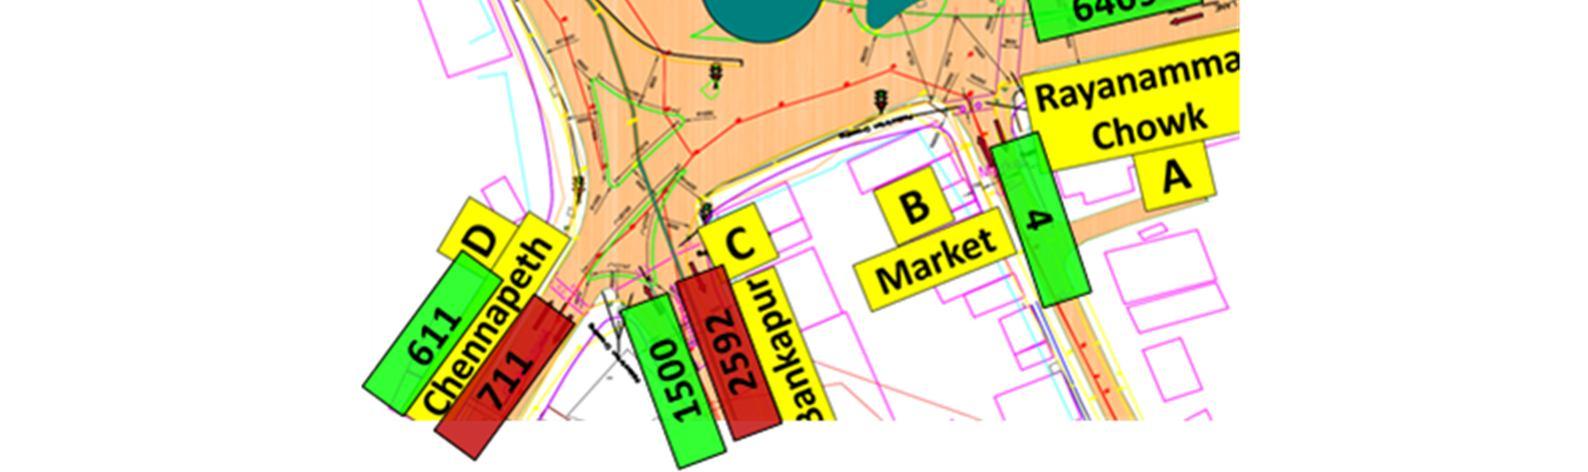
a) Rayanamma circle (Gadag) to Bus stand (Dharwad)
b) Bus stand (Gadag) to Court Circle (Vijapur)
c) Dharwad to Bankapur (Bangalore)
d) Dharwad to Court Circle (Vijapur)
e) Rayanamma circle (Gadag) to Bankapur (Bangalore)
f) Bankapur (Bangalore) to Dharwad
ISSN: 2321 9653; IC Value: 45.98; SJ Impact Factor: 7.538 Volume 10 Issue XI Nov 2022 Available at www.ijraset.com
Table 2 Total Day And Peak Hour Directional Traffic Data Rani Chennamma Circle
Sr.no. Direction 11.00 12.00 01.00 02.00 06:00 07:00 Total Day (PCU)
1 A to C 731 805 2112 15339 2 A to E 1944 2698 2776 34577 3 A to F 303 159 150 3223 4 A to G 1126 1250 1372 15253 5 B to E 117 60 4 484 6 C to D 304 691 711 6942 7 C to E 660 1128 788 12296 8 D to E 1135 1084 611 13065 9 E to C 670 441 440 8572 10 E to F 203 107 175 2144 11 E to G 2466 2287 2171 32945 12 F to C 349 397 439 5603 13 F to G 529 451 569 6031
The following legs (at grade) are currently operating as one way:
Neeligin Road (traffic coming towards Rani Chennamma Junction); Gadag Road (traffic travelling away from Rani Chennamma Junction); Vijapur Road (traffic travelling away from Rani Chennamma Junction).
The above numbers inform of the much needed requirement for grade separation considering that the peak hour volume from all legs at Rani Chennamma junction is 12,515 (i.e. above 10,000 PCU’s) and keeping in mind the development works proposed in the vicinity in the various government reports.
a) Mid Block Survey b) Gadag Road
ISSN: 2321 9653; IC Value: 45.98; SJ Impact Factor: 7.538 Volume 10 Issue XI Nov 2022 Available at www.ijraset.com
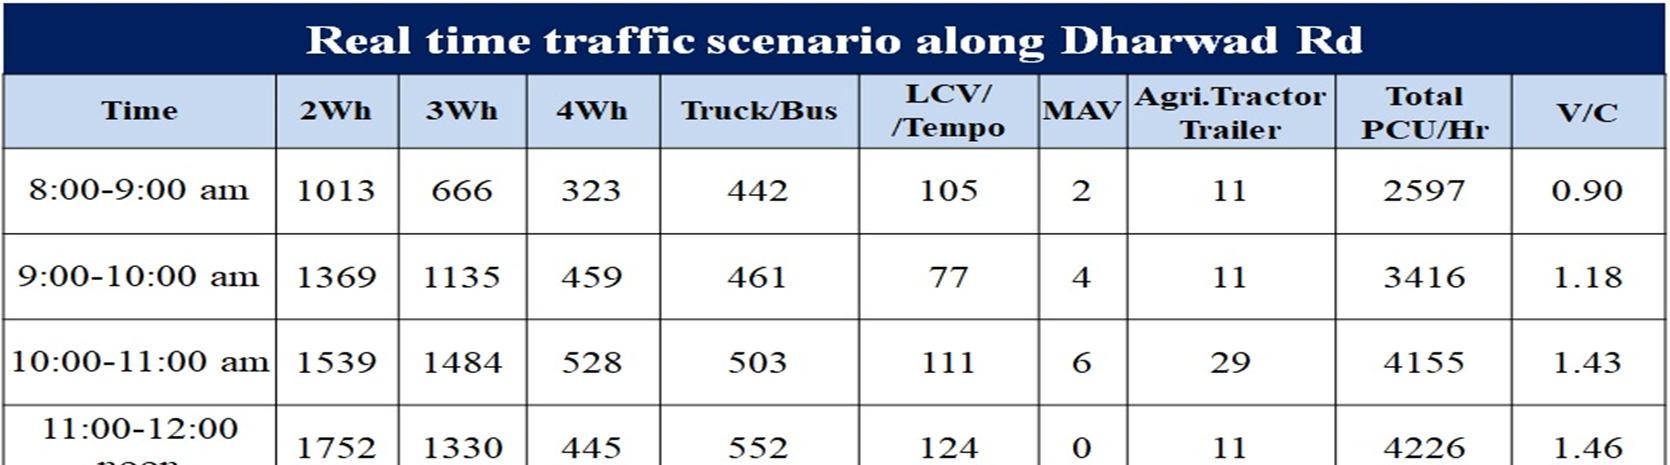
The traffic along the Gadag Road is noted to be very high as observed in the directional distribution of traffic at Rani Chennamma Circe. Road inventory and Mid block Survey is done along this road to analyse the condition of the road and traffic. The various points noted are summarized in the figures below:
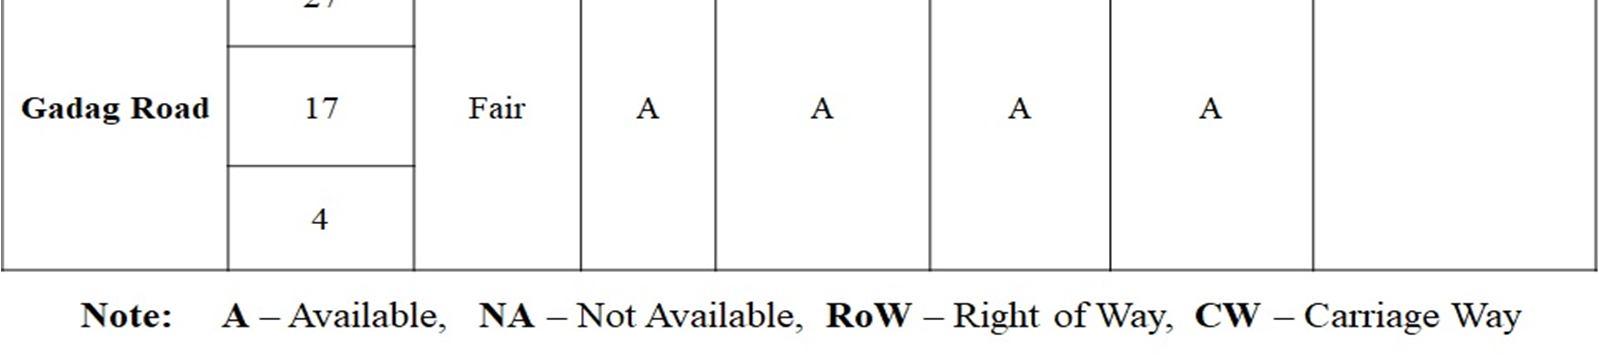
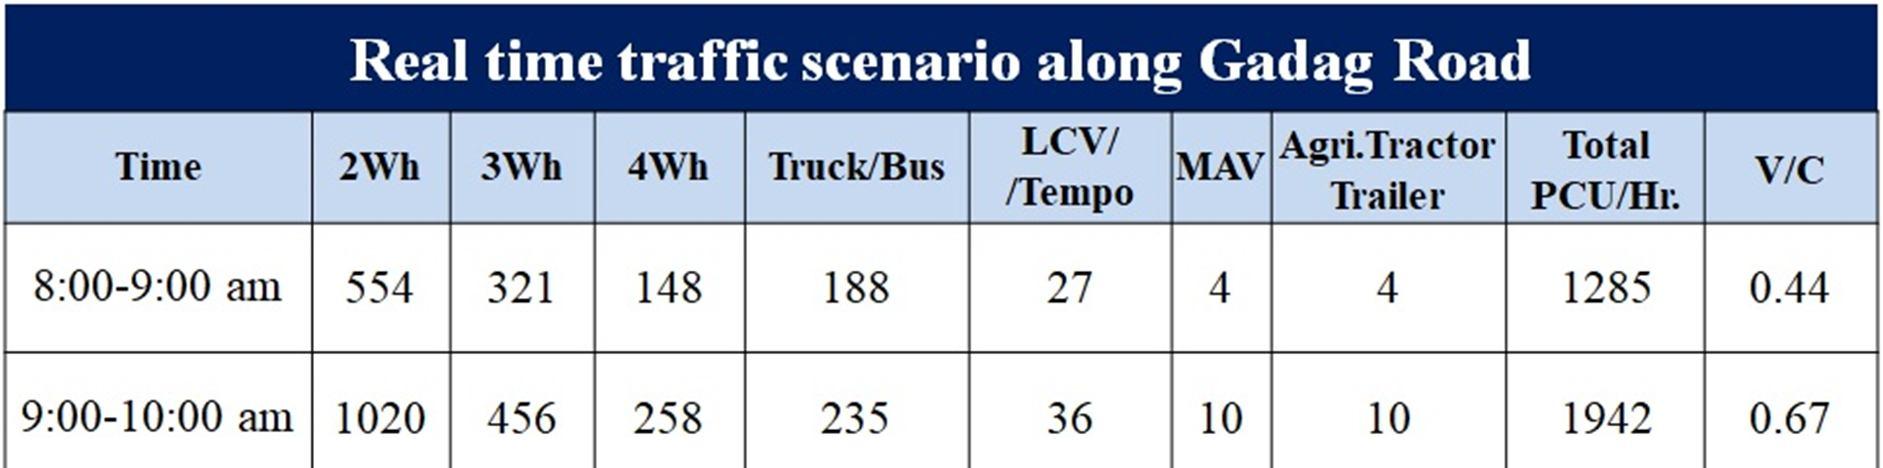
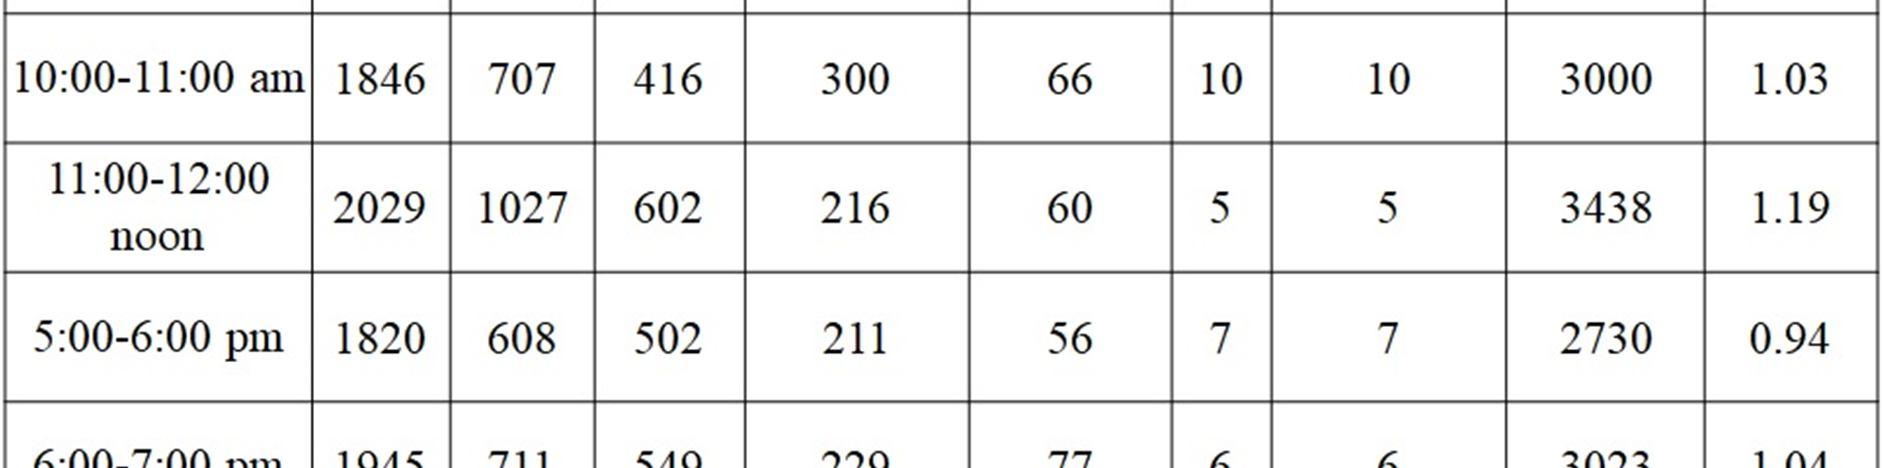
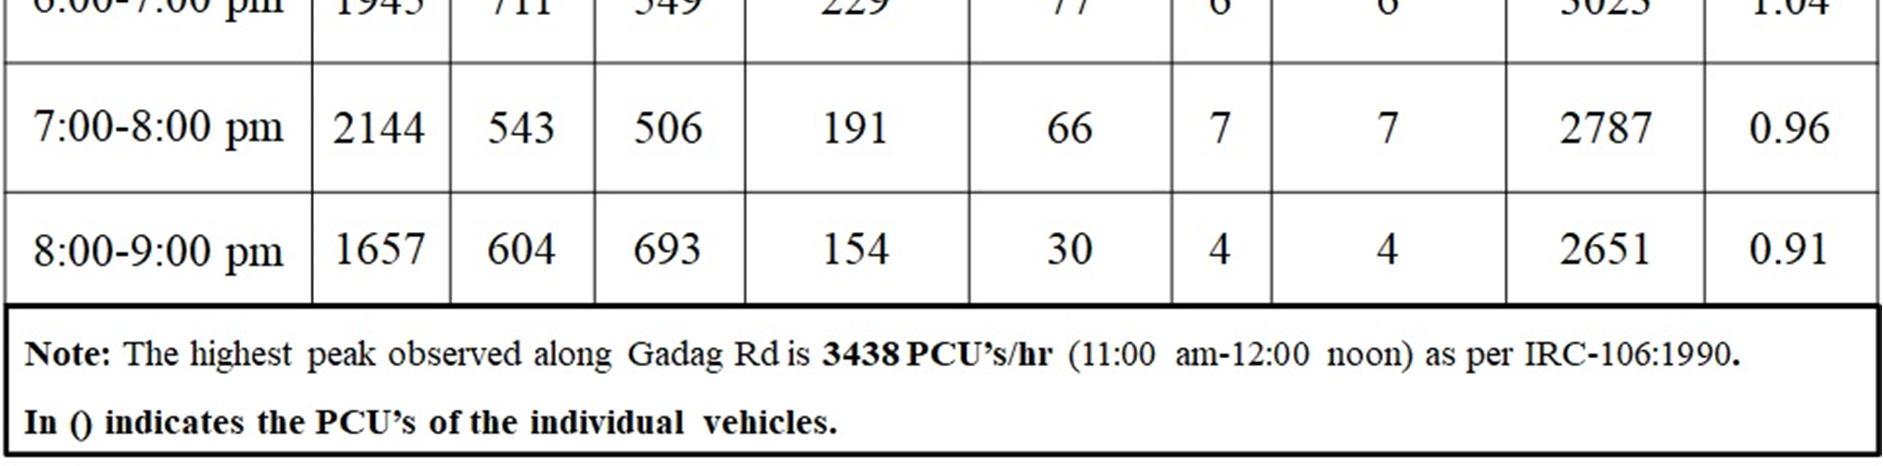
Table 3 Gadag Road Inventory Details

ISSN: 2321 9653; IC Value: 45.98; SJ Impact Factor: 7.538 Volume 10 Issue XI Nov 2022 Available at www.ijraset.com

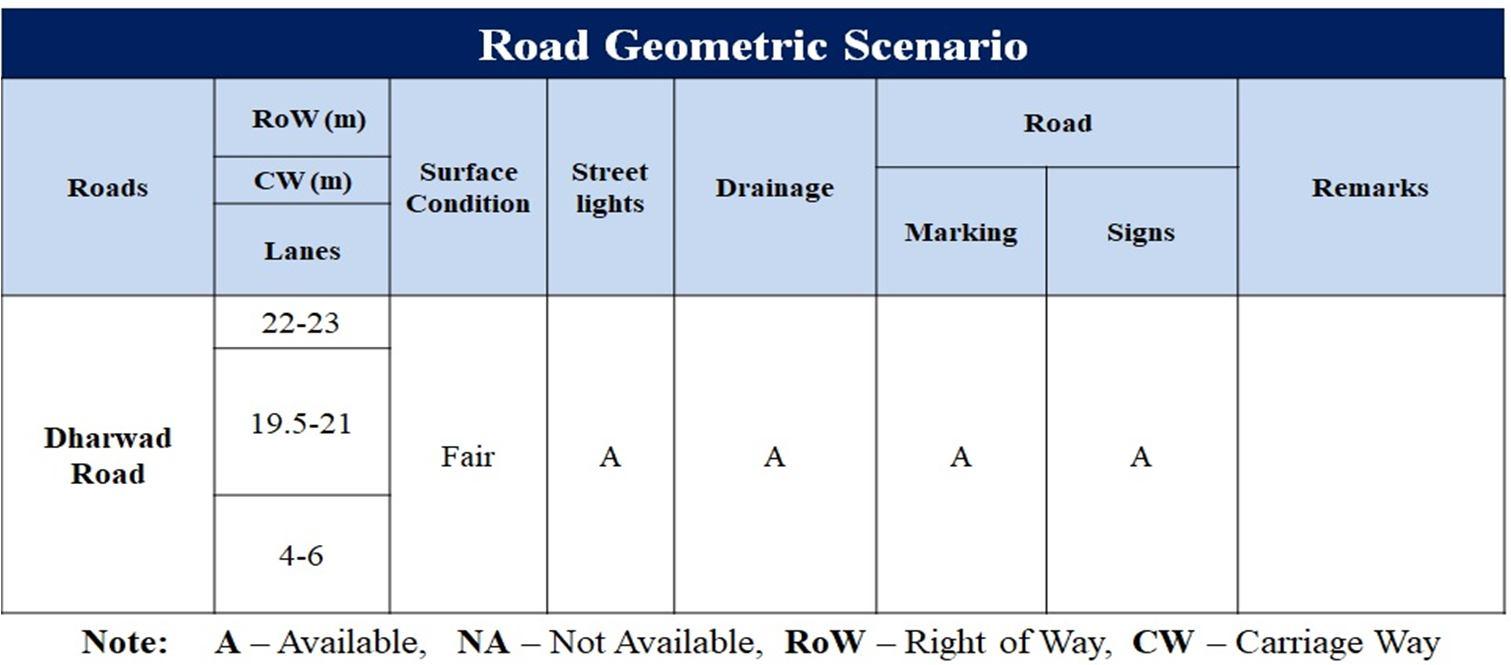
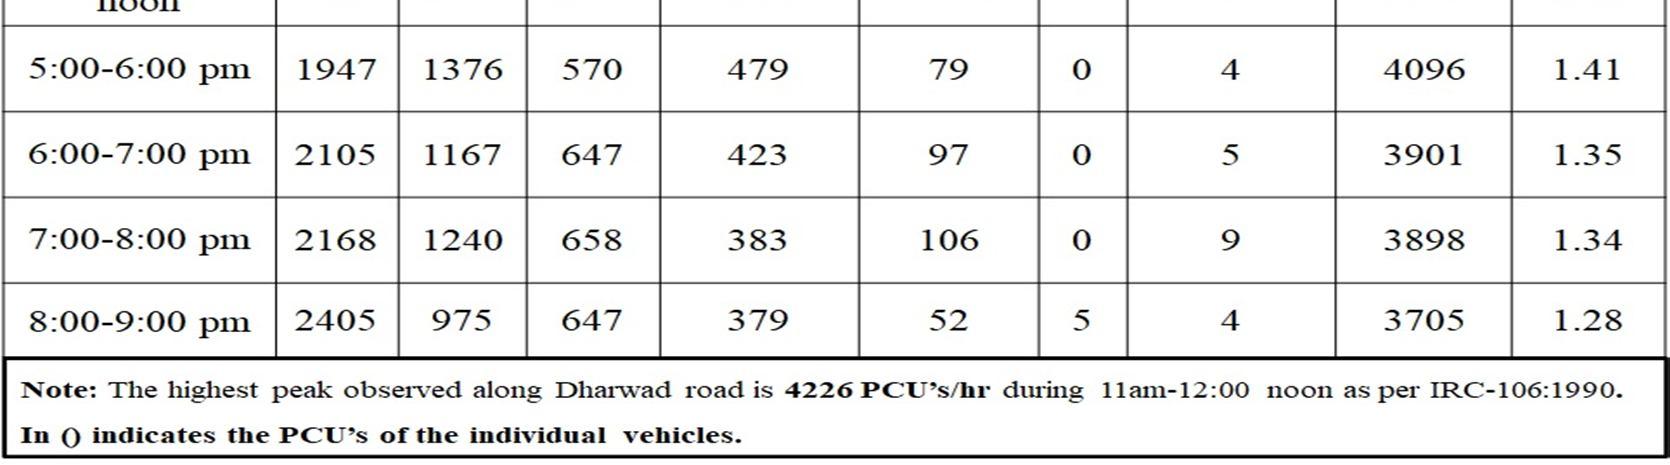
The traffic coming from Gadag Road is going mainly towards Dharwad. The traffic on this road is also noted to be very high as observed in the directional distribution of traffic at Rani Chennamma Circe. Road inventory and Mid block Survey is done along this road to analyse the condition of the road and traffic. The various points noted are summarized in the figures below.
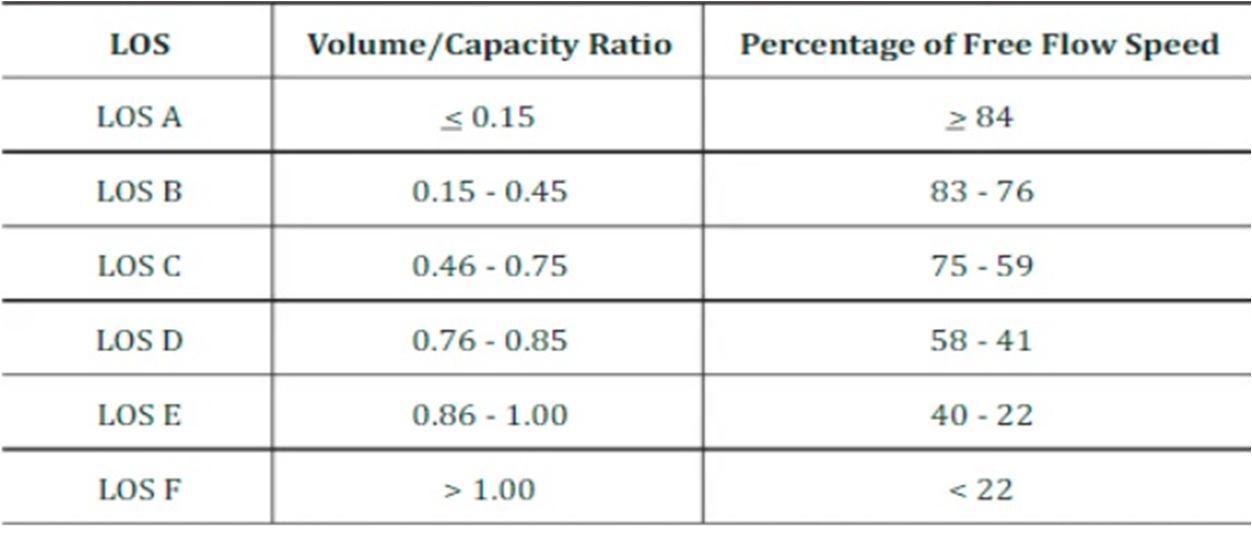
Based on the traffic numbers observed after the Turning Movement Survey and Mid Block Survey, it can be noted that the Volume/ capacity ratio of Gadag Road and Dharwad Road in existing traffic scenario is quite high in the range of 1.2 to 1.5 (Approx) (Table 7 & 8) Based on the current traffic scenario, Level of Service (LOS) of F is observed (Table 9) LOS of F is observed along both the roads connecting the Rani Chennamma Circle. V/C ratio of 1.4 to 1.8 is observed after three years based on current traffic growth projection. After three years, LOS of F is observed along both the roads connecting the Rani Chennamma Circle. As per IRC 106 1990, LOS F generally represents zone of forced or breakdown flow. This condition occurs when the amount of traffic approaching a point exceeds the amount which can pass it. Queues form behind such locations. Operations within the queue are characterised by stop and go waves, which are extremely unstable. Vehicles may progress at a reasonable speed for several hundred metres and may then be required to stop in a cyclic fashion. Due to high volumes, break down occurs, and long queues and delays result. The average travel speeds are between 25 per cent and 33 per cent of free flow speed.
ISSN: 2321 9653; IC Value: 45.98; SJ Impact Factor: 7.538 Volume 10 Issue XI Nov 2022 Available at www.ijraset.com
Table 7 Observed V/C & LOS at Gadag Road
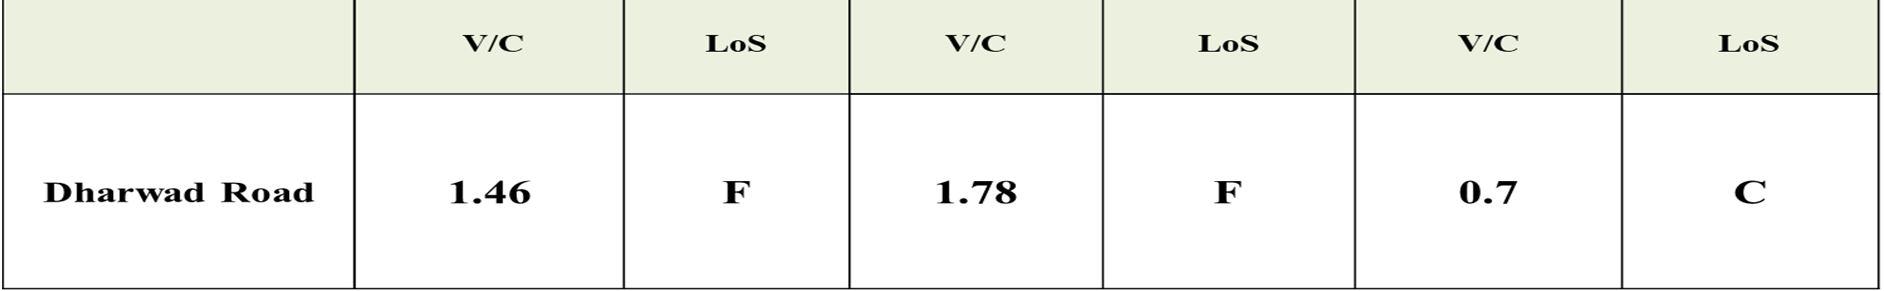
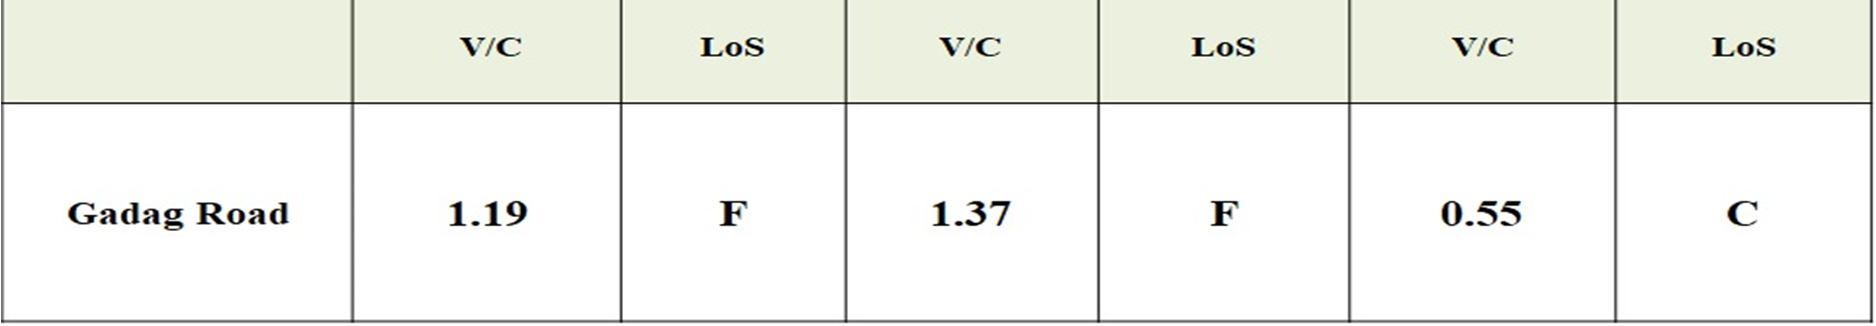
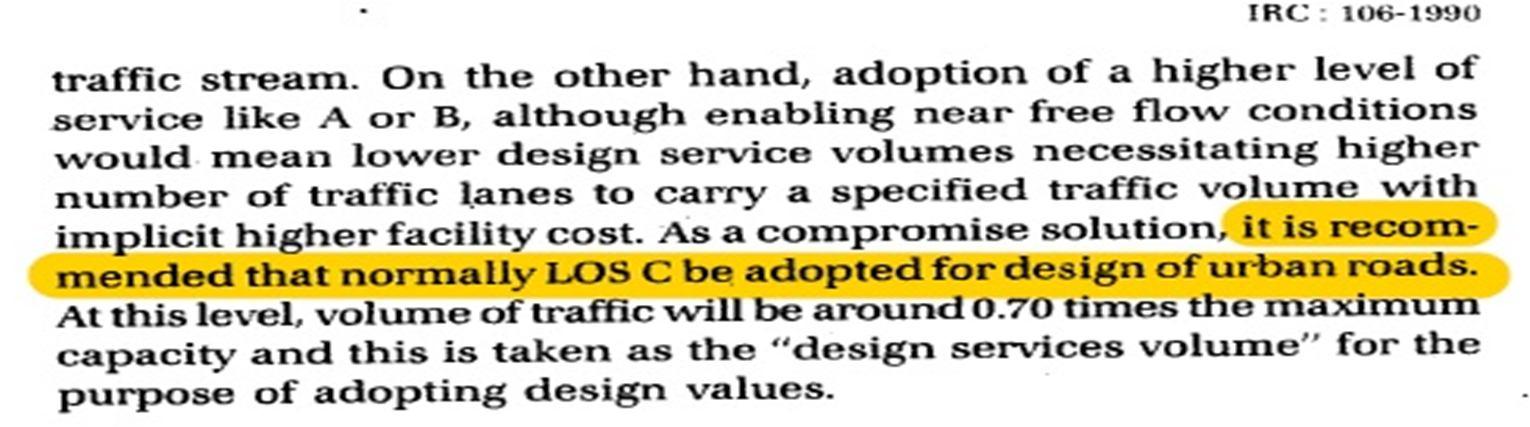
As part of providing a solution to the existing traffic scenario, proposal of four lane elevated flyover is hence forwarded. The additional 4 lanes along Gadag and Dharwad Road will take half of the traffic plying on these roads at flyover level and this will in turn reduce the traffic congestion at the at grade roads. The purpose of proposing a flyover is to segregate the local traffic from the traffic which want to bypass the existing Rani Chennamma Circle. The through traffic includes vehicles which will travel between Hubli Railway station and Hubli Airport and also between Hubli Railway station and Dharwad city. The proposal of the elevated flyover brings down the V/C by almost half its value. V/C ratios observed after the implementation of four lane flyover along Gadag road and Dharwad road is 0.55 to 0.7, these V/C ratios falls under LOS of C (Table 9). As per IRC 106 1990 [3], Clause 8.1 states that “it is recommended that normally LOS C shall be adopted for design of urban road”. Hence, proposal of flyover along Gadag Road and Dharwad road surpassing the congested Rani Chennamma circle is proposed to provide a through road for vehicles wanting to avoid the Rani Chennamma circle and also reduce the at grade traffic congestion levels.
Table 9 LOS of Multilane Divided Urban Roads based on Stream Speed, V/C Ratio
ISSN: 2321 9653; IC Value: 45.98; SJ Impact Factor: 7.538
Volume 10 Issue XI Nov 2022 Available at www.ijraset.com
[1] Comprehensive Traffic & Transportation Plan (CTTP) report OF Hubli Dharwad.
[2] https://government.economictimes.indiatimes.com/news/governance/karnataka initiates development of dharwad industrial area under bengaluru mumbai industrial corridor project/87946974
[3] IRC 106 1990: Guidelines for capacity of Urban Roads in Plain areas.
[4] IRC: 086 “Geometric Design Standards for Urban Roads in Plains”
[5] IRC: SP: 90 2010 “Guidelines for design of Grade Separators and Elevated Structures”
[6] IRC: 93 1985 “Guidelines for design of Signalized Road Intersections”
[7] IRC: 35 2015 (First Revision) “Code of Practice for Road Markings”
[8] IRC: 21 2000 “Standard specification and codes for roads and bridges”
[9] IRC SP 041 1994 “Guidelines for the Design of At Grade Intersections in Rural and Urban Areas”
[10] Evaluation of Traffic Impact on Road Network due to New Commercial Development (Omkar Sharad Khade PG Student, Dr. B. V. Khode, Professor Department of Civil Engineering G. H. Raisoni College of Engineering, Nagpur, India)
[11] TRAFFIC ANALYSIS AND DESIGN OF FLYOVER by Rose Mary Xavier, Evelyn Antony, Jubin Mathew, Paul P Shibu, Safna K Muhammed.
[12] Traffic Flow Analysis & efficiency Of Geometric Design of a T Intersection, A Case Study by Ubaid Illahi, Burhan ul Wafa, Danish Zaffar Wani, Raqeeb Nabi Khan.
[13] Analysis of Traffic Volume and Fly over Construction for Traffic Problems in Kompally Junction, Hyderabad, GHMC (P. Guruswamy Goud, S.Priyanka, V. Hemasekhar Reddy, V.Keerthi)