10 XI November 2022 https://doi.org/10.22214/ijraset.2022.47766
ISSN: 2321 9653; IC Value: 45.98; SJ Impact Factor: 7.538


Volume 10 Issue XI Nov 2022 Available at www.ijraset.com

ISSN: 2321 9653; IC Value: 45.98; SJ Impact Factor: 7.538
Volume 10 Issue XI Nov 2022 Available at www.ijraset.com
S. N. Shashank1 , M. K. Mahesh Kumar2, S. Shwetha3, Dr. M. K. Mahesh4
1M.Sc. Student, 2Lecturer, 3PhD Scholar, 4Professor, Department of Botany, Yuvaraja’s College, University of Mysore, Mysuru, Karnataka
Abstract: Phytoplanktons which are present in a variety of aquatic habitats were studied with respect to their species diversity and distribution, studies on phytoplankton and water quality of Hadinaru lake , Nanjanagudu, Mysore, Karnataka were undertaken for 5 months of 2022 (April 2022 to August 2022). . The water samples were analyzed to physical and chemical parameters by following the standard methods of APHA (2005) and Trivedi and Goel (1984). The quantitative analysis of phytoplankton was done by Lackey’s drop method modified by saxena (1987). Diversity indices have been discussed by using PASTA Software Program. Among the total 52 species recorded during the study, 25 were from Bacillariophyceae, 8 from Chlorophyceae, 8 from Cyanophyceae. 4 from Desmidiaceae 3 from Euglenophyceae and 2 from Charophyta. Bacillariophyceae was the most dominant group followed by Chlorophyceae, Cyanophyceae, Desmidiaceae. Euglenophyceae and Charophyta. The result of physico chemical and biological parameters along with statistical method and biodiversity indices indicated that the Hadinaru lake is threatened ecologically due to various anthropogenic activities which lead organic pollution and eutrophication status of the lake. Statistical program Bray Curtis similarity index explained, the cluster of EC, Total hardness and Total alkalinity is highly correlated with the clusters of phytoplanktons. Shannon and Weiner index showed that the lake was heavily polluted in the month of April due to increased temperature.
Keywords: Phytoplankton, Physico chemical parameters, Bray Curtis Similarity Index, Principal component analysis.
Water is the prime source for all the life forms on the earth. Although earth is covered by more than 75% of water, only 3% of water on earth is fresh water and only 0.3% is surface water 1. Life on earth depends on fresh water. Fresh water is an important resource, necessary for the survival of most terrestrial organisms & is required by humans for drinking, agriculture and many other purposes. Fresh waters refers to bodies of water such as ponds, lakes, rivers and streams containing low concentration of dissolved salts and other total dissolved salts. Fresh waters are perhaps the most vulnerable habitats and are most likely to be changed by the activities of man. Fresh water, an essential resource is becoming increasingly scarce in many parts of the world due to severe impairment of water quality. Limnology is the branch of science which deals with biological productivity of inland waters and with all the causal influences which determine it. Under the term inland waters are included all kinds or types of water running or standing: fresh, Marine, or other physico chemical composition, which are wholly or almost completely included within the land masses. Causal influences involves those various factors physical, chemical, biological, meteorological, etc. which determine the character and quantity of biological production 2. The phytoplankton community is mainly represented by algal representatives including both prokaryotes and eukaryotic genera. Plankton populations are mostly represented by members of Cyanobacteria, Chlorophyta, Dinophyta, Euglenophyta, Haptophyta, Chrysophyta, Cryptophyta and Bacillariophyta. The physico chemical characteristics of water plays an important role in algal biodiversity and population dynamics of planktons 3. The phytoplankton have been an interesting group for investigation because of their very primitive nature and a worldwide distribution, which is due to their capability to exist under most varied environmental conditions 4 Present study refers to the study of water quality of Hadinaru lake of Mysore which was assessed using both phytoplanktons and physico chemical parameters from April 2022 to August 2022.
Objectives: Investigations are undertaken in the selected Hadinaru lake of Mysore district with the following objectives. 1) To study the relationship between physico chemical parameters with phytoplankton population. 2) Evaluation of phytoplankton diversity of Hadinaru lake.
ISSN: 2321 9653; IC Value: 45.98; SJ Impact Factor: 7.538 Volume 10 Issue XI Nov 2022 Available at www.ijraset.com
Hadinaru lake is also called as Doddalake. It is located at 12° 02' 02" North longitudes 76° 41'38* East latitude at an altitude of 653.35 meters HMSL. It is situated 33 kms away from Mysore city. Lake is located in Nanjangudu taluk, which is 11 kms away from Nanjangudu town. It has an independent catchment area of 8.57 sq.km, with water spread area of 10.10 hectares having a live capacity of 54.43 MCFT
Surface water samples were collected every month in different spots of a lake for a period of five months from Hadinaru lake in Mysore district and 14 physico chemical parameters have been analyzed by standard methods given in APHA (2005) and Trivedy and and Goel (1997) 5 , 6
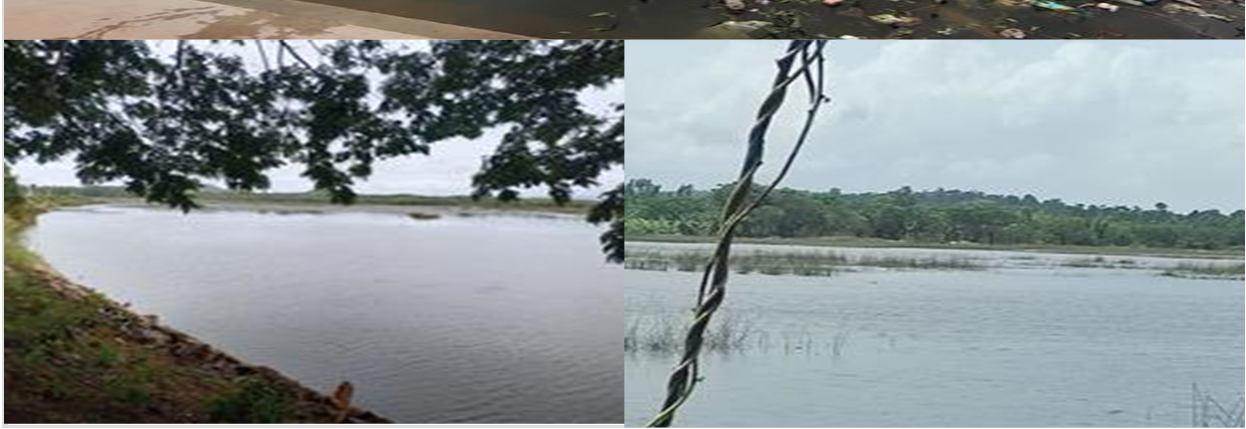
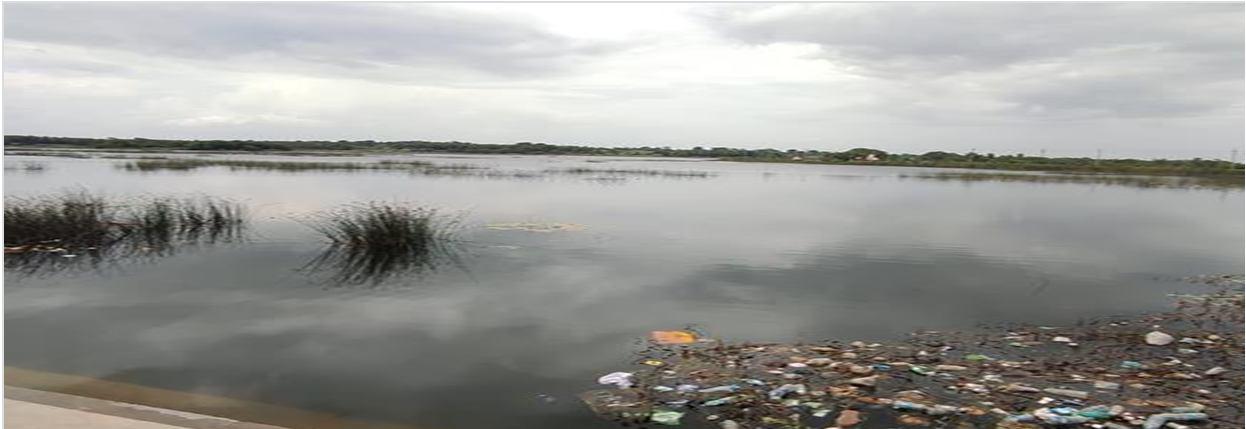
Table 1: Physical water quality parameters along with methods and units
Parameter Method Units pH pH digital meter Water temperature Digital thermometer C Electric conductivity Conductivity meter µS
Table 2: Chemical water quality parameters along with methods and units
Carbon di oxide (mg/L)
Titrimetric method (APHA, 2005)
Dissolved oxygen (mg/L) Winkler’s iodiometric method
Total hardness (mg/L) EDTA titrimetric method (APHA, 2005)
Calcium (mg/L) EDTA titrimetric method (APHA, 2005)
Magnesium (mg/L)
Chloride (mg/L)
Calculation method (APHA, 2005)
Argentometric method (APHA, 2005)
Total alkalinity (mg/L) Titration method (APHA, 2005)
Bio chemical oxygen demand (mg/L) 5 day BOD test (Trivedy and Goel, 1997)
Chemical oxygen demand (mg/L) Potassium dichromate reflux method(APHA, 2005)
Total dissolved solids (mg/L) Evaporation method (Trivedy and Goel, 1997)
Salinity (mg/L) Titrimetric method (Trivedy and Goel, 1997)
ISSN: 2321 9653; IC Value: 45.98; SJ Impact Factor: 7.538 Volume 10 Issue XI Nov 2022 Available at www.ijraset.com
To get a precise explanation on physico chemical parameters and phytoplankton population various statistical analysis was performed. All data obtained were subjected to multivariate analysis. The statistical analysis was carried out by using following methods 8.
1) PCA by PASTA Software
2) Bray Curtis Similarity index by PASTA Software 3) Biodiversity indices by PASTA Software
Phytoplankton was collected by filtering 5 liters of water sample with the help of plankton net of mesh size 63 µm and 30cm diameter. The final volume of filtered sample was 25ml. The sample was transferred to 50ml sterile plastic bottle and labelled mentioning the time, date and place of sampling. The collected sample was preserved by using 2ml of 2 4% formaldehyde and 2 drops of Lugol’s iodine solution. The preserved samples were taken to the laboratory for further assessment. Phytoplankton count was done by Lackey’s Drop Method (1939) as mentioned in APHA (1985) which was modified by Saxena (1987). In Lackey’s drop method, the coverslip was placed over one drop of water sample in the slide, permanent slide is done by using DPX and whole coverslip were examined under Labomed trinocular microscope (LX400) with image transferor (DCM 35 USB 2.0) and photographs was captured by the software minisee and species identification was done by using standard monographs like Sudipta Kumar Das and Siba Prasad Adhikary 7, research articles and research personnel. After that organisms were counted in each drop 8. This procedure was repeated three times for each samples and number of organism was measured as organism per liter. Formula used for the calculation of plankton as Org/L is Formula used for the calculation of phytoplankton as units/L is Phytoplankton Unit/L = N C 1000
N = No. of phytoplankton counted in 0.1ml concentrate. C = total volume of concentrate in ml.
V = total volume of water filtered through net
The water was analysed for its physical and chemical properties and the results have been discussed in the following sections 5 , 6 and presented in Table 3 which shows the values obtained in all samples collected from April 2022 to August 2022.
1) Temperature: It is one of the critical physical parameter which controls most the biological activities in the aquatic environment. The water temperature of lake during study period ranges from 25°C to 28°C.
2) Electrical conductivity: Electric conductivity is a parameter used to as certain the purity of water and is the measure of capability of water to transmit electric current. The Electric conductance ranges from 721µS to 928µS. A minimum value of 721µS was recorded in May and maximum of 928µS in August. It has been mentioned that increase in EC is due to dissolved salts content.
3) pH: pH is a term used universally to express the intensity of the acid or alkaline condition of a solution. The pH value ranges from 7.59 to 8.62. The minimum value of 7.4 was recorded in July and maximum of 8.62 in June. It has been mentioned that the increase in pH value appears to be associated with increased use of alkaline detergents in residential areas & alkaline material from wastewater is from agricultural areas.
4) Total dissolved solids: Total dissolved solids represent the amount of soluble inorganic substance in water. Total dissolved solids observed in the lake ranges from 6 mg/L to 19 mg/L. Minimum value of 6 mg/L was recorded in April and maximum of 19 mg/L in July. The entry of sewage, urban runoff, industrial wastewater influence the increase in the concentration of Total dissolved solids.
5) Total Alkalinity: Total alkalinity is the measure of capacity of water to neutralize a strong acid. The minimum value 387 mg/L was recorded in May and maximum value of 505 mg/L in July. The alkalinity in the waters is generally imparted by the salts of carbonates and bicarbonates, phosphates, nitrates, borates, silicates, etc, together with the hydroxyl ions in free state. The high value of total alkalinity in the lake may be due to cattle bathing and laundering of clothes.
6) Salinity: Salinity of the water is its capacity to neutralize a strong base to a fixed pH. It is caused by the presence of strong mineral acids, weak acids and hydrolysing salts of strong acids. Salinity low which ranges from 0 mg/L to 10mg/L.
ISSN: 2321 9653; IC Value: 45.98; SJ Impact Factor: 7.538 Volume 10 Issue XI Nov 2022 Available at www.ijraset.com
7) Free CO2: Free Carbon di oxide (CO2) recorded in Hadinaru lake ranges from 0 mg/L to 13.2 mg/L and it is found tobe maximum in the month of July.
8) Dissolved oxygen: Dissolved oxygen values ranges from 4 mg/L to 12.56 mg/L. The minimum value of 4 mg/L was recorded in August and maximum value 12.56 mg/L in July. The increase in DO is influenced by the moderate temperature. Lower DO indicates the pollution of the lake by algae are unwanted things in lake.
9) Biochemical oxygen demand (BOD): Biochemical oxygen demand (BOD) refers to the oxygen used by the micro organisms in aerobic oxidation of organic matter, therefore with the increase in the amount of organic matter in the water BOD increases. BOD values ranges from 0 mg/L to 5.67 mg/L. A minimum value of 0 mg/L was observed in August and maximum of 5.67 mg/L in July. Higher contents of organic load as well as high proliferation of microorganism are the causative factors for maximum BOD levels.
10) Chemical Oxygen Demand (COD): Chemical oxygen demand (COD) is commonly used to indirectly measure the amount of organic compounds in water. This makes COD as a useful indicator of organic pollution in surface water. COD values ranges from 72 mg/L to 98 mg/L. A minimum of 72 mg/L was observed in June and maximum of 98 mg/L in July. Higher value of COD pointing to deterioration of water quality was likely caused by the discharge of municipal waste water.
11) Total Hardness: The regular addition of large quantities of sewage and detergent into the lake from nearby residential localities is responsible for higher level of hardness. Hardness ranges from 161.5 mg/L as CaCO3 to 290 mg/l as CaCO3.The minimum of 161.5 mg/L as CaCO3 was recorded in April and maximum of 290 mg/l as CaCO3 in July. The hardness will be more where the concentration of calcium and magnesium is more.
12) Calcium: Hardness is caused by compounds of calcium and magnesium, and by a variety of other metals. Calcium ranges from 11.02 mg/L to 39.75 mg/L. The minimum of 11.02 mg/L was recorded in April and maximum of 39.75mg/L in July.
13) Magnesium: Hardness is caused by compounds of calcium and magnesium, and by a variety of other metals. Magnesium ranges from 36.6 mg/L to 62.35 mg/L. The minimum of magnesium 36.6 mg/L was recorded in April and maximum of 62.35 mg/L in August.
14) Chloride: Chloride is not utilized directly or indirectly for aquatic plant growth and hence its existence in the aquatic system is regarded as pollution. Chloride ranges from 34.80 mg/L to 50.41 mg/L in the lake. A Minimum of 34.80 mg/L was observed in July and maximum value of 50.41 mg/L in August. High chloride concentration in the lake water may be due to high rate of evaporation or due to organic waste of animal origin.
Table 3: Monthly variation in the Physico chemical parameters from April 2022 to August 2022
ISSN: 2321 9653; IC Value: 45.98; SJ Impact Factor: 7.538 Volume 10 Issue XI Nov 2022 Available at www.ijraset.com
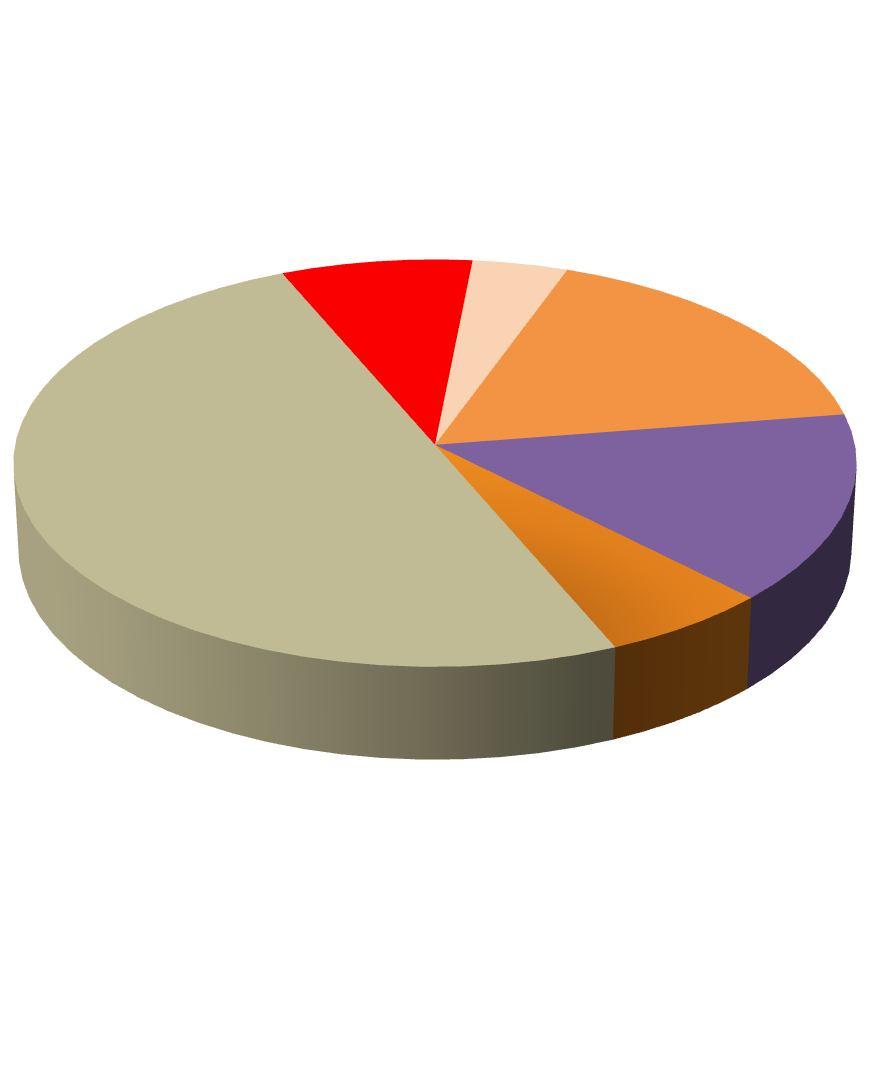
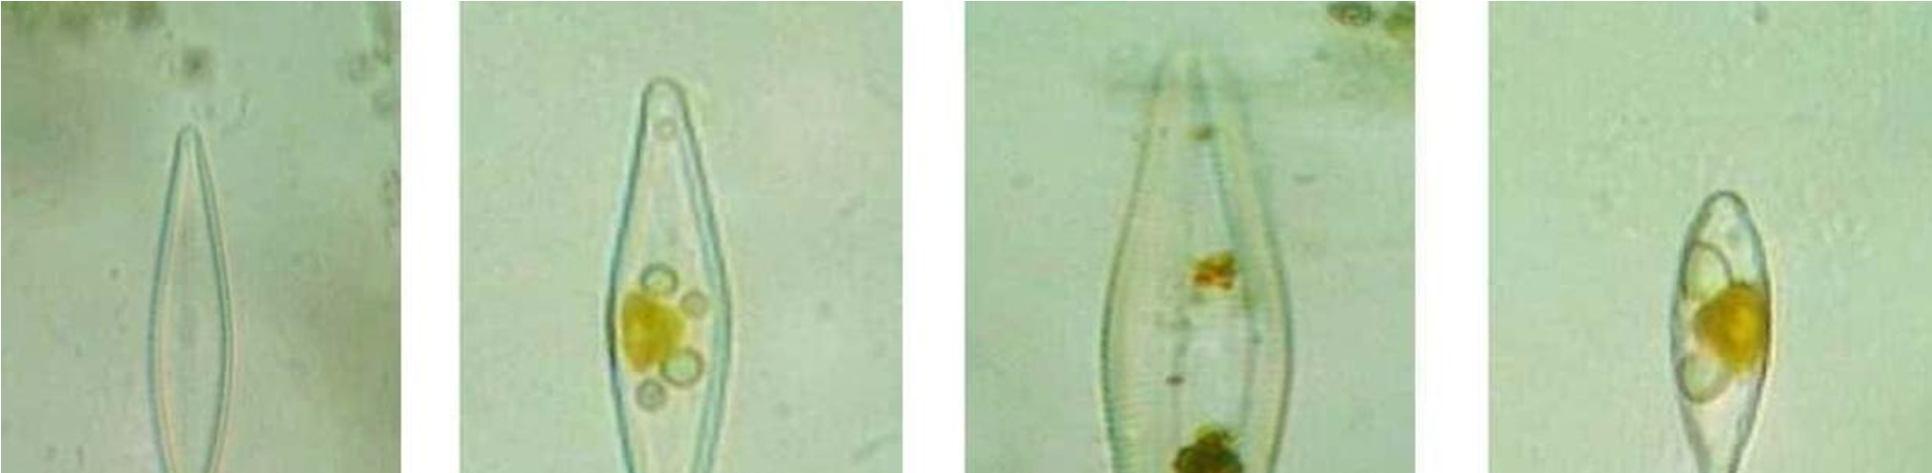
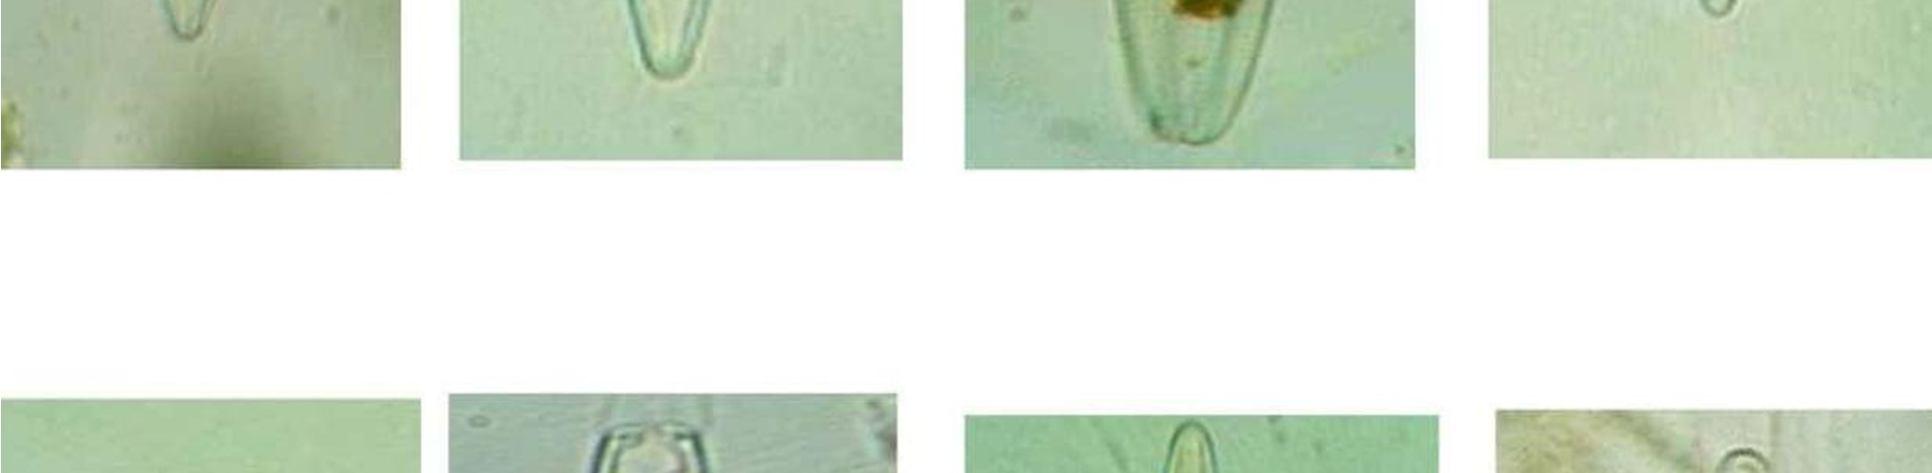
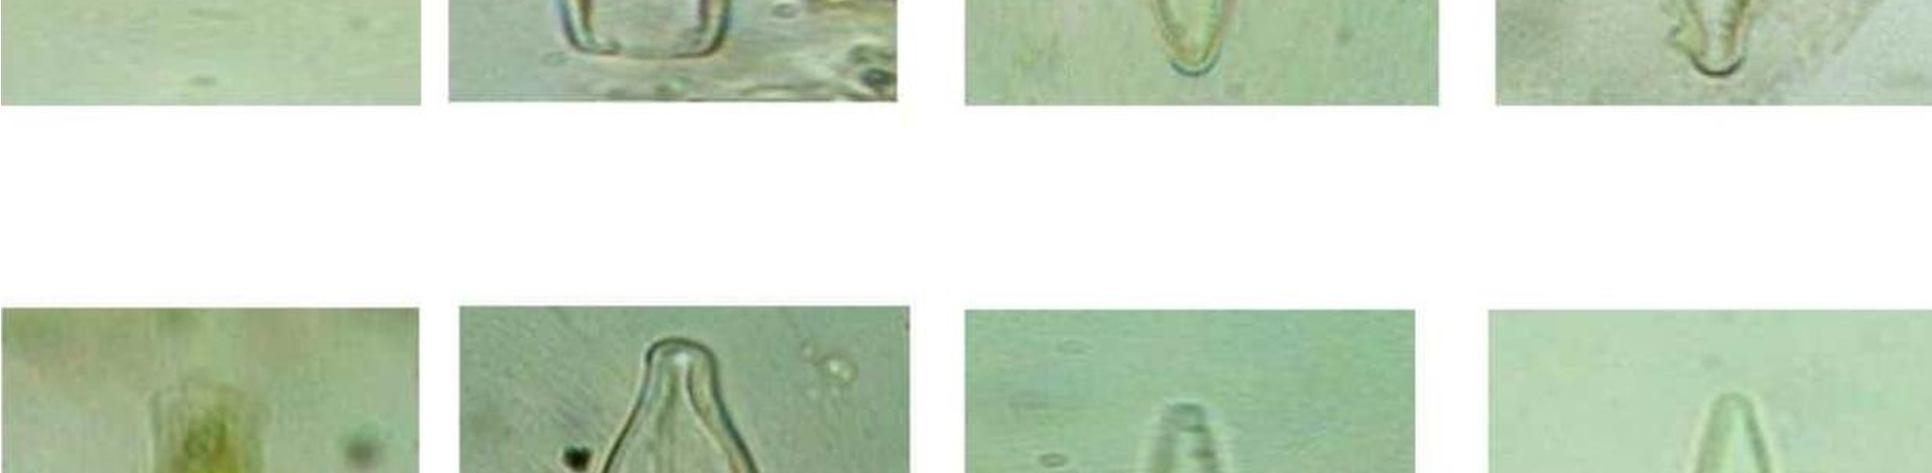
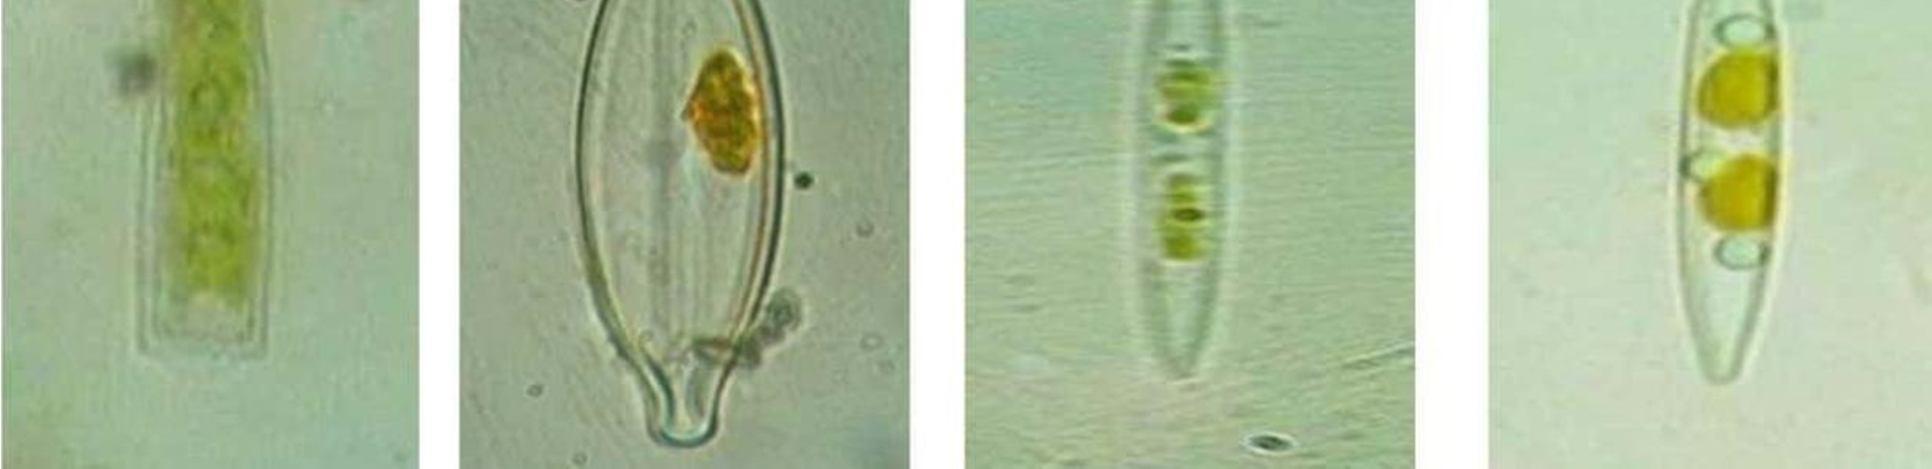
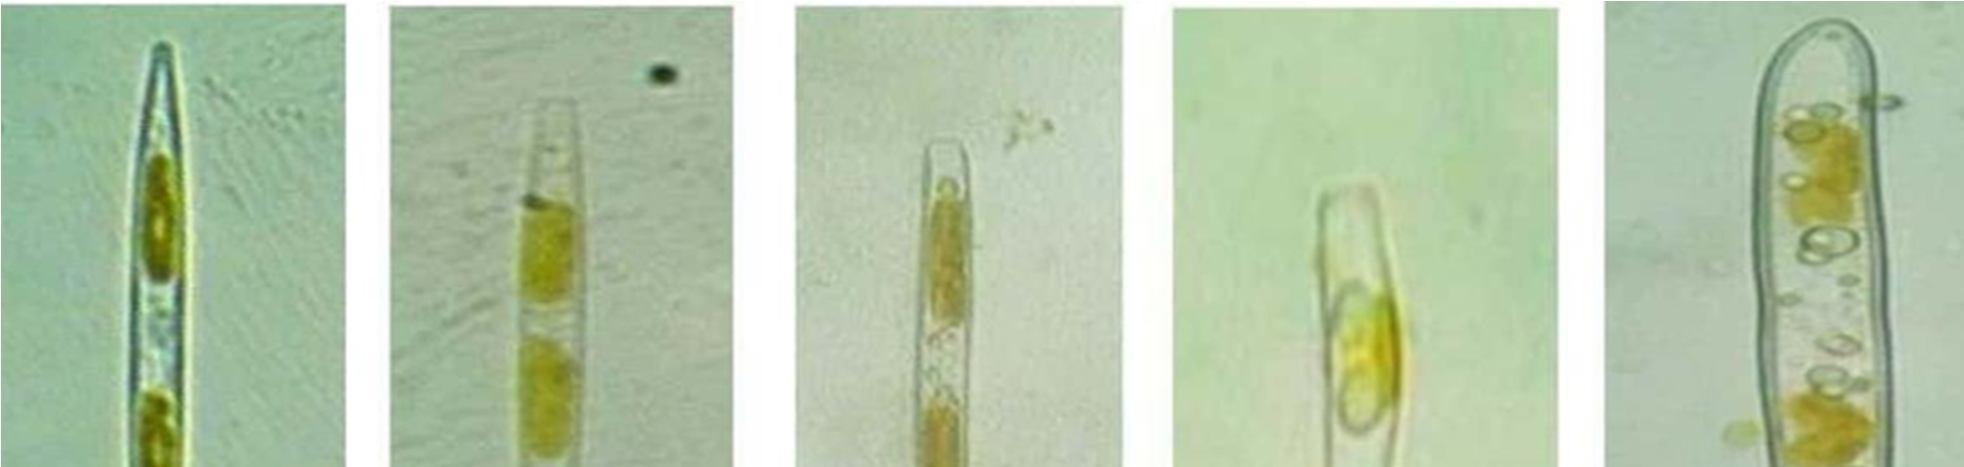
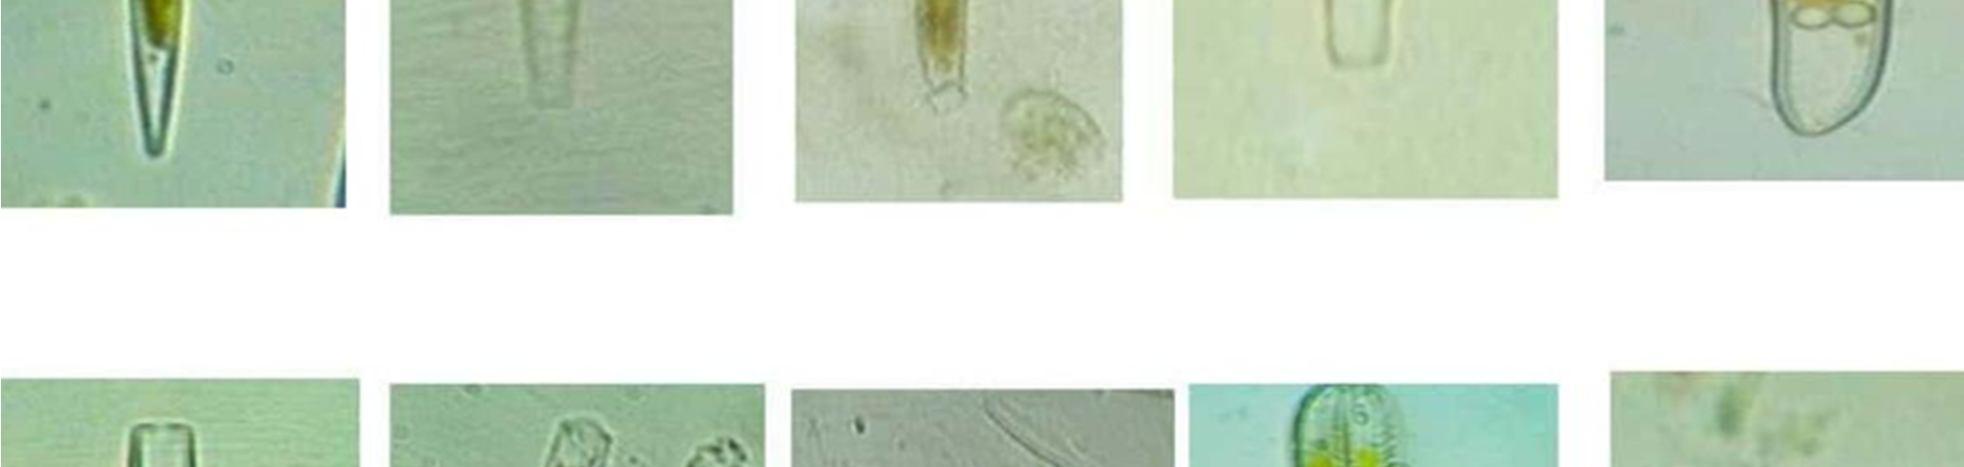
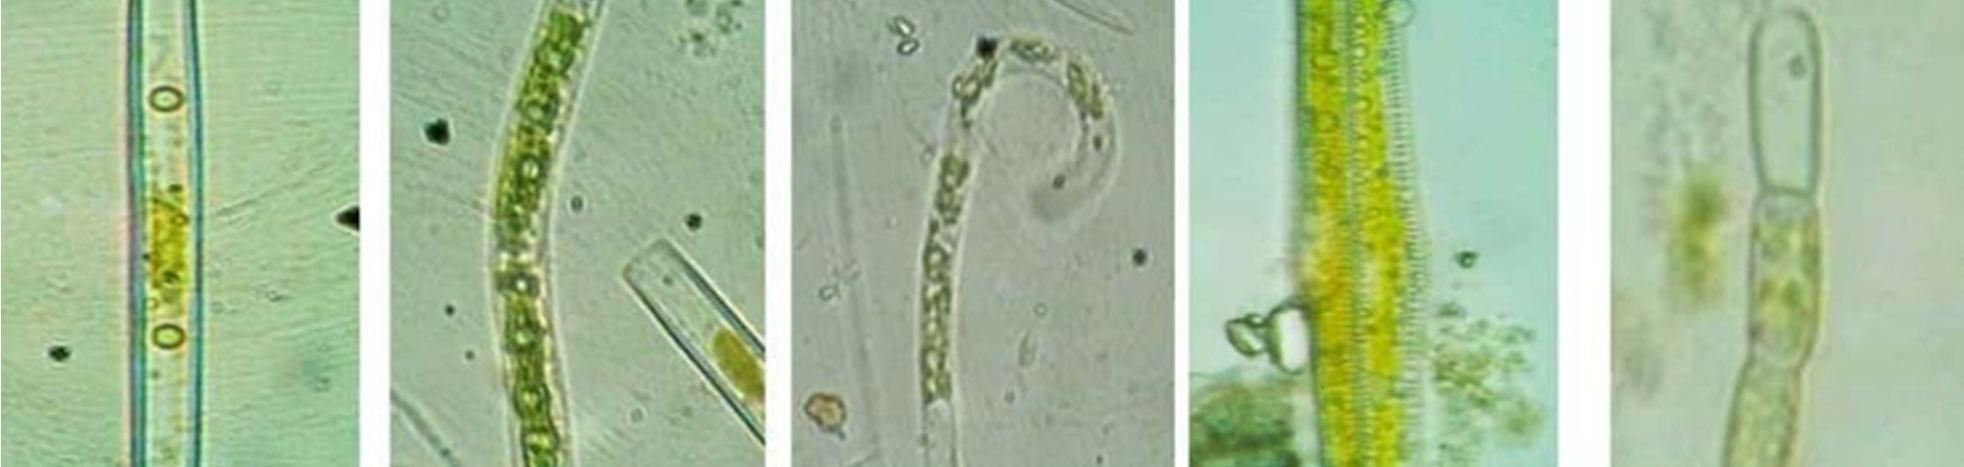
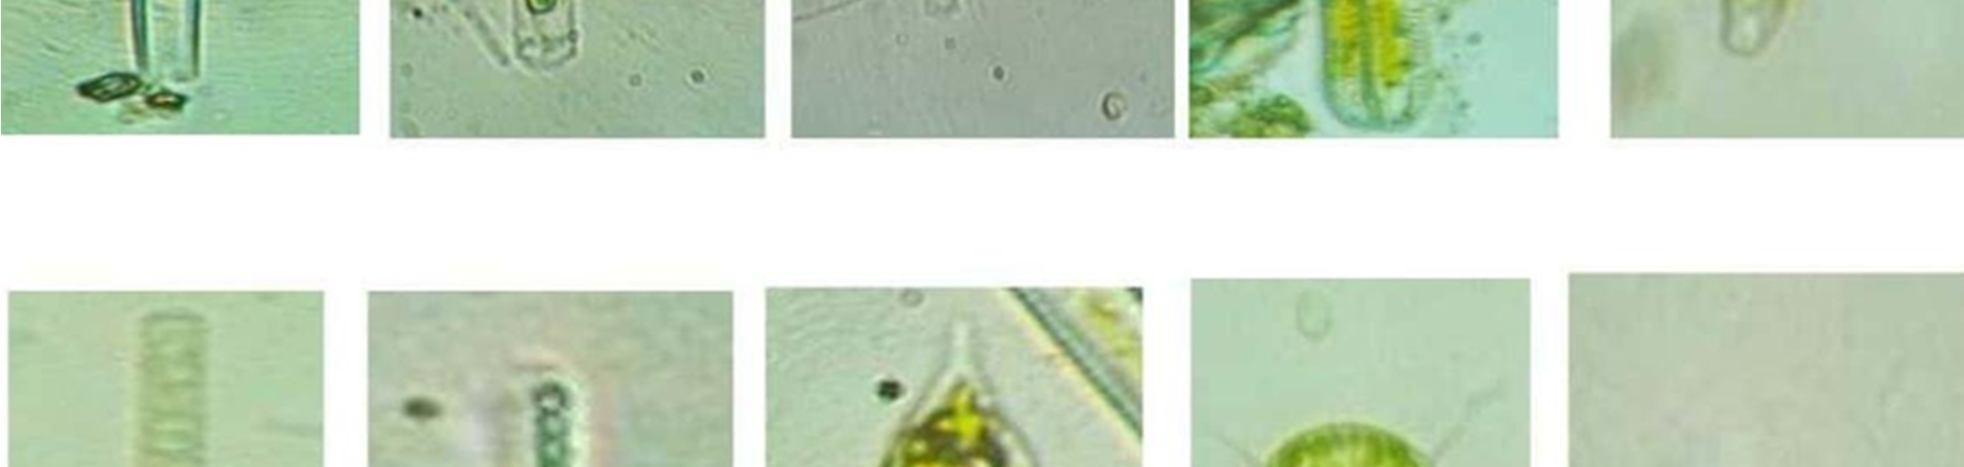
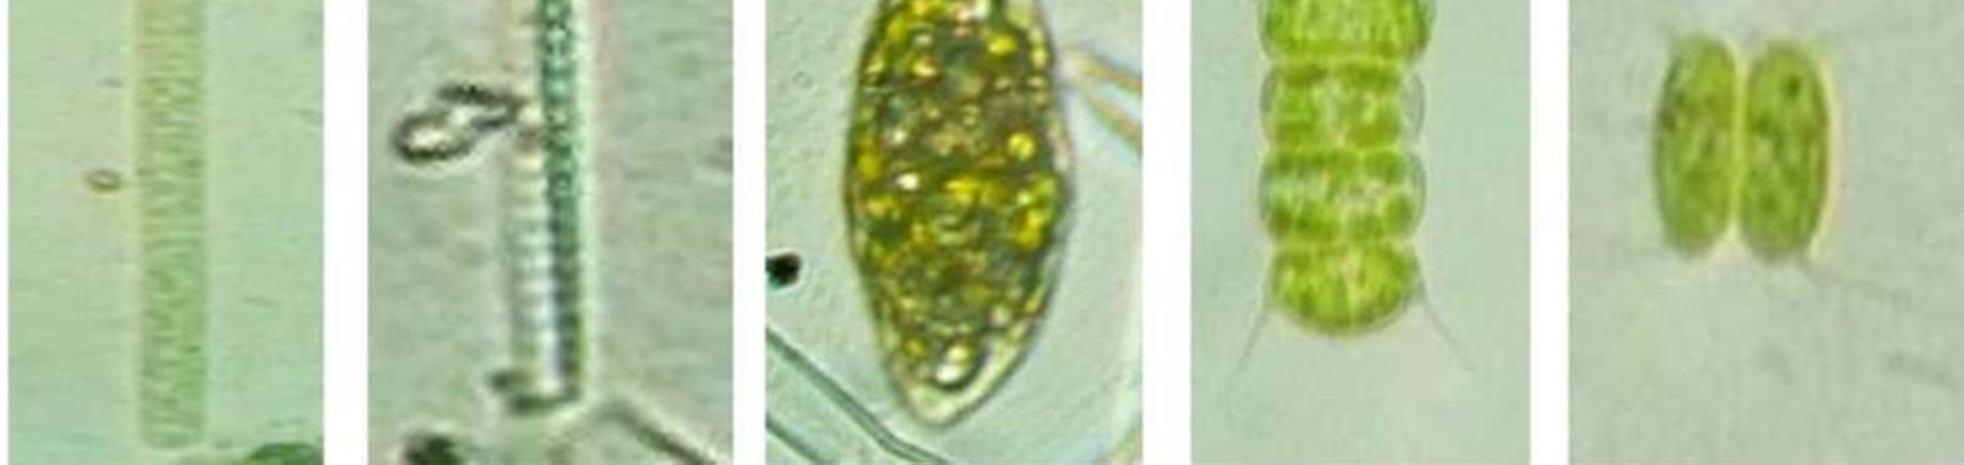
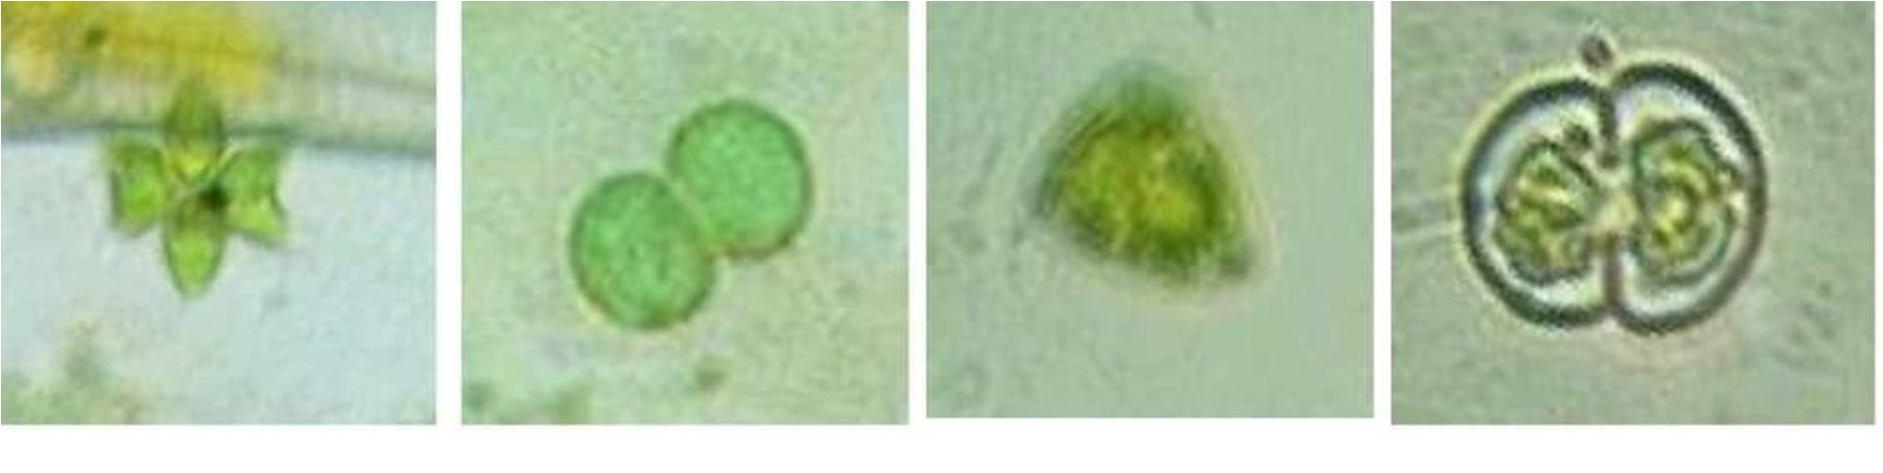
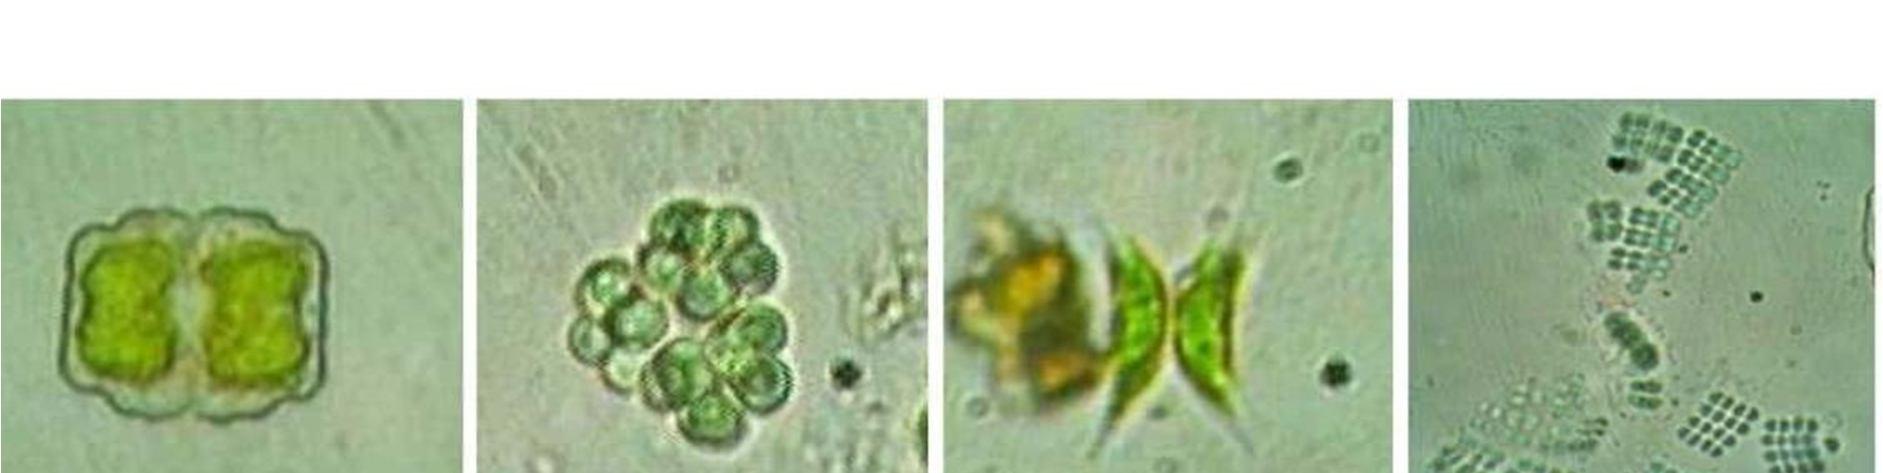
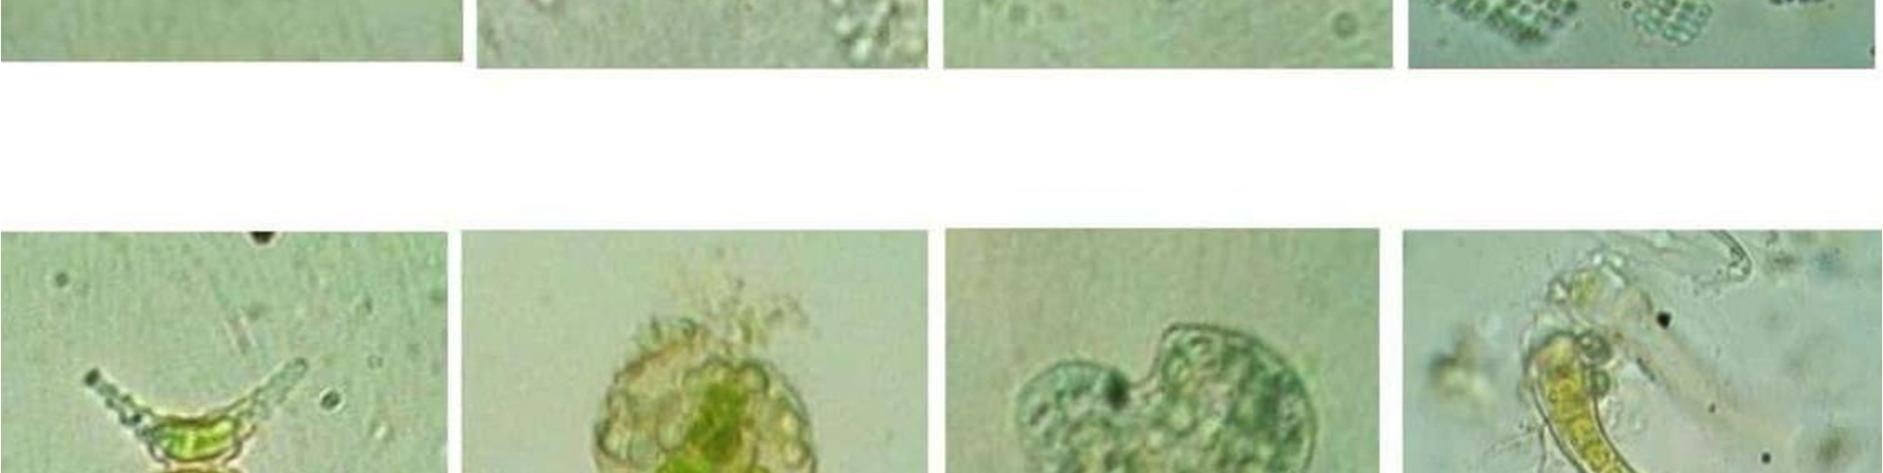
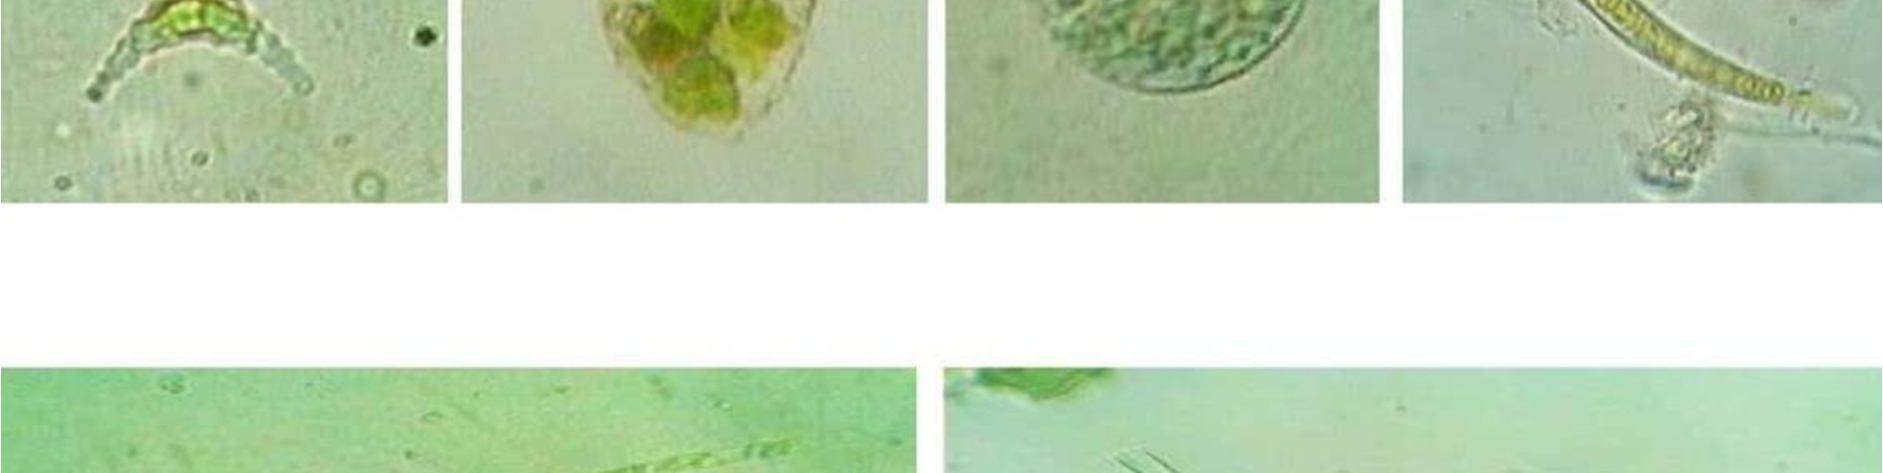
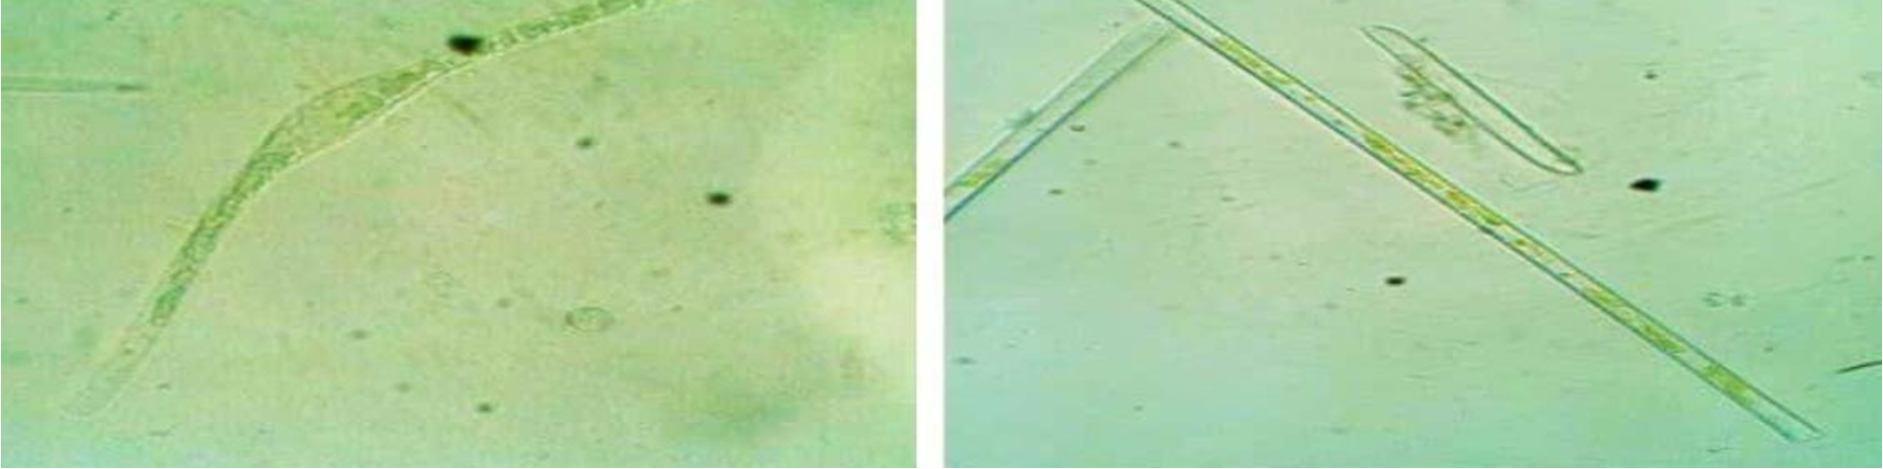
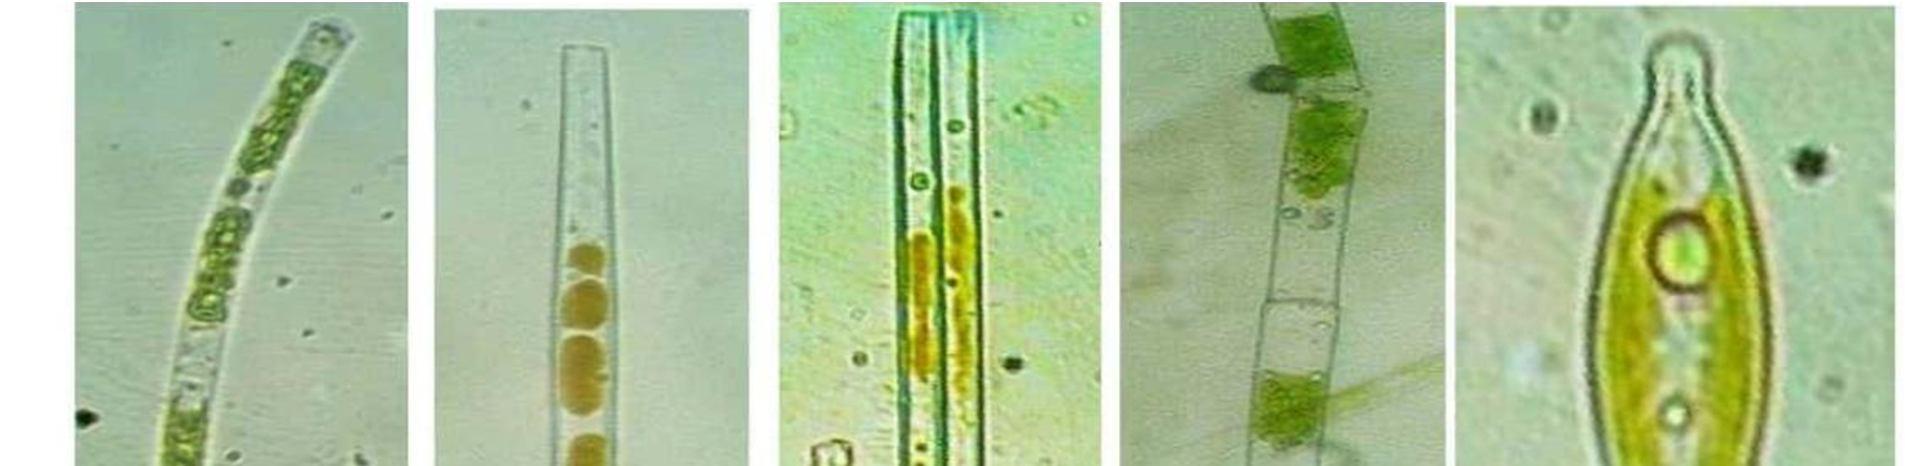
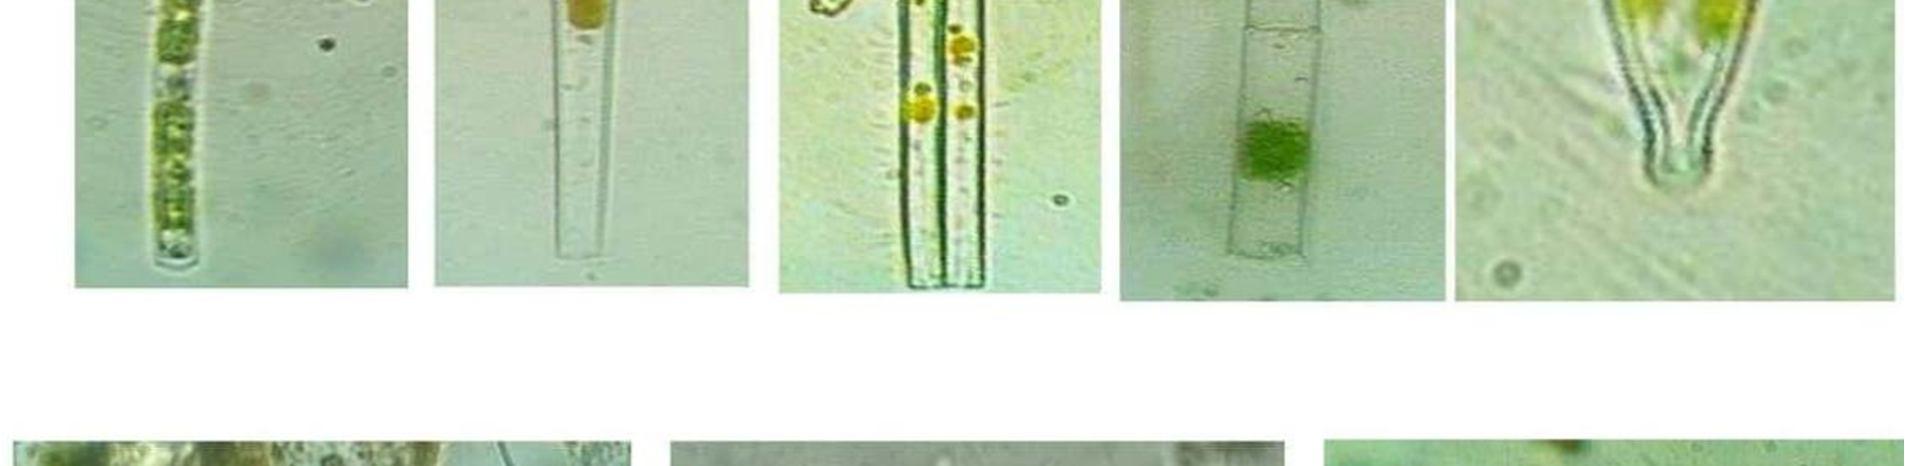
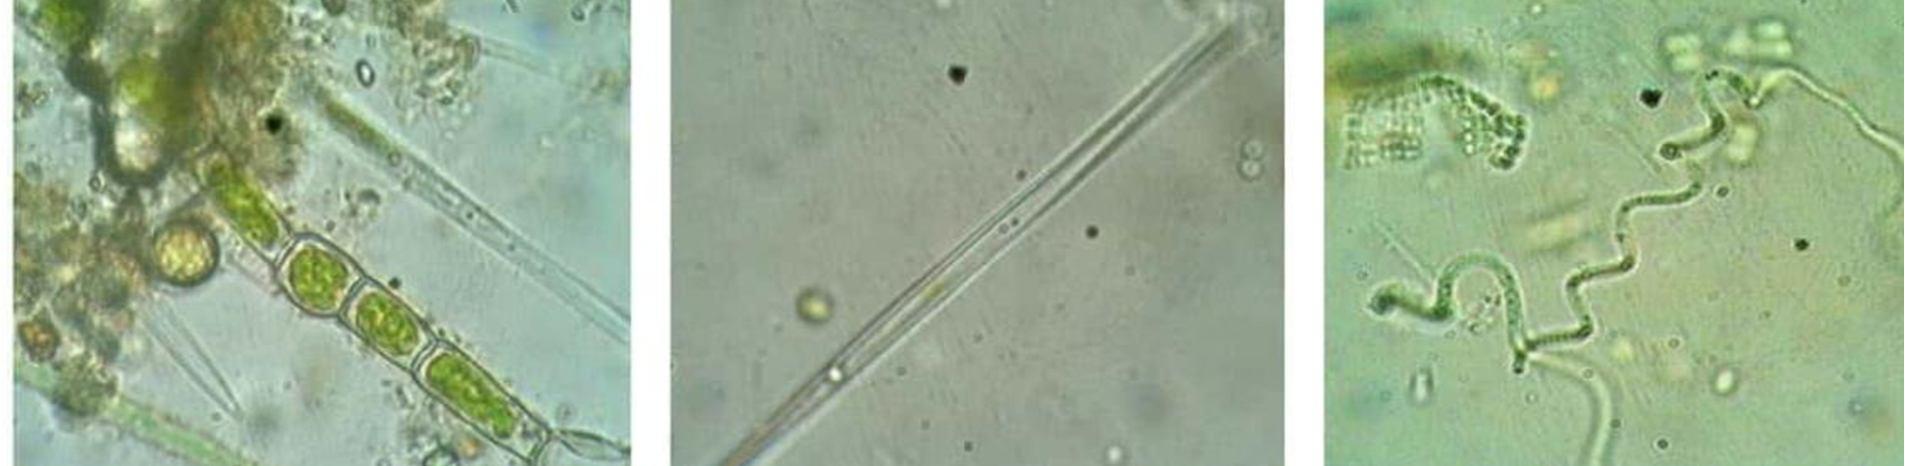
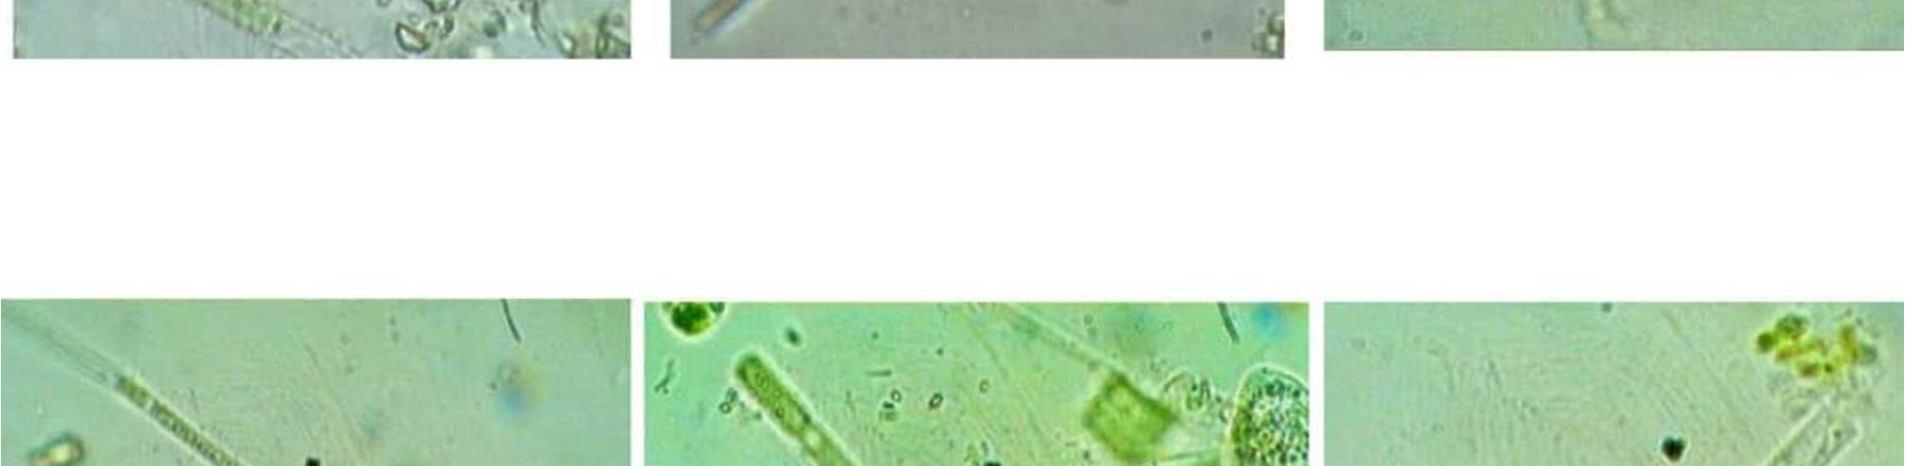
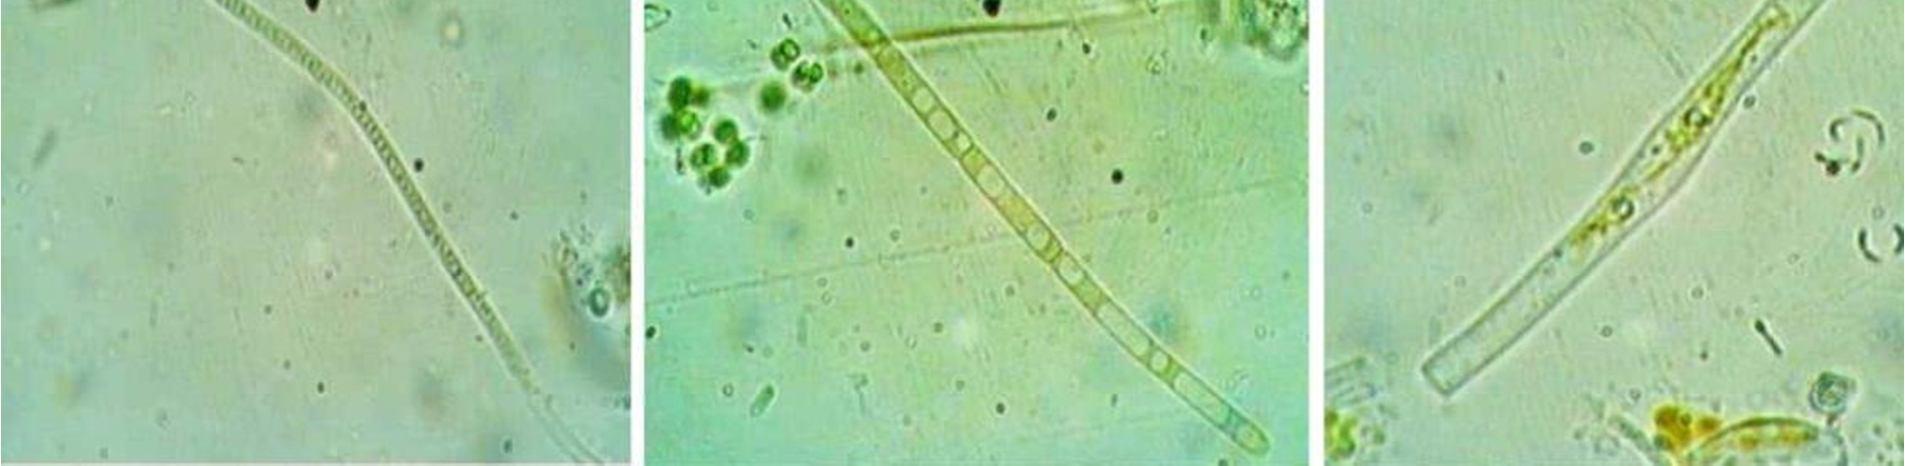
The phytoplankton community is a heterogenous group of tiny plants adapted to float in the sea and fresh waters. The analysis of phytoplankton population was done in selected Hadinaru lake in Mysuru district. Phytoplankton population analysis was done by using standard methods and identification was done by consulting taxonomic guides and monographs 5, 6 , 7. In the present study total of 52 species of phytoplanktons were identified in the Hadinaru lake of Mysuru district during the period April 2022 to August 2022 represented in the fig 7 Bacillariophyceae was high (50%) followed by Chlorophyceae (17%) and Cyanophyceae (15%). Desmidiaceae (8%), Euglenophyceae (6%) and Charophyta (4%) were very poorly represented. Among all the phytoplankton, Gomphonema augur(23800 O/L) was found in large number followed by Pinnularia gibba (21000 O/L), Gomphonema constrictum (16800 O/L) and Merismpedia tenuissima (15400 O/L).
Table 4:
of Hadinaru Lake from April 2022 August 2022
Names of Phytoplankton April May June July August O/L Chlorophyceae
Oedogonium sp. 2800 4200 2800 1400 1400 12600 Scendesmus quadrispina 1400 5600 2800 2800 0 12600
Desmodesmus abundans 1400 2800 0 0 0 4200
Amtodesmus dimorphous 0 0 1400 1400 0 2800
Tetraedron regulare 1400 1400 0 0 0 2800 Hariotina reticulatum 0 0 1400 1400 1400 4200
Tetradesmus major 0 0 0 1400 1400 2800 Parallela transversalis 0 0 1400 1400 1400 4200
Oedogonium sp. 2800 4200 1400 1400 1400 11200 Cyanophyceae
Phormidium sp. 0 4200 4200 1400 1400 11200
Planktothrix isothrix 1400 1400 0 0 0 2800
Komvophoron constrictum 0 0 0 1400 1400 2800
Merismopedia tenuissima 0 5600 2800 4200 2800 15400
Calothrix geitonos 0 0 0 1400 0 1400 Microchaete sp. 0 0 2800 4200 2800 9800
Arthrospira khannae 0 0 0 1400 1400 2800 Phormidium crassior 0 0 0 4200 4200 8400
Desmidiaceae
Cosmarium regnelli 0 0 0 1400 1400 2800
Cosmarium bitrapezoideum 0 0 1400 1400 1400 4200
Cosmarium trilobulatum 0 0 1400 0 0 1400
Staurastrum bloklandiae 0 0 0 1400 0 1400
Bacillariophyceae
Navicula gottlandica, 5600 4200 0 0 0 9800
Gomphonema augur 7000 8400 5600 1400 1400 23800
Gomphonema constrictum 5600 7000 0 2800 1400 16800
Gomphonema sp. 2800 4200 0 1400 1400 9800
Gomphonema grunowii 1400 0 2800 0 0 4200
Gomphoneis exigua 0 0 1400 0 0 1400
Gomphonema montanum 2800 4200 2800 0 0 9800
Gomphonema tabellaria 1400 1400 0 0 0 2800
Gomphonema elegans 0 0 1400 0 0 1400
Gomphonema parvulum 0 0 4200 1400 0 5600
Gomphonema parvulum 0 0 0 1400 0 1400
ISSN: 2321 9653; IC Value: 45.98; SJ Impact Factor: 7.538 Volume 10 Issue XI Nov 2022 Available at www.ijraset.com
var. micropus
Nitzschia holsatica 0 0 1400 1400 0 2800
Nitzschia sigmoidea 1400 4200 1400 2800 0 9800
Nitzschia sp. 0 0 2800 2800 0 5600
Nitzschia acicularis 1400 1400 1400 1400 0 5600
Synedra gracilis 4200 1400 1400 0 0 7000
Cymbella lanceolata 1400 2800 1400 0 0 5600
Cymbella sp. 1400 4200 1400 0 0 7000
Sellaphora pupula 1400 1400 0 0 0 2800
Gyrosigma sp. 1400 2800 1400 1400 0 7000
Pinnularia gibba 4200 7000 5600 2800 1400 21000
Ulnaria ulna 1400 4200 2800 1400 1400 11200
Ulnaria oxyshynchus 1400 1400 0 0 0 2800
Aulacoseira islandica 1400 2800 1400 1400 0 7000
Fragillaria sp. 0 0 1400 0 0 1400
Euglenophyceae
Euglena splendens 0 0 1400 0 0 1400
Lepocinclis ovum 1400 2800 0 0 0 4200
Euglena virdis 0 0 1400 0 0 1400
Charophyta
Klebsormidium sp. 0 0 0 1400 1400 2800 Klebsormidium sp. 0 0 0 1400 0 1400

ISSN: 2321 9653; IC Value: 45.98; SJ Impact Factor: 7.538 Volume 10 Issue XI Nov 2022 Available at www.ijraset.com
The Bray Curtis similarity index is the best tool in understanding the effect of abiotic and biotic components in the lake ecosystem. Based on the physico chemical and phytoplankton population hierarchical cluster analysis with Bray Curtis distance measure was performed. The level of significance is taken to be 0.48 and above. The outcome of Bray Curtis cluster analysis for Hadinaru lake during the period from April 2022 to August 2022 is represented in figure 2 for physicochemical and phytoplankton respectively. In the current study the highly correlated clusters were those of EC, Total hardness and Total alkalinity. The biological parameters like Chlorophyceae, Cyanophyceae and Bacillariophyceae have became one cluster and Desmidiaceae, Charophyta have became another cluster, these two clusters have showed high significance with the physico chemical cluster of EC, Total hardness and Total alkalinity.
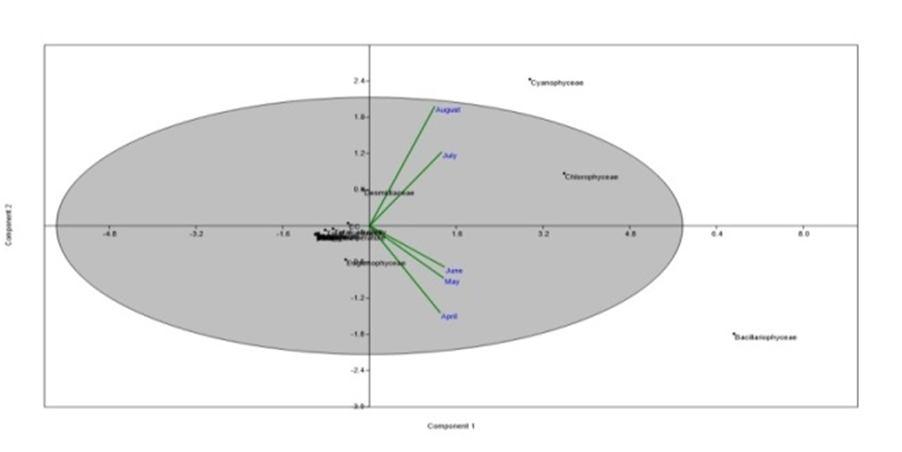
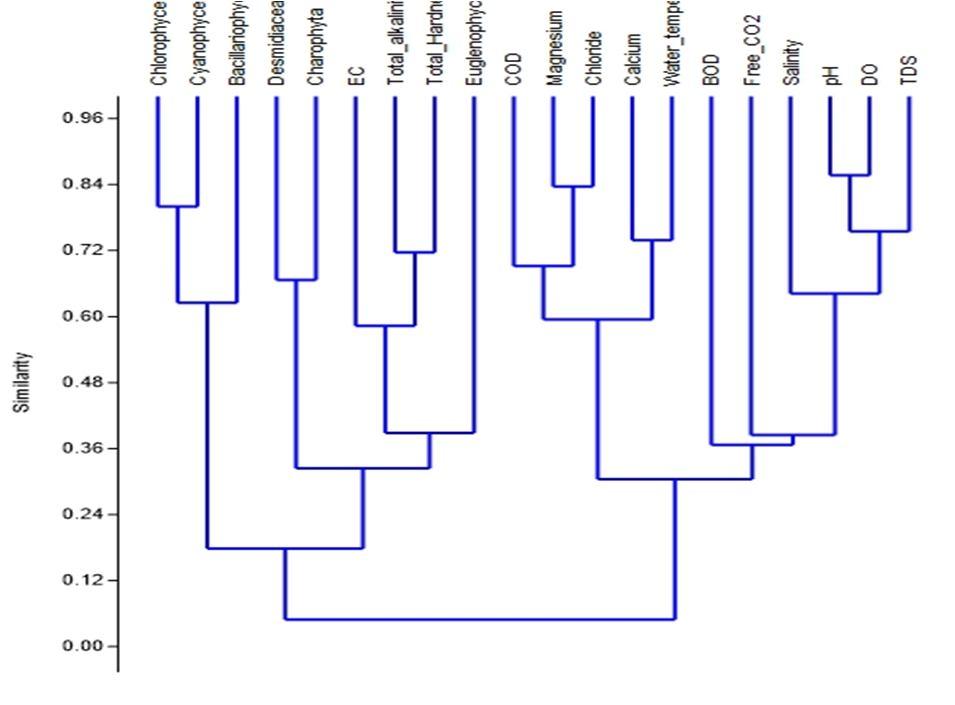
Fig 2: Bray Curtis Similarity Index of Biological Parameters of Hadinaru lake (April 2022 to August 2022)
A statistical relationship between the composition of phytoplankton and the physico chemical environment variables in the surface water was done by Principal Components Analysis (PCA) in the Multivariate Statistical Package PASTA Software. In the current study Cyanophyceae and Chlorophyceae showed positive correlation with EC but showed the negative correlation with other physico chemical parameters. The EC and other physico chemical parameter showed the positive correlation with Bacillariophyceae. This was shown in the figure 3.
Fig 3: Principal Component Analysis of Physico Chemical Parameters of Hadinaru lake (April 2022 to August 2022)
The diversity indices explain about the dominance, evenness and abundance of the species. Diversity indices like Simpson’s, Shannon wiener, Pielou’s evenness, Margalef’s index, Fisher’s alpha index and Berger Parker index were discussed. To know the diversity of phytoplankton the data was subjected to PASTA software. The calculated diversity indices are shown in Table 5 Simpson’s diversity index
Simpson’s index (D) is a measure of diversity, which takes into account both species richness, and an evenness of abundance among the species present. In essence it measures the probability that two individuals randomly selected from an area will belong to the same species. The formula for calculating D is presented as follows D = ∑ ( 1) ( 1)
ISSN: 2321 9653; IC Value: 45.98; SJ Impact Factor: 7.538 Volume 10 Issue XI Nov 2022 Available at www.ijraset.com
Where ni is the total number of organisms of each individual species N is the total number of organisms of all species
D ranges from value 0 to 1. With this index, 0 represents the infinite diversity and 1 represents thereis no diversity which indicates that, bigger the value lower the diversity 9 The index value ranged from 0.539 to 0.745. The minimum value recorded was 0.539 during April 2022 to a maximum value was 0.745 during July 2022. It shows species are not evenly distributed throughout the study.
This index helps in determining pollution status of the water body. According Willham and Dorris (1966) stated that values of the index ˃3 indicates clean water, values ˂3 indicates moderate pollution and values ˂1 is considered as heavily polluted. Normal values range from 0 to 4. This index is a combination of species present and the evenness of the species 15. It is represented as follows:
( ′ ) = L
Where is the proportion of the ith species and in natural logarithm. The value ranged from 0.986 to 1.449. The minimum value observed were 0.986 during April 2022 which indicates that the lake is heavily polluted during this month. Maximum value of 1.449 was recorded during July 2022. It implies the lake moderately polluted during the study.
Pielou’s Evenness Index (1975) measures the evenness of the species. The index is expressed as, = ′ log ( )

If H is the observed Shannon Weiner index, the maximum value this would take is log(S) where S is the total number of species in the habitat 13.The Pielou’s index value ranges from 0.670 to 0.851. The minimum value observed during April and maximum value of 0.851 during July. It shows that species were not evenly distributed throughout the year.
The Margalef’s index is also similar to Menhinick index, which also measures the richness of species in an ecosystem. It is calculated using the formula = − 1
It is calculated as the species number (S) minus 1 divided by the logarithm of the total number of individuals (N) 11 In the present investigation, the Margalef’s index values ranged from 0.299 to 0.404. The minimum value observed was 0.299 during April and maximum value of 0.404 during the month of August . The maximum richness of the species was found in august and minimum richness was found in April.
=1 Ln (N) 2 3 n
H. Fisher’s Alpha Index: The index is the alpha parameter 10 The index of diversity that assumes that the abundance of species follows the log series distribution: 2 , 3 , …. In the present investigation, the Fisher’s alpha values ranged from 0.358 to 0.470. The minimum value observed was 0.358 during May and maximum value of 0.470 during August . The maximum abundances of the species was found in august and minimum richness was found in May.
The Berger Parker diversity index has been used typically to assess the dominance of species in a community. It is represented as follows: = max
Where Nmax is the number of individuals in the most abundant species and N is the total number of individuals in the sample 14.In the present investigation, the Berger Parker values ranged from 0.300 to 0.625. The minimum value observed was 0.300 during July to a maximum value of 0.625 during April . It shows species were not evenly distributed throughout the year.
ISSN: 2321 9653; IC Value: 45.98; SJ Impact Factor: 7.538 Volume 10 Issue XI Nov 2022 Available at www.ijraset.com
Table 5: Biodiversity indices of Hadinaru lake during April 2022 to August 2022
April May June July August
Taxa_S 4 4 5 5 5
Individuals 22400 25200 28000 28000 19600
Dominance_D 0.4609 0.3889 0.34 0.255 0.2653
Simpson_1 D 0.5391 0.6111 0.66 0.745 0.7347
Shannon_H 0.9869 1.12 1.277 1.449 1.433
Evenness_e^H/S 0.6707 0.7662 0.7174 0.8518 0.838
Margalef 0.2995 0.296 0.3906 0.3906 0.4047 Menhinick 0.02673 0.0252 0.02988 0.02988 0.03571
Fisher_alpha 0.3626 0.3584 0.4532 0.4532 0.47
Berger Parker 0.625 0.5556 0.5 0.3 0.3571
The result of physico chemical and biological parameters along with statistical method and biodiversity indices indicated that the lake in the present study is threatened ecologically due to various anthropogenic activities which lead organic pollution and eutrophication status of the lake. As wetlands are rich in life, reservoirs for sewage disposal, maintenance of local ground water levels and as a refuge for local and migratory wildlife, it’s our responsibility to conserve the lakes in sustainable manner. Knowing the ecological status of the lake, will helpful for carrying out restoring practices of the same.
The authors gratefully acknowledge faculty of Post Graduate department of Botany, Yuvaraja’s College Mysore, University of Mysore, for providing their support and laboratory facility to conduct this research work.
[1] Shilpa, B.S., Darshan, M., Kshama, N., Manoj, S., Sindhu, S., and Sharmila, A. (2020). Water quality assessment of Hebbal Lake using Canadian Council of Ministers of Environment (CCME) Model. International Advanced Research Journal in Science and Technology. Vol.7., Issue 9.
[2] Hansen Victor. (1887). In limnology by Welch P. MC. Grew Hill Book. 536.
[3] Sumita Srivastava, Pramod Kumar and Anil Kumar. 2010. Comparative study of water characteristics and algal biodiversity in river Gomati and Varuna. Plant Archives. Vol. 10. No. 2: 725 728.
[4] Musharaf Khan., Farrukh Hussain and Shahana Musharaf. 2011. A fraction of fresh water algae of Kalpani stream and adjoining area of district Mardan, Pakistan. Int. J. of Biosci. Vol. 1. No. 3: 45 50.
[5] APHA. 2005. Standard methods for the examination of water and waste water, Washington D.C. 20th Ed.
[6] Trivedi, R.K. and Goel, P.K. 1984. Chemical and biological methods for pollution studies. Environmental Publication, Karad.
[7] Sudipta Kumar Das and Siba Prasad Adhikary. (2014). Freshwater Algae of Eastern India. Daya Publishing House, New Delhi.
[8] Mahesh Kumar, M.K., and Mahesh, M.K. (2015). “Assessment of phytoplankton diversity and physic chemical parameters in Chikkakere, Periyapatna, Mysore, Karnataka State, India”, International Journal of Current Research, 7(11), 22329 22335.
[9] Simpson, E. H. 1949. Measurement of Diversity. Nature. 163: 686
[10] Fisher, R. A., Corbert, A. S. and Williams, C. B. 1943. The relation between the numbers of Species and the number of individuals in a random sample of an animal population. J. Anim. Ecol. 12: 42 58
[11] Margalef, D. R. 1968. Perspectives in Eclogical Theory. The Univrsity of Chicago Press Chicago. p. 111.
[12] Menhinick’s Index as Described by Whittaker, R. H. 1977. Evolution of species diversity In land communities. In Evolutionary biology eds. Heeht M. K., W. C. Steee and B Wallace Plenum, NY.
[13] Pielou, E. C. 1975. Ecological Diversity. John Wiley and Sons New York. p. 165. Shannon, C. E. and Weiner, V. 1949. A mathematical Theory of Communication. University Press, Illinois Urban 101 107
[14] Berger, W. H. and Parker, F. L. 1970. Diversity of planktonic Foraminifer in deep sea Sediments Sci. 168:1345 7
[15] Shannon, C. E. and Weiner, V. 1949. A mathematical Theory of Communication. University Press, Illinois Urban 101 107