

Study and Analysis of Different Absorber Geometry of Compound Parabolic Solar Collector and its Effect on Thermal Efficiency for Heating Water for Sanitary Use
Nishant Kumar1 , Dharamveer Singh2
2Deptt of Mech., R. D. Engg College of Engg. Ghaziabad, U.P. 201206
Abstract: This project is focused on carrying out a study of the absorber geometry of the parabolic solar collector compound for heating water for sanitary use, to evaluate the temperature gradient between the inlet and outlet of the water of this concentraDDDtor collector, and the efficiency achieved according to the absorber configuration to later compare it with collectors with a conventional flat absorber surface. The parabola of the reflector of the composite parabolic solar collector was obtained considering the circular absorber, with a concentration ratio of 4 plus 10% of this, to consider a truncation of the reflector, the circular absorber was configured with a small absorber plate of aluminum which has a thermal conductivity of 401 W /mK The values obtained experimentally in the collector were based on the data collected in the field files. It was considered to experience the heating of water on different days with the climatic conditions, cloudy, partially cloudy and sunny, with a totally clear sky. The water heating tests were carried out with two types of geometric configuration of the absorber of the composite parabolic solar collector; circular absorber and configured circular absorber, with which a water outlet temperature of 61 ° C and 76 ° C and a thermal efficiency of 60% respectively were obtained, these results were presented taking into account a climatic condition (sunny day) approximately the same for the two absorber configurations, and with average values of wind speed, ambient temperature and solar radiation.
Keywords: parabolic solar, concentrator collector, flat absorber, concentration ratio, absorber geometry, sanitary, composite parabolic solar collector, ambient temperature, solar radiation
I. INTRODUCTION
In the world, in recent years there has been a notable increase in solar thermal energy installations; Technological advances allow the manufacture of better quality systems at a lower cost and society is understanding the need to replace fossil fuels. Since its first invention, several decades ago, various forms of solar thermal collectors have been developed, ranging from flat collectors to parabolic collectors and heliostats. For this reason, the use of solar thermal energy, beyond being an ecological alternative, has become an economically attractive and competitive technology in many countries.
Research has been carried out to promote the development of clean and renewable energy projects such as wind, hydroelectric, biomass and solar energy. an input for the implementation of technologically efficient production processes such as systems for water heating and swimming pool heating, all this through clean energy and under conditions of strategic advantage for our country due to the radiation it receives due to its geographical position

II. PROBLEM DEFINITION

The development of this research is necessary since it seeks to improve the capture of solar energy, studying the geometry of the absorber of the composite parabolic solar collector since it is one of the most used devices, especially due to its great capacity in energy concentration. The surface of the receiver or absorber can have different shapes; the most used form is the configuration with a flat receiver, on the other hand with the cylindrical form the face to the sun can capture direct radiation and the part hides the radiation by reflection. If not carried out, we will not be able to verify if this device will reach significantly higher temperatures, minimize losses, and thus achieve adequate efficiency in heating water for sanitary use.
Will the application of the absorber geometry of the composite parabolic solar collector allow us to achieve significantly higher temperatures for heating water for sanitary use?
With the development of this study, will an acceptable efficiency be determined for heating water for sanitary use using solar radiation?
Will this study know the energy advantage when configuring the absorber of the composite parabolic solar collector?
International
Engineering Technology
ISSN: 2321 9653; IC Value: 45.98; SJ Impact Factor: 7.538 Volume 10 Issue IX Sep 2022 Available at www.ijraset.com

III. ANALYSIS AND INTERPRETATION OF RESULTS
The water heating tests were carried out using a parabolic
composed of a circular absorber (recommends copper pipe as a material for the circulation of the working fluid).
It was considered to experience the heating of water on different days with the following climatic conditions:
Cloudy
Partial cloudy
Sunny, with a totally clear sky.
A. Water Heating Using The Circular Absorber
The climatic conditions: partially cloudy, sunny and cloudy, respectively.
outlet temperature of the water from the solar collector was analyzed, which depends on the temperature reached at the focus of concentration of the composite parabolic solar collector, which is the circular absorber.
B. Variation In Temperature Between The Water Inlet And Outlet Of The Solar Collector On A Cloudy Day
The outlet temperature for this climatic condition presented an average of 30.2 ° C, while the average inlet temperature that oscillates 17.2 ° C, having a temperature variation of 13 ° C.

Table 1: Variation of water inlet and outlet temperatures in the composite parabolic solar collector, 19 August 2020.
No. HOUR TEMPERATUREWATE R INLET TO COLLECTOR Ti (° C)
TEMPERATURECIRC ULAR ABSORBER T abs (° C)
TEMPERATUREWATE R OUTLET FROM MANIFOLD Ts (° C)
DIFFERENTIAL OUTLET TEMPERATURE COLLECTOR INLET ΔT (° C)
1 10:00 16.0 22.9 23.0 7.0
2 10:15 16.0 23.6 23.7 7.7
3 10:30 16.0 24.0 24.1 8.1
4 10:45 16.1 26.4 26.5 10.4
5 11:00 16.7 26.4 26.5 9.8
6 11:15 16.8 26.9 27.0 10.2
7 11:30 17.2 28.0 28.1 10.9
8 11:45 18.2 33.0 33.1 14.9
9 12:00 18.2 36.1 36.2 18.0
10 12:15 17.1 34.8 34.9 17.8
11 12:30 16.6 30.0 30.1 13.5
12 12:45 16.9 30.2 30.3 13.4
13 13:00 17.1 32.0 32.1 15.0
14 13:15 17.1 31.5 31.6 14.5
15 13:30 17.1 29.6 29.7 12.6
16 13:45 17.1 28.6 28.7 11.6
17 14:00 17.6 32.4 32.5 14.9
18 14:15 18.3 34.0 34.1 15.8
19 14:30 18.2 32.7 32.8 14.6
20 14:45 17.8 29.5 29.6 11.8
21 15:00 19.7 39.3 39.4 19.7
17.2 30.1 30.2 13.0
C.
climatic
Table 2: Variation of water
No. HOUR
ER INLET TO COLLECTOR Ti (° C)
1 10:00 16.0
2 10:15 16.1

TEMPERATURE CIRCULAR ABSORBER
abs (° C)
ISSN: 2321 9653; IC Value: 45.98; SJ Impact Factor: 7.538 Volume 10 Issue IX Sep 2022 Available at www.ijraset.com

43.2 ° C,
the average inlet temperature was around
of the composite parabolic solar collector, 29 July 2020.
COLLECTOR WATER OUTLET TEMPERATURE Ts (° C)
DIFFERENTIAL OUTLET TEMPERATURE COLLECTOR INLET ΔT (° C)
33.0 17.0
34.4 18.3
3 10:30 16.0 34.9 35.0 19.0
4 10:45 16.5 36.1 36.2 19.7
5 11:00 19.9
6 11:15 19.2
7 11:30 18.9
8 11:45 19.5
9 12:00 21.1
10 12:15
11 12:30 20.3
12:45
13:00
13:15
40.1 20.2
41.4 22.2
37.7 18.8
36.4 16.9
37.2 16.1
39.2 17.1
48.3 28.0
49.1 29.8
47.9 27.6
32.5
30.2
29.3
28.8
ISSN: 2321 9653; IC Value:

10 Issue IX Sep 2022
C,
1 10:00 15.8
2 10:15 16.9

3 10:30 23.5
4 10:45 27.8
5 11:00 31.3
11:15
11:30
11:45
9 12:00 19.1
12:15 19.6
12:30 19.9
12:45 20.3
13:00 19.8
13:15 19.9
13:30 20.2
13:45 20.2
at www.ijraset.com

38.6 22.8
45.9 29.0
48.4 24.9
58.0 30.2
60.8 29.5
65.7 31.9
70.5 35.4
67.8 47.3
68.3 49.2
65.8 46.2
66.2 46.3
62.4 42.1
67.1 47.3
67.0 47.1
63.7 43.5
64.5 44.3
64.7 43.9
41.3
39.4
Engineering Technology (IJRASET

ISSN: 2321 9653; IC Value: 45.98; SJ Impact Factor: 7.538 Volume 10 Issue IX Sep 2022 Available at www.ijraset.com
Equation (4.1) can be expressed as follows: Ag = length * width = 1.535m * 0.85m = 1.305 m2 = 0.003 kg / s through equation (2.35) with water density values of ρwater = 997 kg / m3 average water velocity vprom = 0.01 m / s assumed according to Toalombo (2011) which specifies that the flow velocity of liquids inside pipes does not exceed 3m / s; and a cross sectional area of the duct (circular absorber) Ac = 0.00028 m2. The two integrals of equation were developed separately and assuming the values of , Cp and Ag as constants. To solve the integrals of equation the Toalombo trapezoid method (2011) was applied, which assumes a linear behavior of both (ΔT = Ts Ti) and of the direct radiation Gb incident on the solar collector in fifteen minute intervals.


Figure 1: Definition of the Trapezoid Method to determine the area under a curve.
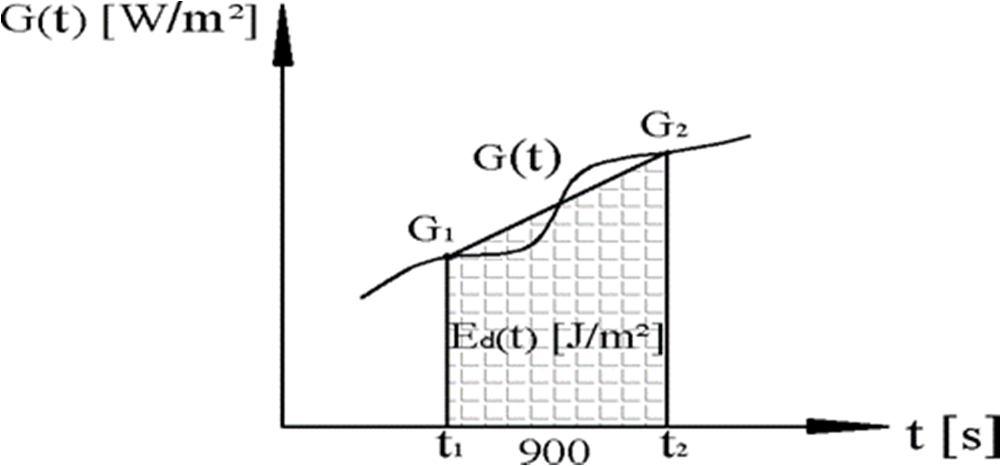
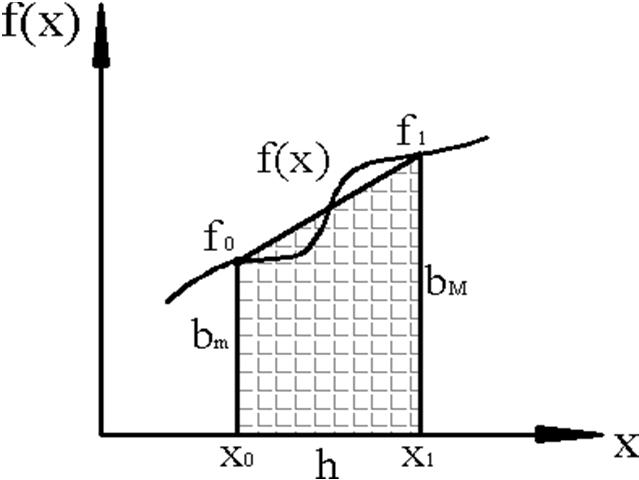
According to the data of direct radiation Gb incident on the solar collector, obtained from Annex A, for each day analyzed, the stored energy was obtained in fifteen minute intervals applying the trapezoid method to solve equation
Figure 2: Definition of the trapezoid method to determine the energy stored in the solar collector in fifteen minute intervals.
According to Toalombo (2011), it is possible to determine the variation in temperatures between the outlet and inlet of the panel with respect to time in fifteen minute intervals using the trapezoid method to solve equation and add the partials.

International
(IJRASET
ISSN: 2321 9653; IC Value: 45.98; SJ Impact Factor: 7.538 Volume 10 Issue IX Sep 2022 Available at www.ijraset.com

F. Thermal Efficiency
equation, the energy was calculated in 15 minute intervals
the partials were added for the total by applying the trapezoid method
approximation of areas
whose values
presented in table 4
Table 4: Energy stored in the collector (19 August 2020) HOUR (hh: mm) RADIATION DIRECT INCIDENT IN THE COLLECTOR Gb (W / m²) ENERGY EVERY 15MIN Ea (J / m²)
ACCUMULATED ENERGY Ea (J / m²)
10:00 147.04 0 0

10:15 172.36 143730 143730
10:30 150.19 145144 288875
10:45 188.33 152331 441206
11:00 198.52 174082 615288
11:15 204.40 181317 796604
11:30 248.23 203688 1000292
11:45 265.50 231180 1231472
12:00 245.10 229770 1461243
12:15 202.94 201617 1662860
12:30 183.69 173982 1836842 12:45 191.68 168919 2005 761 13:00 201.75 177046 2182807 13:15 191.39 176914 2359722 13:30 194.31 173567 2533289 13:45 212.17 182916 2716205
195.19 183309 2899513
14:15 175.66 166882 3066395
14:30 309.70 218412 3284807
366.90 304471 3589279 15:00 205.94 257779 3847058
the
of which are presented in Table
ISSN: 2321 9653;
Value:
www.ijraset.com

10:00 0 16.0 23.0 7.0 0
10:15 900 16.0 26.4 10.4 7830
10:30 1800 16.0 24.1 8.1 16155
10:45 2700 16.1 26.5 10.4 24480
11:00 3600 16.7 26.5 9.8 33570
11:15 4500 16.8 27.0 10.2 42570
11:30 5400 17.2 28.1 10.9 52065
11:45 6300 18.2 33.1 14.9 63675
12:00 7200 18.2 36.2 18.0 78480
12:15 8100 17.1 34.9 17.8 94590
12:30 9000 16.6 30.1 13.5 108675
12:45 9900 16.9 30.3 13.4 120780
13:00 10800 17.1 32.1 15.0 133560

13:15 11700 17.1 31.6 14.5 146835
13:30 12600 17.1 29.7 12.6 159030
13:45 13500 17.1 28.7 11.6 169920
14:00 14400 17.6 32.5 14.9 181845
14:15 15300 18.3 34.1 15.8 195660
14:30 16200 18.2 32.8 14.6 209340
14:45 17100 17.8 29.6 11.8 221220
15:00 18000 19.7 39.4 19.7 235395
ISSN: 2321 9653; IC Value: 45.98; SJ Impact Factor: 7.538 Volume 10 Issue IX Sep 2022 Available at www.ijraset.com

13:30 60.3228
60.1131
60.2647
61.3142
61.2392
59.2249
58.7971
Through equation
(hh:
On A Partly Cloudy Day
Table 7:
the
the partials were added for the total by applying the
table 7 for a partial cloudy day.
(29 July 2020)
ENERGY
15MIN Ea (J / m²)
ENERGY Ea (J / m²)
10:00 186,134 0 0

10:15 211,865 179100 179100
10:30 244,578 205400 384499
10:45 394,813 287726 672225
11:00 408,378 361436 1033661
11:15 397,212 362515 1396176
11:30 265,660 298293 1694469
11:45 282,711 246767 1941236
12:00 250,426 239912 2181148
12:15 366,084 277430 2458578
12:30 383,962 337521 2796099
12:45 270,439 294480 3090579
13:00 416,127 308955 3399534
13:15 271,648 309499 3709033
13:30 332,840 272020 3981053
13:45 380,382 320950 4302003
14:00 328,499 318997 4621000
14:15 327,547 295221 4916221
14:30 213,622 243526 5159747
14:45 177,850 176162 5335909
15:00 123,333 135532 5471441
By means of equation, the temperature variation for a cloudy partial day was determined, in 15 minute intervals, the results of which are presented in Table 8.
2321 9653; IC Value:
Issue
at www.ijraset.com

Table
10:00 0 16.0 33.0 17.0 0
10:15 900 16.1 34.4 18.3 15885
10:30 1800 16.0 35.0 19.0 32670

10:45 2700 16.5 36.2 19.7 50085
11:00 3600 19.9 40.1 20.2 68040
11:15 4500 19.2 41.4 22.2 87120
11:30 5400 18.9 37.7 18.8 105570
11:45 6300 19.5 36.4 16.9 121635
12:00 7200 21.1 37.2 16.1 136485
12:15 8100 22.1 39.2 17.1 151425
12:30 9000 20.3 48.3 28.0 171720
12:45 9900 19.3 49.1 29.8 197730
13:00 10800 20.3 47.9 27.6 223560
13:15 11700 19.0 51.5 32.5 250605
13:30 12600 19.3 45.2 25.9 276885
13:45 13500 19.4 43.9 24.5 299565
14:00 14400 21.5 51.7 30.2 324180
14:15 15300 20.1 51.9 31.8 352080
14:30 16200 20.4 49.7 29.3 379575
14:45 17100 20.5 49.3 28.8 405720
15:00 18000 20.8 47.2 26.4 430560
minute intervals
the
in Tables
and
International Journal for Research in Applied Science & Engineering Technology (IJRASET)

ISSN: 2321 9653; IC Value: 45.98; SJ Impact Factor: 7.538 Volume 10 Issue IX Sep 2022 Available at www.ijraset.com
H. Thermal Efficiency On A Sunny Day
Through equation the energy was calculated in 15 minute intervals and the partials were added for the total by applying the trapezoid method for approximation of areas and whose values are presented in table 10 for a sunny day.
Table 4.10: Energy stored in the collector (12 June 2020) HOUR (hh: mm) DIRECT INCIDENT RADIATION IN THE COLLECTOR Gb (W / m²) ENERGY EVERY 15MIN Ea (J / m²)
ACCUMULATED ENERGY Ea (J / m²)
10:00 393,550 0 0
10:15 441,202 375638 375638
10:30 469,822 409960 785599
10:45 545,177 456749 1242348

11:00 556,543 495774 1738122
11:15 615,222 527294 2265416
11:30 695,368 589766 2855182
11:45 642,843 602195 3457377
12:00 683,268 596750 4054127 12:15 664,900 606675 4660803 12:30 655,145 594020 5254823 12:45 634,527 580352 5835175 13:00 622,519 565671 6400846 13:15 600,284 550261 6951107 13:30 581,921 531992 7483099 13:45 553,511 510944 7994044 14:00 519,164 482704 8476748 14:15 550,152 481192 8957940 14:30 459,349 454275 9412216 14:45 435,954 402887 9815102 15:00 322,393 341256 10156358
By means of equation, the temperature variation for a sunny day was determined, in 15 minute intervals, the results of which are presented in Table 11.
ISSN: 2321 9653; IC Value: 45.98;
Issue
7.538
www.ijraset.com

10:00 0 15.8 38.6 22.8 0
10:15 900 16.9 45.9 29.0 23310
10:30 1800 23.5 48.4 24.9 47565
10:45 2700 27.8 58.0 30.2 72360
11:00 3600 31.3 60.8 29.5 99225
11:15 4500 33.8 65.7 31.9 126855
11:30 5400 35.1 70.5 35.4 157140
11:45 6300 20.5 67.8 47.3 194355
12:00 7200 19.1 68.3 49.2 237780
12:15 8100 19.6 65.8 46.2 280710
12:30 9000 19.9 66.2 46.3 322335
12:45 9900 20.3 62.4 42.1 362115
13:00 10800 19.8 67.1 47.3 402345
13:15 11700 19.9 67.0 47.1 444825

13:30 12600 20.2 63.7 43.5 485595
13:45 13500 20.2 64.5 44.3 525105
14:00 14400 20.8 64.7 43.9 564795
14:15 15300 20.3 62.7 42.4 603630
14:30 16200 21.9 63.2 41.3 641295
14:45 17100 21.3 63.1 41.8 678690
15:00 18000 21.3 61.6 40.3 715635
Table 12 shows the thermal efficiency values determined by equation in 15 minute intervals with the values obtained in Tables 10 and 11 for a sunny day.
International Journal
Research in
Science & Engineering Technology (IJRASET

ISSN: 2321 9653; IC Value: 45.98; SJ Impact Factor: 7.538 Volume 10 Issue IX Sep 2022 Available at www.ijraset.com
Table 4.12: Thermal efficiency of the composite parabolic solar collector (12 June 2020). HOUR (hh: mm) ɳg (%) 10:00
10:15 59.63 10:30 58.18 10:45 55.97 11:00 54.86

11:15 53.81 11:30 52.89 11:45 54.02 12:00 56.36 12:15 57.87 12:30 58.94 12:45 59.63 13:00 60.40 13:15 61.49 13:30 62.36 13:45 63.12 14:00 64.02 14:15 64.75 14:30 65.47 14:45 66.45 15:00 67.71
I. Data Interpretation
From the values established in literal (4.1), the scatter graphs were made in which the outlet temperature, solar radiation as a function of time was analyzed, and the efficiency curve was obtained from the efficiency ratio collector thermal as a function of the ratio of the water inlet temperature to the collector Ti minus the ambient temperature Ta on the direct component of the incident radiation on the solar collector; according to the geometric configuration of the absorber of the composite parabolic solar collector.
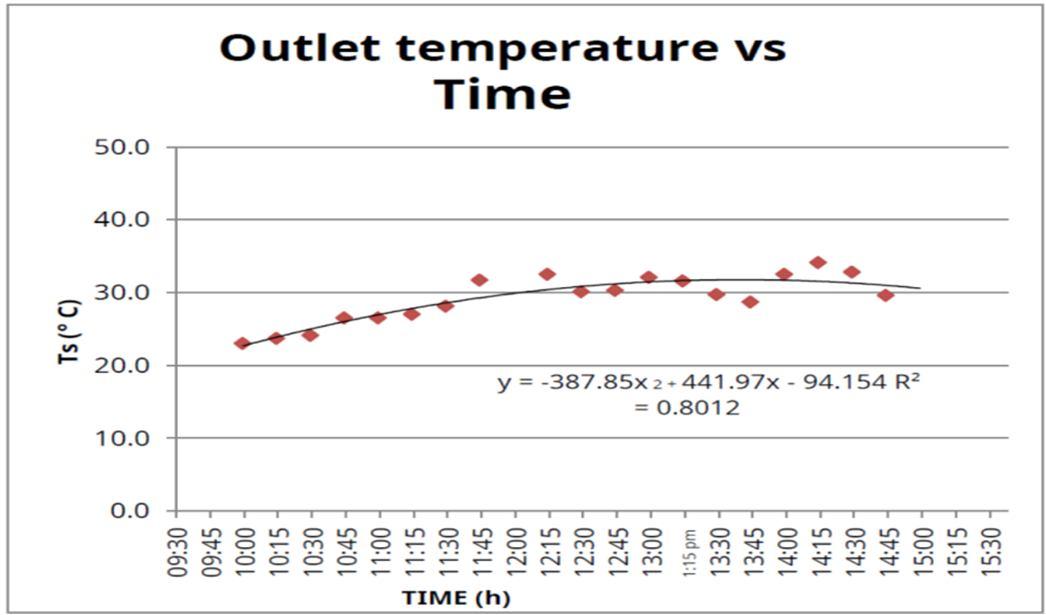
Graph 1: Outlet temperature vs Weather, 19 August 2020 cloudy (circular absorber).
Graph 1 shows the temperature variation for 19 August 2020, with a cloudy weather condition, which tends to a quadratic distribution curve. The outlet temperature has an unstable behavior and presents a value of 34.8 ° C as its highest peak. minus the ambient temperature on the direct component of the incident radiation in the solar collector, for 19 August 2020.
ISSN: 2321 9653; IC Value: 45.98; SJ Impact Factor: 7.538

10 Issue IX Sep 2022
at www.ijraset.com
HOUR
MBIENT Ta (° C)

COLLECTOR Ti (° C) DIRECT INCIDENT RADIATION IN THE COLLECTOR Gb (W / m²) (Ti Ta) / Gb
1 10:00 16.1 16.0 147.04 0.001
2 10:15 16.5 16.0 172.36 0.003
3 10:30 16.4 16.0 150.19 0.003
4 10:45 16.7 16.1 188.33 0.003
5 11:00 16.5 16.7 198.52 0.001
6 11:15 16.8 16.8 204.40 0.000
7 11:30 15.9 17.2 248.23 0.005
8 11:45 21.8 18.2 265.50 0.014
9 12:00 17.1 18.2 245.10 0.004
10 12:15 16.9 17.1 202.94 0.001
11 12:30 17.8 16.6 183.69 0.007
12 12:45 16.8 16.9 191.68 0.001
13 13:00 17.5 17.1 201.75 0.002
14 13:15 16.9 17.1 191.39 0.001
15 13:30 17.8 17.1 194.31 0.004
16 13:45 17.6 17.1 212.17 0.002
17 14:00 18.3 17.6 195.19 0.004
18 14:15 19.6 18.3 175.66 0.007
19 14:30 19.8 18.2 309.70 0.005
20 14:45 17.2 17.8 366.90 0.002
21 15:00 19.3 19.7 205.94 0.002
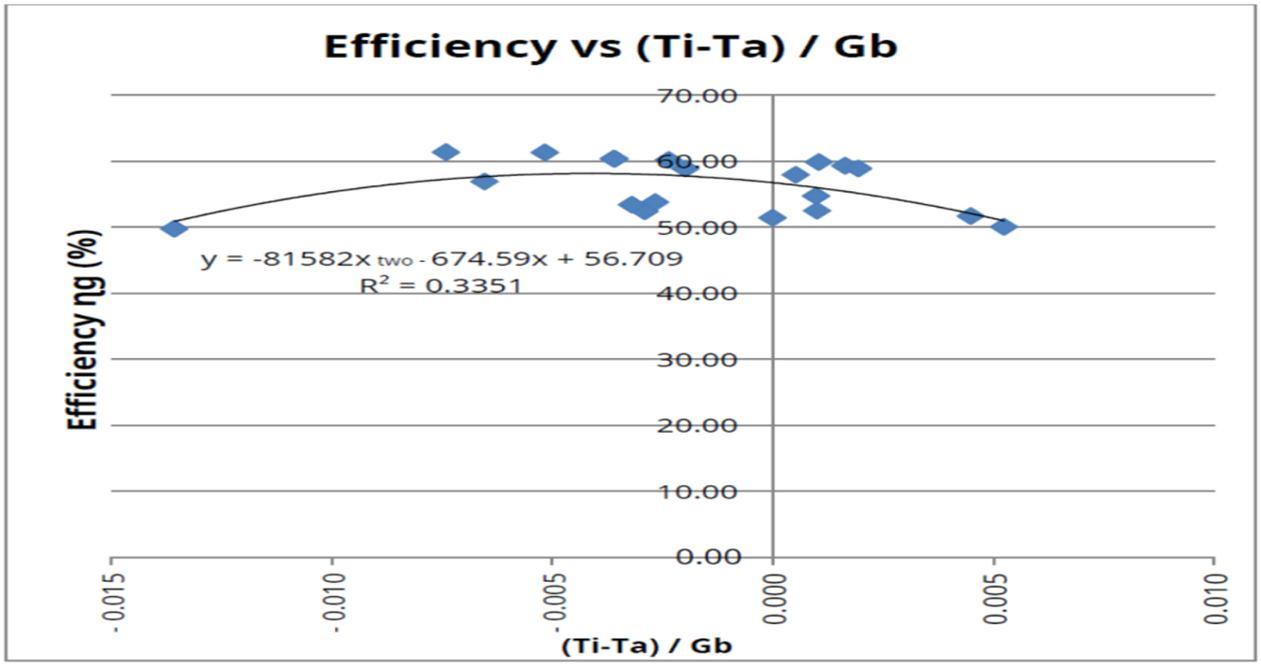
Efficiency of the table 6 and the values of the relation of the inlet temperature minus the ambient temperature on the direct component of the incident radiation in the solar collector of the table 13.
Graph 2: Thermal Efficiency, 19 August 2020 cloudy (circular absorber).
For this climatic condition the graph produces a quadratic distribution curve, between the thermal efficiency of the solar collector and the relation of the inlet temperature minus the ambient temperature on the direct component of the incident radiation in the collector, which shows us for a cloudy day, thermal efficiency values between 50% and 61%.
International
ISSN: 2321 9653; IC Value: 45.98; SJ Impact Factor: 7.538

Volume 10 Issue IX Sep 2022 Available at www.ijraset.com
Graph 3: Outlet temperature vs Time, 29 July 2020 partial cloudy (circular absorber).
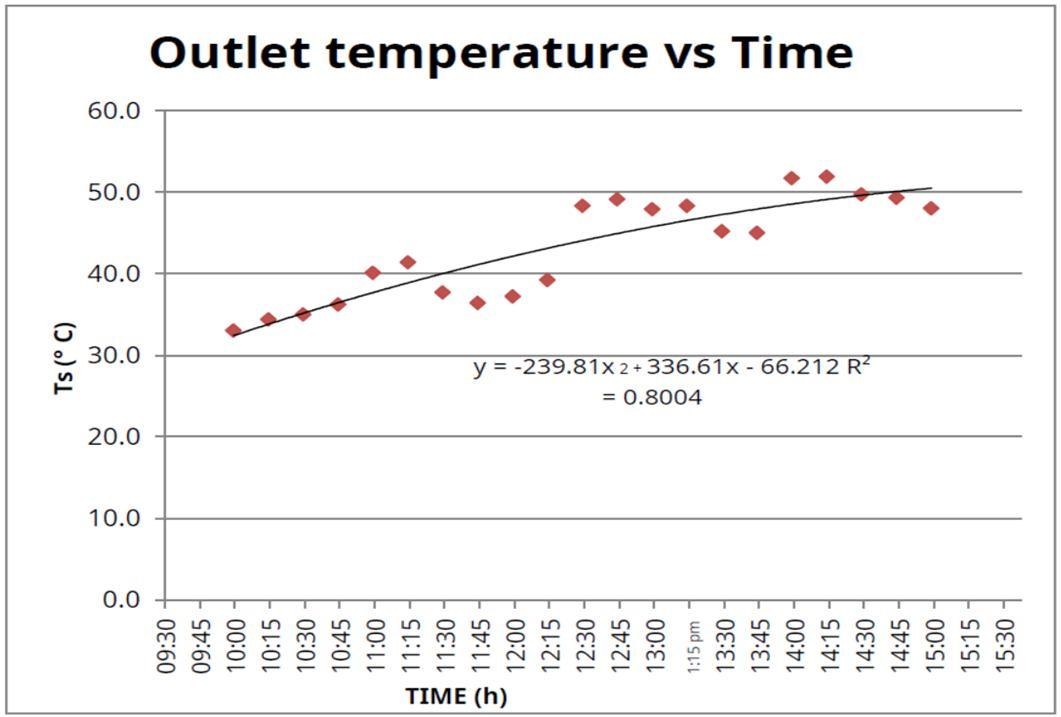
Graph 3 shows the variation of the outlet temperature for 29 July 2020, with a partially cloudy climatic condition, which tends towards an increasing quadratic distribution curve, having a maximum value of 51.9 ° C. and a minimum value of 33 ° C for the collector outlet water temperature minus the ambient temperature on the direct component of the incident radiation in the solar collector, for 29 July 2020.
Table 14: Inlet temperature difference minus outlet temperature relation on the direct component of the incident radiation in the collector, 29 July 2020.
No. HOUR
TEMPERATUREAMBIE NT Ta (° C)
TEMPERATUREWATER INLET TO COLLECTOR Ti (° C)
DIRECT INCIDENT RADIATION IN THE COLLECTOR Gb (W / m²)
(Ti Ta) / Gb
1 10:00 20.8 16.0 186.13 0.03
2 10:15 22.4 16.1 211.87 0.03
3 10:30 23.4 16.0 244.58 0.03
4 10:45 22.9 16.5 394.81 0.02
5 11:00 27.3 19.9 408.38 0.02
6 11:15 28.0 19.2 397.21 0.02
7 11:30 22.8 18.9 265.66 0.01
8 11:45 23.2 19.5 282.71 0.01
9 12:00 23.8 21.1 250.43 0.01
10 12:15 23.1 22.1 366.08 0.00
11 12:30 19.8 20.3 383.96 0.00
12 12:45 22.9 19.3 270.44 0.01
13 13:00 21.6 20.3 416.13 0.00
14 13:15 21.3
271.65 0.01
15 13:30 22.8 19.3 332.84 0.01
16 13:45 23.1 19.4 380.38 0.01
17 14:00 24.8

328.50 0.01
18 14:15 23.9 20.1 327.55 0.01
19 14:30 23.5 20.4 213.62 0.01
20 14:45 21.9
15:00 19.8
177.85 0.01
123.33 0.01
(IJRASET

ISSN: 2321 9653; IC Value: 45.98; SJ Impact Factor: 7.538 Volume 10 Issue IX Sep 2022 Available at www.ijraset.com
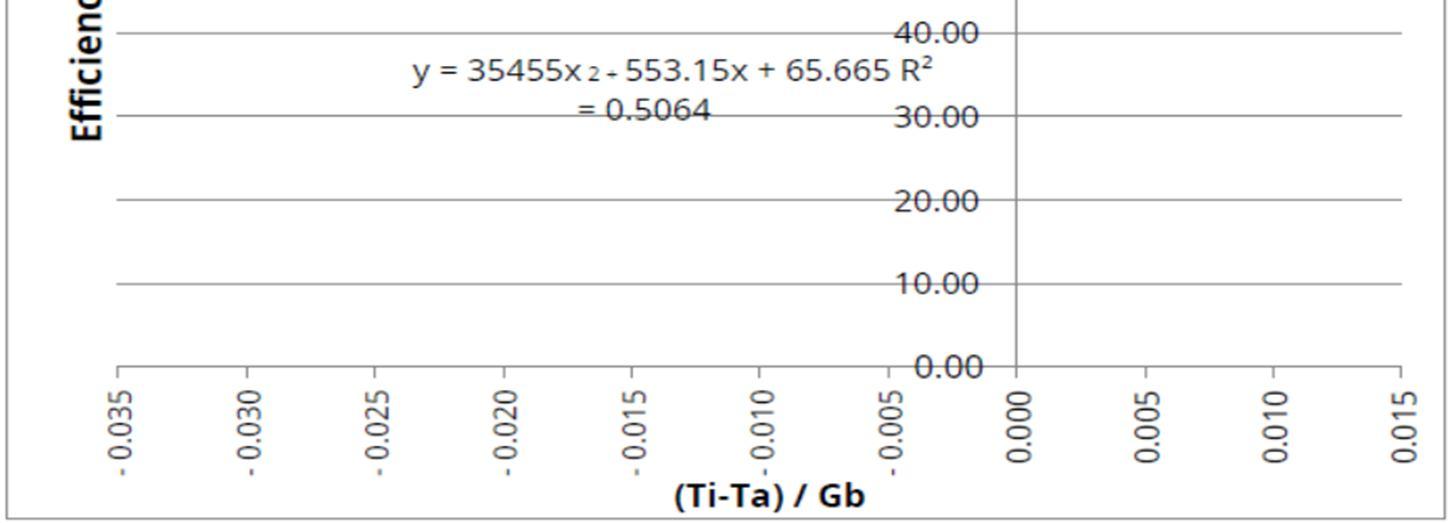

Graph 4: Thermal Efficiency, 29 July 2020 partly cloudy (circular absorber).
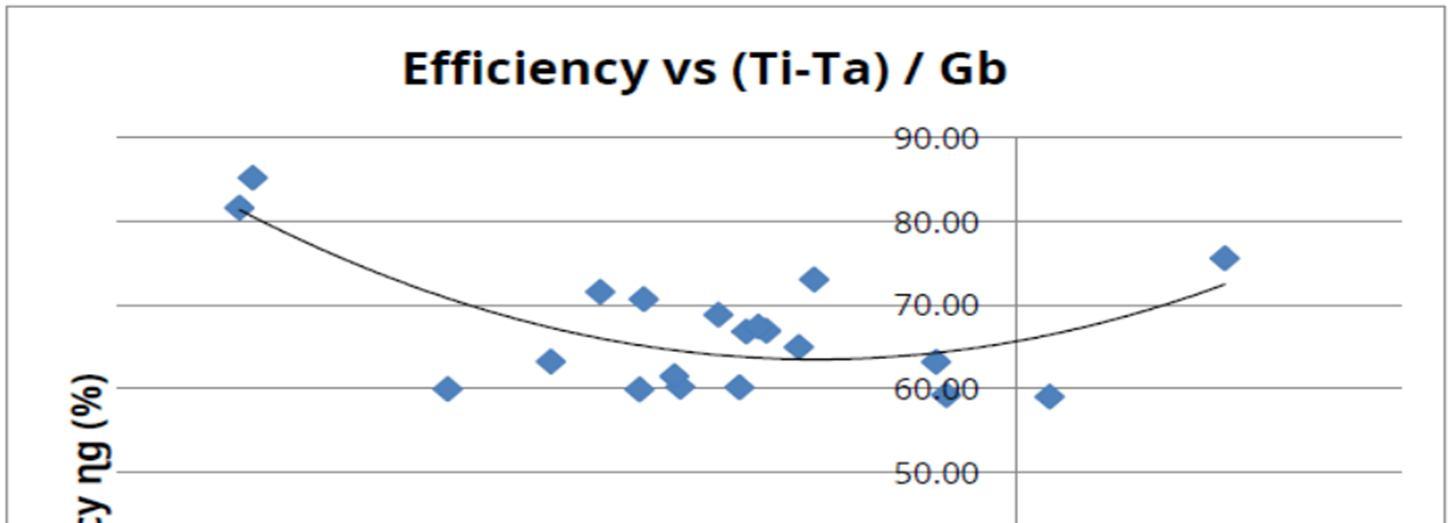
For this climatic condition, the graph produces a quadratic distribution between the thermal efficiency of the system and the relation of the inlet temperature minus the ambient temperature on the direct component of the incident radiation in the solar collector, which shows us for a partially cloudy day, thermal efficiency values between 59% and 85%.
Graph 5: Outlet temperature vs Time, 12 June 2020 sunny (circular absorber).
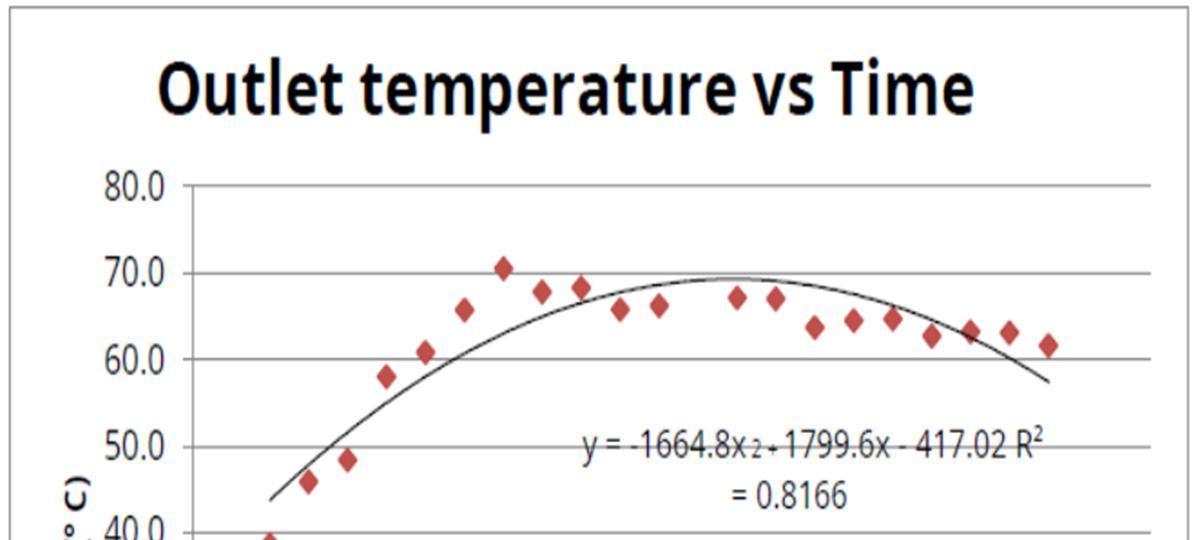
Graph 5 shows the variation in temperature for 12 June 2020, with a sunny weather condition, which tends to a quadratic distribution curve. The highest peak has a value of 70.4 ° C, and has stable values between 60 and 65 ° C as of 11:00 minus the ambient temperature on the direct component of the incident radiation in the solar collector, for 12 June 2020.

Table
No. HOUR TEMPERATUREAMBIE NT Ta (° C)
TEMPERATUREWATER INLET TO COLLECTOR Ti (° C)
ISSN: 2321 9653; IC Value: 45.98;
Impact Factor: 7.538 Volume 10 Issue IX Sep 2022


at www.ijraset.com
DIRECT INCIDENT RADIATION IN THE COLLECTOR Gb (W / m²) (Ti Ta) / Gb
1 10:00 27.2 15.8 393.55 0.03
2 10:15 27.9 16.9 441.20 0.02

3 10:30 27.4 23.5 469.82 0.01
4 10:45 22.1 27.8 545.18 0.01
5 11:00 24.1 31.3 556.54 0.01
6 11:15 26.2 33.8 615.22 0.01
7 11:30 28.5 35.1 695.37 0.01
8 11:45 27.8 20.5 642.84 0.01
9 12:00 25.1 19.1 683.27 0.01
10 12:15 23.5 19.6 664.90 0.01
11 12:30 23.3 19.9 655.14 0.01
12 12:45 22.7 20.3 634.53 0.00
13 13:00 22.3 19.8 622.52 0.00
14 13:15 26.3 19.9 600.28 0.01
15 13:30 27.8 20.2 581.92 0.01
16 13:45 22.1 20.2 553.51 0.00
17 14:00 23.7 20.8 519.16 0.01
18 14:15 20.6 20.3 550.15 0.00
19 14:30 26.7 21.9 459.35 0.01
20 14:45 25.9 21.3 435.95 0.01
21 15:00 24.8 21.3 322.39 0.01
Efficiency of the table 8 and the values of the relation of the inlet temperature minus the ambient temperature on the direct component of the incident radiation in the solar collector of the table 15.
Graph 6: Thermal Efficiency, 12 June 2020 sunny (circular absorber).
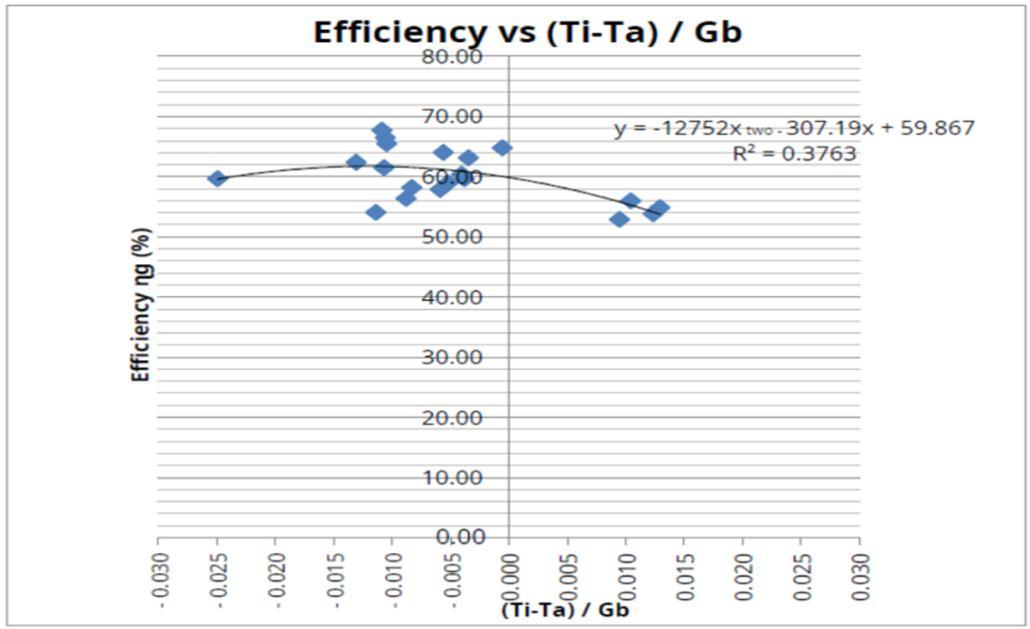
For this climatic condition, the graph produces a quadratic distribution between the thermal efficiency of the collector and the relationship of the inlet temperature minus the ambient temperature on the direct component of the incident radiation in the collector, which shows us, for a sunny day, values of thermal efficiency between 59% and 68%
International Journal for Research in Applied Science & Engineering Technology (IJRASET)

ISSN: 2321 9653; IC Value: 45.98; SJ Impact Factor: 7.538 Volume 10 Issue IX Sep 2022 Available at www.ijraset.com
J. Verification Of The Hypothesis Hypothesis
The use of the circular absorber of the composite parabolic solar collector will allow to achieve higher thermal efficiency than with the conventional flat absorber surface.
Verification
Through the study of the absorber geometry of the composite parabolic solar collector, the thermal efficiency could be determined. To examine the energy stored in the solar collector, equation is expressed as follows:

Constant data: = 0.003 Kg / s Cp = 4180 J / kg ° C Ag = 1.305 m2 The analysis was carried out for three days in different climatic conditions, as shown in Table 16.
Table 4.16: Hypothesis verification (circular absorber).
DAY CLIMATE CONDITION
ACCUMULATED ENERGY Ea (KJ / m2)
USEFUL HEAT how useful(KJ)
INCIDENT HEAT whatincident(KJ) THERMAL EFFICIENCY g[%]
08 19 2020 Cloudy 3,847,058 2951.8533 5020.41038 58.80
07 29 2020 Partly Cloudy 5471,441 5399.2224 7140.23044 75.62
06 12 2020 Sunny 10 156,358 8974.0629 13254.04765 67.71
In a conventional flat absorber surface solar heater built at the FICM UTA, a thermal efficiency of 55.2% was achieved on a sunny day, Toalombo Byron (2011) taking into account the gross area of the collector.
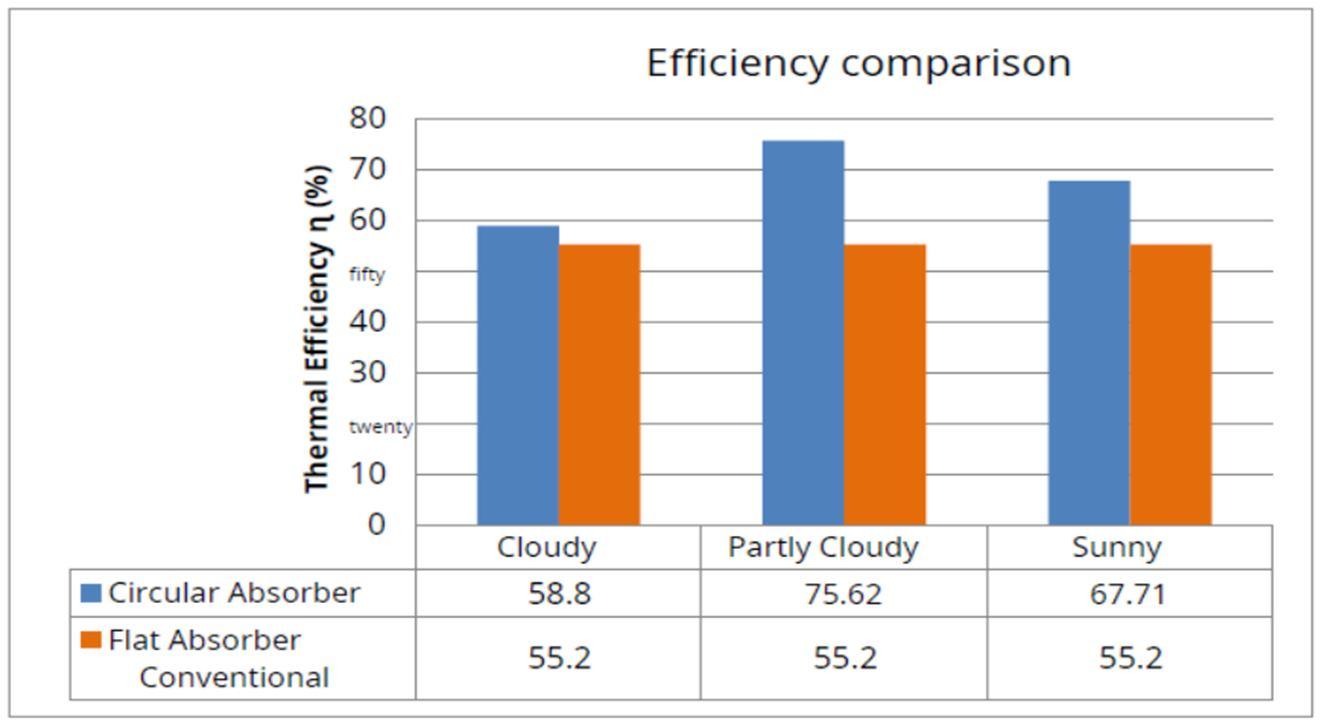
Figure 7 shows the difference in thermal efficiency of a conventional flat absorber surface solar collector and a composite parabolic solar collector with a circular absorber.
Graph 7: Verification of the Hypothesis (circular absorber).

The graph shows that on a sunny day the solar collector with circular absorber exceeds by 12.51% the value of 55.2% of thermal efficiency of the conventional flat absorber surface solar collector; while on a cloudy and cloudy partial day it exceeds this value by 20.42% and 3.6% respectively; with which it can be verified that with the circular absorber of the composite parabolic solar collector it will allow us to achieve greater thermal efficiency than with the conventional flat absorber surface
©IJRASET:
International
Science & Engineering Technology (IJRASET)

ISSN: 2321 9653; IC Value: 45.98; SJ Impact Factor: 7.538 Volume 10 Issue IX Sep 2022 Available at www.ijraset.com
The configuration of the composite parabolic solar collector concentrates radiation through the use of multiple reflections as well as direct interception, in order to have a greater benefit from solar energy which is naturally available and thus be able to guarantee greater thermal efficiency in solar systems.

IV. CONCLUSIONS
The variation in water temperature between the inlet and outlet of the collector was unstable in the test periods, since as this type of collector is a radiation concentrator, it produces instantaneous temperature increases. The water outlet temperatures of the composite parabolic solar collector with the circular absorber exceeded 60 ° C on a sunny day, with a totally clear sky.
On days with little presence of sun, partially cloudy, the outlet temperature of the water from the solar collector was around 50 ° C, and on a cloudy day it reached temperatures higher than 30 ° C.
On days with partially cloudy and sunny weather conditions, the water outlet temperature was within the indicative range of the composite parabolic solar collector, which is 60 ° C to 240 ° C.
The thermal efficiency achieved in the composite parabolic solar collector with the circular absorber reached a value of 67.71% higher by 12.51% than the value of 55.2% of thermal efficiency of the conventional flat surface solar collector for a sunny day. The thermal efficiency in the parabolic solar collector composed with the circular absorber for days, partially cloudy and cloudy were 75.62% and 58.8% respectively, which exceeded the thermal efficiency value of the conventional flat absorber surface solar collector by 20.42% and 3.6%.
REFERENCES
[1] ANSI / ASHRAE 93 1986. Methods of testing to determine the thermal performance of solar collectors. ASHRAE Standard.
[2] Aguayo, D., Velasquez, N., & Ojeda, S. (2009). Development of a solar heating system and coupling to an anaerobic digester. Retrieved on October 11, 2013, from Redisa:http://www.redisa.uji.es
[3] Byron, T. (2011). Study of the solar irradiation spectrum to determine the potential of usable energy in the city of Ambato. "Mechanical Engineering Thesis". UTA, Ambato, Ecuador.
[4] Campuzano, G. and Chiriboga, J. (2010). Design and construction of an adsorption torque cooling system. "Mechanical Engineering Thesis". EPN, Quito, Ecuador.
[5] Carta, J., Calero, R., Colmenar, A., & Castro, M. (2009). Renewable energy plants. Madrid: Pearson Education.
[6] Cengel,Y. (2007). Heat and mass transfer (Fourth ed.). Mexico: Mc.Graw Hill.
[7] Duffie,J., & Beckman, W. (1980). Solar engineering of thermal processes.Wisconsin Madison: Jhon Wiley & Sons, INC.
[8] Echeverría,C. (2011). Design of a composite parabolic trough collector.Retrieved on October 8, 2013, fromhttp://pirhua.udep.edu.pe
[9] Estrada, C., Arancibia, C., Dorantes, R., Islas, J., &Mulhia, I. (2005). Long term vision on the use of renewable energies in Mexico. Retrieved on November 20, 2013, fromhttp://www.sener.gob.mx
[10] Fernandez, F., Ramos, F., Tinaut, D., Rodriguez, M., Díaz, C., Macias, M., and others. (1987). Methodology and calculation of radiation for concentrating collectors. Madrid: Artegraf.
[11] Gutierrez, J. (2010). Design and characterization of a compound parabolic concentrator. Retrieved on September 10, 2013, fromhttp://www.perusolar.org
[12] InstituteEcuadorian Standardization Inen 2 507: 2009. Thermal performance of solar collectors in water heating systems for sanitary use. Requirements. Quito, Ecuador: INEN.
[13] Jaramillo, A. (2012). Solar concentration and heat from industrial processes_22_FEB_2012. Retrieved on December 5, 2014, fromhttp://www.cie.unam.mx

