
10 IX September 2022 https://doi.org/10.22214/ijraset.2022.46333
ISSN: 2321 9653; IC Value: 45.98; SJ Impact Factor: 7.538 Volume 10 Issue IX Sep 2022 Available at www.ijraset.com

ISSN: 2321 9653; IC Value: 45.98; SJ Impact Factor: 7.538 Volume 10 Issue IX Sep 2022 Available at www.ijraset.com
Ceramic Laboratory, Department of physics, Jai Narain Vyas University, Jodhpur 342001(Raj) India

Abstract: Glass of the system: (40 x) P2O5:10ZnO:10Li2O:10CdO:10MgO:20B2O3: xDy2O3. (where x=1, 1.5,2 mol %) have been prepared by melt quenching method (where x=1,1.5 and 2 mol%) have been prepared by melt quenching technique. The amorphous nature of the prepared glass samples was confirmed by X-ray diffraction. Optical absorption, Excitation, fluorescence and FTIR spectra have been recorded at room temperature for all glass samples. Judd Ofelt intensity parameters Ωλ (λ=2, 4 and 6) are evaluated from the intensities of various absorption bands of optical absorption spectra. Using these intensity parameters various radiative properties like spontaneous emission probability, branching ratio, radiative life time and stimulated emission cross section of various emission lines have been evaluated.
Keywords: ZLCMBP Glasses, Optical Properties, Judd Ofelt Theory, Transmittance Properties
Glasses are receiving considerable attention due to their potential application in optical devices such as frequency conversion materials, laser action and optical fiber amplifiers [1 5]. Among different host matrices, phosphate glasses have wide range of applications in the field of glass ceramics, with the advantages such as low non linear refractive index, good physical and chemical stability and high transparency from near Ultra Violet to mid Infrared region [6 10]. Phosphate glasses have relatively low phonon energy and exhibit better environment resistance.
Additionally, such glasses are characterized by a high capacity for dissolving rare earth elements. The chemical resistance and transparence of phosphate glasses were investigated to obtain glasses with optical transparency. These glasses are also stable [11]. Recently, glass ceramics containing dysprosium oxides have been found in applications for several different purposes. Dy3+ doped glasses have attracted much interest due to their important optical properties used in lasers, optical amplifiers, photonic devices and as infrared sensors [12 15].
The present work reports on the preparation and characterization of rare earth doped heavy metal oxide (HMO) glass systems for lasing materials. I have studied on the absorption and emission properties of Dy3+ doped zinc lithium cadmium magnesium borophosphate glasses. The intensities of the transitions for the rare earth ions have been estimated successfully using the Judd Ofelt theory, The laser parameters such as radiative probabilities(A),branching ratio (β), radiative life time(τR) and stimulated emission cross section(σp) are evaluated using J.O.intensity parameters( Ωλ, λ=2,4 and 6)
The following Dy3+doped phosphate glass samples (40 x) P2O5:10 ZnO: 10Li2O:10 CdO: 10MgO: 20B2O3: xDy2O3 (where x=1, 1.5 and 2 mol %) have been prepared by melt quenching method. Analytical reagent grade chemical used in the present study consist of P2O5, ZnO, Li2O, CdO, MgO, B2O3 and Dy2O3. They were thoroughly mixed by using an agate pestle mortar. then melted at 10520C by an electrical muffle furnace for 2h., After complete melting, the melts were quickly poured in to a preheated stainless steel mould and annealed at temperature of 2500C for 2h to remove thermal strains and stresses. Every time fine powder of cerium oxide was used for polishing the samples. The glass samples so prepared were of good optical quality and were transparent. The chemical compositions of the glasses with the name of samples are summarized in Table 1.

International Journal for Research in Applied Science & Engineering Technology (IJRASET)
ISSN: 2321 9653; IC Value: 45.98; SJ Impact Factor: 7.538
Volume 10 Issue IX Sep 2022 Available at www.ijraset.com
Table 1.
Sample Glass composition (mol %)
ZLCMBP (UD) 40 P2O5:10ZnO:10Li2O:10CdO:10MgO:20B2O3
ZLCMBP (DY1) 39 P2O5:10ZnO:10Li2O:10 CdO: 10 MgO: 20 B2O3: 1 Dy2O3.
ZLCMBP (DY1.5) 38.5P2O5:10ZnO:10Li2O:10 CdO: 10 MgO: 20 B2O3: 1.5 Dy2O3
ZLCMBP (DY2) 38 P2O5:10ZnO:10Li2O:10 CdO: 10 MgO: 20 B2O3: 2 Dy2O3. ZLCMBP (UD) Represents undoped Zinc Lithium Cadmium Magnesium Borophosphate glass specimen ZLCMBP (DY) Represents Dy3+ doped Zinc Lithium Cadmium Magnesium Borophosphate glass specimens
The intensity of spectral lines are expressed in terms of oscillator strengths using the relation [16]. fexpt. = 4.318 ×10 9∫ε (ν) d ν (1)
where, ε (ν) is molar absorption coefficient at a given energy ν (cm 1), to be evaluated from Beer Lambert law.
Under Gaussian Approximation, using Beer Lambert law, the observed oscillator strengths of the absorption bands have been experimentally calculated [17], using the modified relation:
Pm=4.6 ×10 9× cl 1 log I I0 ×Δυ1/2 (2)
where c is the molar concentration of the absorbing ion per unit volume, I is the optical path length, logI0/I is optical density and Δυ1/2 is half band width.
According to Judd [18] and Ofelt [19] theory, independently derived expression for the oscillator strength of the induced forced electric dipole transitions between an initial J manifold │4fN (S, L) J> level and the terminal J’ manifold │4fN (S', L') J'> is given by:
the line strength S (J, J') is given by the equation
J')
In the above equation m is the mass of an electron,
is the velocity of light,
is the wave number of the transition, h is Planck’s constant, n is the refractive index, J and J' are the total angular momentum of the initial and final level respectively,
(λ=2,4and 6) are known as Judd Ofelt intensity parameters.
The
parameters obtained using the absorption spectral results have been used to predict radiative properties such as spontaneous emission probability (A) and radiative life time (τR), and laser parameters like fluorescence branching ratio (βR) and stimulated emission cross section (σp). The spontaneous emission probability from initial manifold │4fN (S', L') J'> to a final manifold │4fN (S, L) J >| is given by:
(J',
SJ Impact Factor 7.538 | ISRA Journal Impact Factor 7.894 |
& Engineering Technology (IJRASET
ISSN: 2321 9653; IC Value: 45.98; SJ Impact Factor: 7.538 Volume 10 Issue IX Sep 2022 Available at www.ijraset.com
The fluorescence branching ratio for the transitions originating from a specific initial manifold
N (S', L') J'> to a final many fold│4fN (S, L) J > is given by
where, the sum is over all terminal manifolds. The radiative life time is given by
where, the sum is over all possible terminal manifolds. The stimulated emission cross section for a transition from an initial manifold │4f N (S', L') J'> to a final manifold │4fN (S, L) J >| is expressed as
where, the peak fluorescence wavelength of the emission band and Δ is the effective fluorescence line width.
Figure 1 presents the XRD pattern of the sample contain P2O5 which is show no sharp Bragg’s peak, but onlya broad diffuse hump around low angle region. This is the clear indication of amorphous nature within the resolution limit of XRD instrument
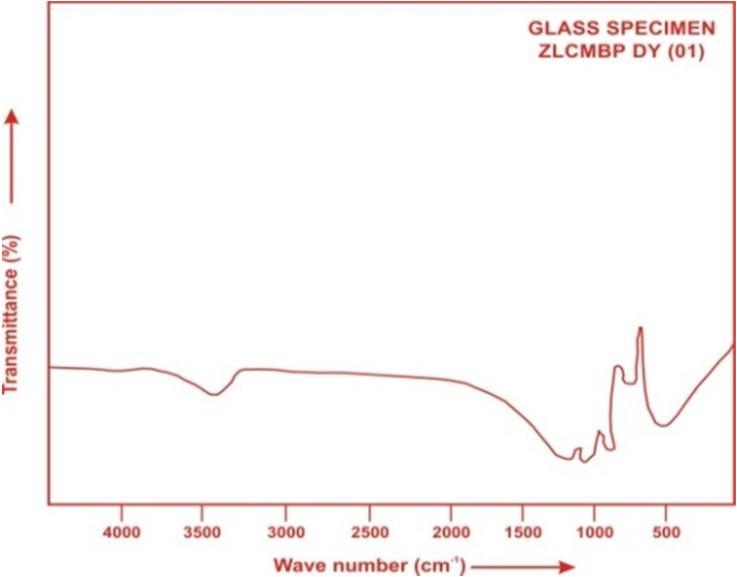
The FTIR spectrum of ZLCMBP (DY 01) glass is in the wave number range500 2500 cm 1 is presented in Fig.2 and the possible mechanism bands are tabulated in Table 2.
Fig. (2) FTIR spectrum of ZLCMBP DY (01) glass.
Factor
Factor
International Journal for Research in Applied Science & Engineering Technology (IJRASET)
ISSN: 2321 9653; IC Value: 45.98; SJ Impact Factor: 7.538
Volume 10 Issue IX Sep 2022 Available at www.ijraset.com
The band observed at 525 cm −1 is attributed to the P O P bending vibrations [20]. The observed band around at 750 cm 1 is due to the P O P symmetric stretching vibrations while the occurrence of band around 925 cm 1 is assigned to the P O P asymmetric stretching vibrations [21, 22]. The Asymmetric stretching modes of (PO3)2 groups is observed around 1110 cm 1[23]. The Asymmetric stretching vibration of P=O and O P O bonds is observed around 1234 cm 1[24]. The observed band around at 3425 cm 1 is attributed to symmetric stretching vibrations of the O H bonds [25].
Table2. Assignment of infrared transmission bands of (ZLCMBP DY 01) glass.
Peak position(cm 1 )
Bending vibration of P O P bands ~750
~ 525
Symmetric stretching vibration of P O P bonds ~925
Asymmetric stretching vibration of P O P bonds ~1110
Asymmetric stretching modes of (PO3)2 groups 1234
Asymmertic Stretching Vibration of P=O and O P O bonds ~3425
Symmetric stretching of the O H bonds
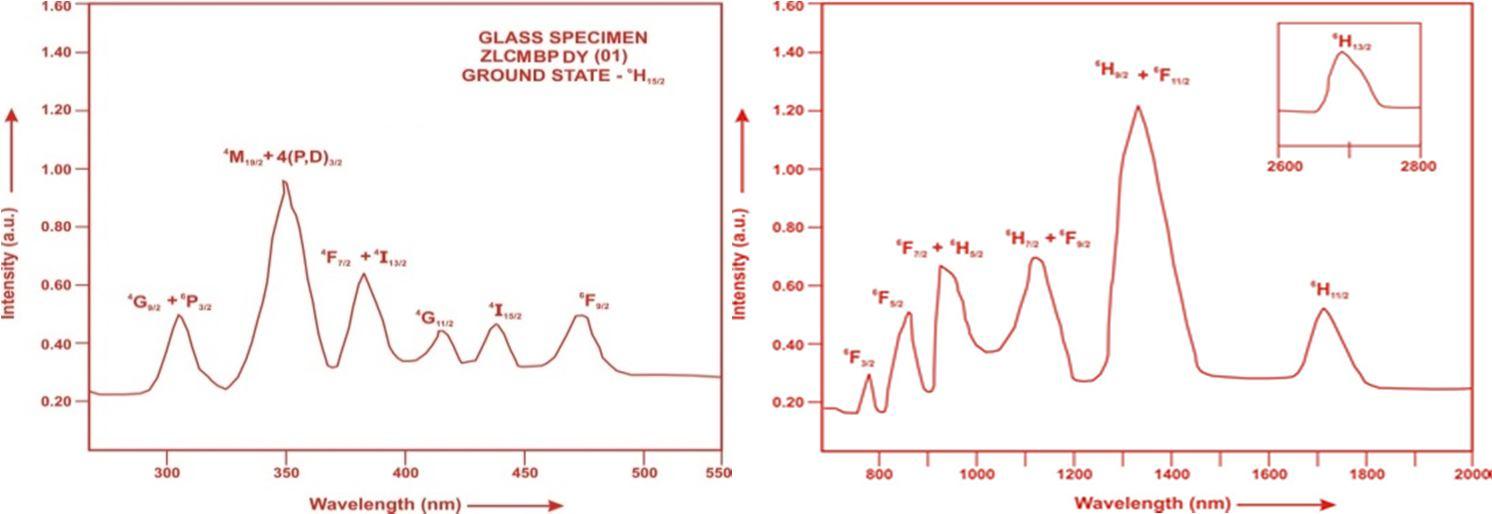
The absorption spectra of Dy3+doped ZLCMBP glass specimens have been presented in Figure 3 in terms of Intensity versus wavelength Thirteen absorption bands have been observed from the ground state 6H15/2 to excited states 6H13/2, 6H11/2,
for Dy
doped ZLCMBP glasses.
Fig. (3) Absorption spectrum of ZLCMBP DY (01) glass
The experimental and calculated oscillator strength for Dy3+ ions in ZLCMBP glasses are given in Table 3.
Table 3: Measured and calculated oscillator strength (Pm×10+6) of Dy3+ions in ZLCMBP glasses.
Energy level from
Glass ZLCMBP (DY01) Glass ZLCMBP (DY1.5) Glass ZLCMBP (DY02) Pexp Pcal Pexp Pcal Pexp Pcal
2.02 2.37 2.00 2.34 1.98 2.35
1.38 1.96 1.36 1.94 1.33 1.92
10.10 10.19 10.08 10.17 10.06
5.52 5.21 5.50 5.19 5.47 5.16
4.67 3.67 4.65 3.64 4.63 3.60
1.28 1.64 1.27 1.62 1.25 1.60
0.27 0.31 0.26 0.31 0.24 0.30
0.31 0.28 0.30 0.28 0.28 0.27
0.29 0.68 0.28 0.67 0.26 0.66
0.21 0.17 0.20 0.17 0.19 0.17
3.38 3.60 3.35 3.35
7.91 10.01 7.89 10.00
1.58
1.56 2.02 1.53 2.00
0.70697 0.71054 0.71763
Factor
Impact Factor 7.894 |
International Journal for Research in Applied Science & Engineering Technology (IJRASET
ISSN: 2321 9653; IC Value: 45.98; SJ Impact Factor: 7.538 Volume 10 Issue IX Sep 2022 Available at www.ijraset.com
In the Zinc Lithium Cadmium Magnesium Borophosphate glasses
and
parameters decrease with the increase of x from 1 to 2 mol%. The order of magnitude of Judd Ofelt intensity parameters is
for all the glass specimens. The spectroscopic quality factor (Ω
/Ω
) related with the rigidity of the glass system has been found to lie between 1.247 and 1.287 in the present glasses.
The values of Judd Ofelt intensity parameters are given in Table 4.
Table 4: Judd Ofelt intensity parameters for
ZLCMBP glass specimens. Glass Specimen
Ref.
ZLCMBP (DY01) 2.801 1.711 1.372 1.247 P.W. ZLCMBP (DY1.5) 2.790 1.714 1.355 1.265 P.W. ZLCMBP (DY02) 2.779 1.720 1.336 1.287 P.W. NSGP(DY) 12.38 6.31 3.20 1.972 [26]
ZP(DY) 2.483 0.950 0.673 1.412 [27]
LLPNBP(SM) 5.152 4.553 4.198 1.085 [28]
LLCTMBB(DY) 2.457 1.471 1.116 1.318 [29]
ZLCBP(SM) 4.599 4.096 3.813 1.074 [30]
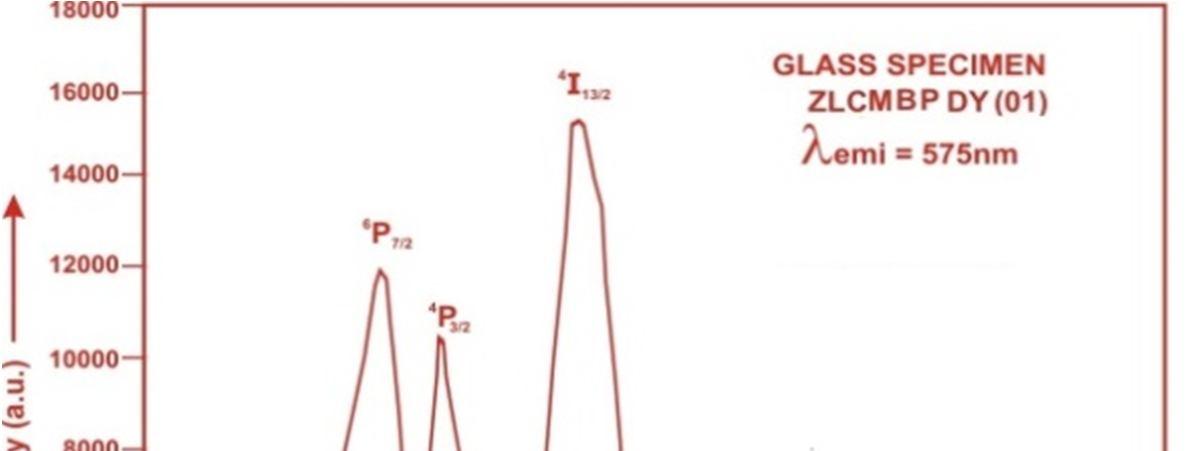
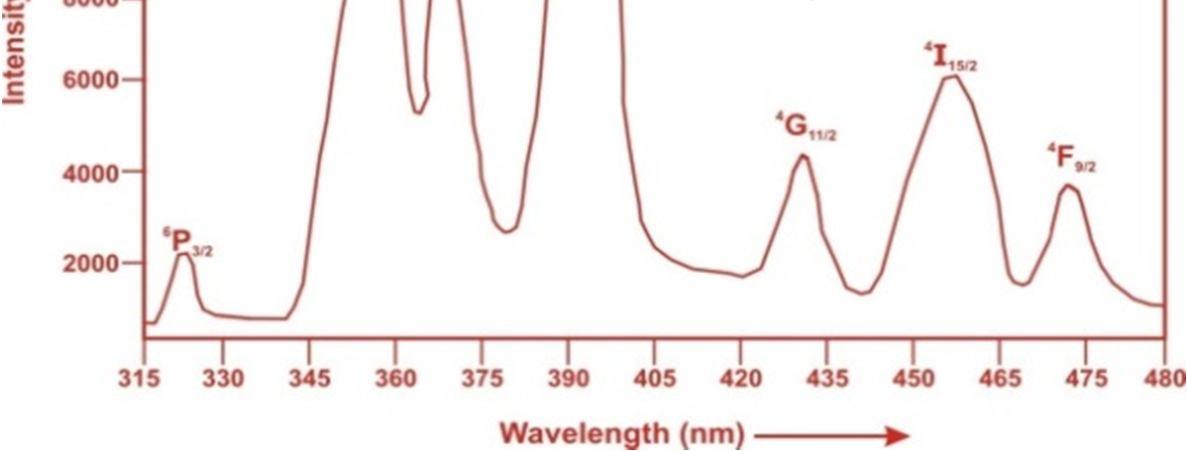
The Excitation spectra of Dy3+doped ZLCMBP glass specimen has been presented in Figure 4 in terms of Excitation Intensity versus wavelength. The excitation spectrum was recorded in the spectral region 315 465 nm fluorescence at 575nm having different excitation band centered at 322,353, 365, 385, 425, 454 and 473 nm are attributed to the 6P3/2, 6P7/2, 4P3/2, 4I13/2, 4G11/2, 4I15/2 and 4F9/2 transitions, respectively. The highest absorption level is 4I13/2 and is at 385nm.So this is to be chosen for excitation wavelength.
Fig. (4) Excitation spectrum of ZLCMBP DY (01) glass.
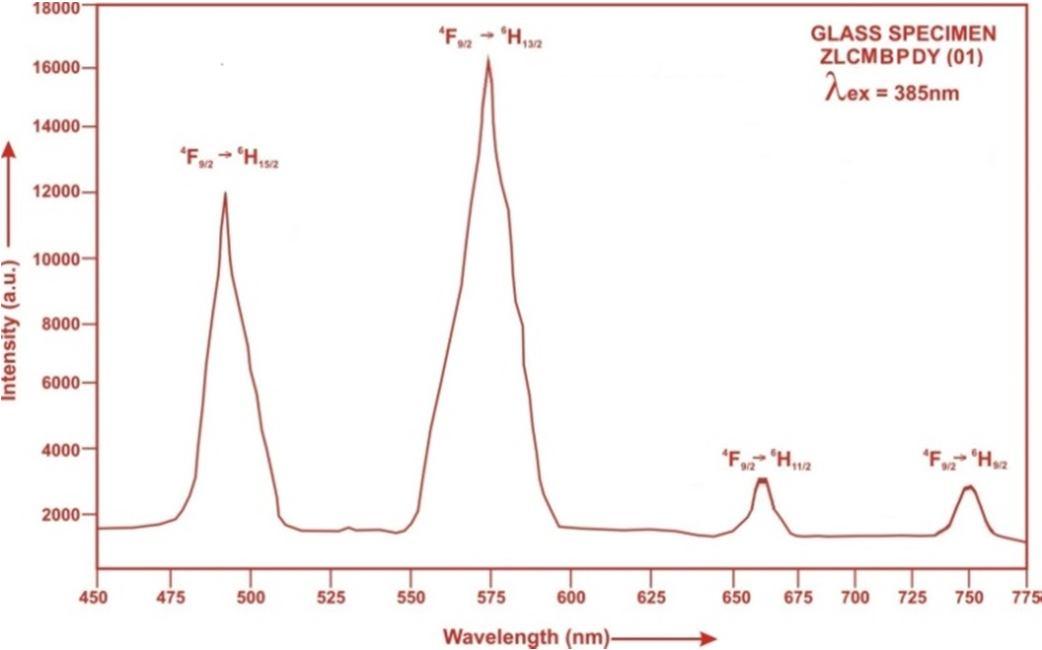
The Fluorescence spectrum of Dy3+doped in Zinc Lithium Cadmium Magnesium Borophosphate glass is shown in Figure 5. There are four broad bands observed in the Fluorescence spectrum of Dy3+doped Zinc Lithium Cadmium Magnesium Borophosphate glass. The wavelengths of these bands along with their assignments are given in Table 4. The peak with maximum emission intensity appears at 485nm, 575 nm, 665 nm and 752 nm corresponds to the (4F9/2
6H
),
F
H
4F9/2
Factor
Factor
H11/2
and (4F9/2→ 6H9/2) transition.
273.64 0.6753 1.239 272.57 0.6759 1.212 271.56 0.6764 1.185
28.93 0.0714 0.145 28.86 0.0716 0.143 28.78 0.0717 0.141
22.91 0.0565 0.136 22.86 0.0567 0.134 22.82 0.0568 0.133
In the present study, the glass samples of composition (40 x) P2O5:10ZnO:10Li2O:10CdO:10MgO:20B2O3 : xDy2O3 (where x =1, 1.5and 2mol %) have been prepared by melt quenching method. The value of stimulated emission cross section (σp) is found to be maximum for the transition (4F9/2→ 6H13/2) for all glass specimens. This shows that (4F9/2→ 6H13/2) transition is most probable transition. ). The FTIR of glasses revealed the presence of characteristic bonding vibrations of different functional groups.
[1] Priyanka, R., Arunkumar, S., Basavapoornima, Ch., Mathelane, R.M. and Marimuthu, K.(2020). Structural and spectroscopic investigations on Eu3+ ions doped boro phosphate glasses for optical display applications. J. Lumin. 220, 116964.
[2] Doerenkamp, C.,Carvajal, E., Magon, C.J., Faria, W.J.G.J., Pedro Donoso, J., Galvão Gobato, Y., de Camargo, A.S.S. and Eckert, H.(2019). Composition−structure−property correlations in rare earth doped heavy metal oxyfluoride glasses. J. Phys. Chem. C, 123, 22478 22490.
[3] Seshadri, M., Radha, M., Barbosa, C., Cordeiro, C.M.B. and Ratnaka, Y.C.(2015). Effect of ZnO on spectroscopic properties of Sm3+ doped zinc phosphate glasses,Physica B: Condensed matter 459, 79 87.
[4] Vighnesh, K.R., Ramya, B., Nimitha, S., Wagh,A., Sayyed, M.I., Sakar, E., Yakout, H.A. and Dahshan, A. (2020).Structural, optical, thermal, mechanical, morphological and radiation shielding parameters of Pr doped ZAIFB glass systems, optical materials 99,109512.
[5] Sontakke, Atul D., and Annapurna, K. (2013).Spectroscopic properties and concentration effects on luminescence behavior of Nd3+ doped Zinc Boro Bismuthate glasses, Mater. Chemi. Phys. 137, 916 921.
[6] Rai, V.N., Raja Sekhar, B.N., Tiwari, P., Kshirsagar, R.J. and Deb, S.K. (2011).Spectroscopic studies of gama irradiated Nd3+ doped phosphate Glasses, Journal of Non crystalline soilds, 3757 3764.
[7] Chowdhury,S., Mandal, P., and Ghosh, S.(2019). Structural properties of Er3+ doped lead zinc phosphate glasses, Mat. Sci. and Eng.,240,116 120.
[8] Yu, X., Duan, L., Ni, L. and Wang, Z. (2012).Fabrication and luminescence behavior of phosphate glass ceramics co doped with Er3+ and Yb3+, Opt. Commun. 285, 3805 3808.
[9] Milankovic, A.M., Gajovic, A. and Day, D.E. (2003).Spectroscopic investigation of MoO3 Fe2O3 P2O5 and SrO Fe2O3 P2O5 glasses. J of Non Crystalline Solids. 325:76 84.
Journal for Research in Applied Science & Engineering Technology (IJRASET)
ISSN: 2321 9653; IC Value: 45.98; SJ Impact Factor: 7.538
Volume 10 Issue IX Sep 2022 Available at www.ijraset.com
[10] Jiang, S., Myers, M. and Peyghambarian, N. (1998).Er3+ doped phosphate glasses and lasers. J. Non Cryst. Solids, 239, 143 148.
[11] Aranha, N. (1994). Aranha. Niobium Phosphate Glasses: Preparation, Characterization, and Properties, PhD thesis, Unicamp.
[12] Arul Rayappan, I., Maheshvaran, K., SurendraBabu, S. and Marimuthu, K. (2012).Dysprosium doped lead fluoroborate glasses: Structural, optical, and thermal investigations, Phys. Status solid A., 209, 570 578.
[13] Linganna, K., Rao, C.S. and Jayasankar, C.K. (2013).Optical properties and generation of white light in Dy3+ doped lead phosphate glasses, Journal of Quantitative Spectroscopy and Radiative Transfer,118,40 48.
[14] Pawar, P.P., Munishwar, S.R. and Gedam, R.S. (2017). Intense white light luminescent Dy3+ doped lithium borate glasses for WLED: a correlation between physical, thermal, structural and optical properties. Solid State Sci., 64, 41 50.
[15] Pisarski, W.A., Zur, L. and Pisarska, J. (2011).Optical transitions of Eu3+ and Dy3+ ions in lead phosphate glasses. Opt. Lett., 36, 990 992.
[16] Gorller Walrand, C. and Binnemans, K. (1988). Spectral Intensities of f f Transition. In: Gshneidner Jr., K.A. and Eyring,L., Eds., Handbook on the Physics and Chemistry of Rare Earths, Vol. 25, Chap. 167, North Holland, Amsterdam, 101 264.
[17] Sharma, Y.K., Surana, S.S.L. and Singh, R.K. (2009). Spectroscopic Investigations and Luminescence Spectra of Sm3+ Doped Soda Lime Silicate Glasses. Journal of Rare Earths, 27, 773.
[18] Judd, B.R. (1962). Optical Absorption Intensities of Rare Earth Ions. Physical Review, 127, 750.
[19] Ofelt, G.S. (1962). Intensities of Crystal Spectra of Rare Earth Ions. The Journal of Chemical Physics, 37, 511.
[20] Jha, P.K.,Pandey,O.P.,Singh,K.(2015).FTIR spectral analysis and mechanical properties of sodium phosphate glass ceramics,J.Mol.Struct.,1083,278 285.
[21] Pavia,D.L.,Lampman,G.M.,Kriz,G.S. and Vyvyan James(2009). Introduction to Spectroscopy, fourth eds., Books/Cole,Cengage Learning,USA.
[22] Meyer,K.(1998).Characterization of the structure of binary zinc ultraphosphate glasses by infrared and Raman spectroscopy, J.Non Cryst.,Solids ,209,227 239.
[23] Le,Q.H.,Palenta,T.,Benzine,O.,Griebenow,K.,Limbach,R.,Kamitsos,E.I.,Wondraczek,L.(2017).Formation,structure and properties of fluoro sulfo phosphate polyanionic glasses,J.Non Cryst.Solids,477,58 72.
[24] Waclaawska, I.,Szumera,M. and Sulowska, J.(2016).Structural characterization of zinc modified glasses from the SiO2 P2O5 K2O CaO MgO system,J.Alloys Compd.666,352 358.
[25] Han,L.,Zhang,J.,Song,Z.I.,Xiao,Y.C.,Qiang,Y.C.,Ye,X.Y.,You,W.X. and Lu,A.X.(2020).A novel Eu3+ doped phosphate glass for reddish orange emission:preparation,structure and fluorescence properties, J. Lumin.,221,117041.[3430].
[26] Shoib,M.,Chanthima,N.,Rooh,G.,Rajaramakrishna,R. and Kaewkhao,J.(2019).Physical and luminescence properties of rare earth doped phosphate glasses for solid state lighting applications,Thai Int.Res.,14(3),20 26.
[27] Chandrasekhar,A.V.,Radhapathy,A.,Reddy,B.J.,Reddy,Y.P.,Ramamoorthy,L. and KumarRavi, R.V.S.S.N.(2003). Optical absorption spectrum of dysprosium zinc phosphate glass,Opt.Mat.,22,215 220.
[28] Meena, S.L. (2021).Spectral and Raman analysis of Sm3+ions doped lead lithium potessiumniobate borophosphate glasses.
[29] Meena, S.L. (2020).Spectroscopic properties of Dy3+ doped lead lithium cadmium tantalum magnesium bismuth borate glasses,Int.J.of Chem. And Phy.Sci., 9(1),5 12.
[30] Meena,S.L.(2021).Spectral and Raman analysis of Sm3+ ions doped zinc lithium cadmium borophosphate glasses, Int.J.in Phy. And App. Sci.,8(4),7 15.
Factor