

Security Monitoring for Multi-Cloud Native Network ServiceBased Functions
Sandhya G1 , Dr H S Guruprasad2
1Student, Information Science Department, BMS College of Engineering
2Proffessor, Information Science Department, BMS College of Engineering

Abstract: Nowadays, enterprises are adopting a cloud native to provide rapid change, large scale, and resilience in their application. The applications were built as independent services and packaged as self contained, lightweight containers.And in order to provide leading applications, better performance, and avoid getting locked into a particular cloud provider's infrastructure. They choose to deploy a cloud-native application on a multi-cloud Infrastructure. While this native multi-cloud strategy has many benefits, it definitely adds more management complexity. We have proposed a framework by creating an abstraction layer that provides security and visibility across these multi cloud services. We have visualized the metrics like request per second, status code, bandwidth, andlatencies of two sample API services (Users, and Products) which are publicly available and deployed on Google cloudfunction and on a CloudFlare. Keywords: Cloud Native, Multi cloud, Kong Gateway, APIMicroServices.
I. INTRODUCTION
Traditionally the applications were deployed as monolithic applications that were built as a single, unified, and discrete entity. This approach was once thought to be an industry standard. Adopting this approach has seen a significant decline because of the number of challenges like managing alarge codebase and lack of flexibility to quickly adopt new technologies. With this approach, the overall development process is much longer because modifying or adding functionalityto the application mayaffect the behavior of theentire application. With the microservices architecture this limitations can be overcome. In microservices architecture each application is built as independent functional units. Through APIs they communicate with each other and without interfering the overall structure each units can be modified individually [1]. To maximize the performance and to embrace rapid change, large scale, and resilience of microservices it is integrated as a cloud native. Applications may be created and executed in dynamic settings including public, private, and hybrid clouds thanks to cloud native technology. This strategy is demonstrated by microservices, containers, immutable infrastructure, and APIs. These technologies enable resilient,manageable, and observable loosely coupled systems. And allows making high impact changes with robust automation. To build modern application and infrastructure practices the cloud native is very helpful. It helps the organization to bring their application online quickly. And on demand allows adapting to rapidly changing marketplace requirements. Cloud native is just not a technology where a service is running on a public cloud but it is a philosophy of building application that takes the advantage of the immutable infrastructure. Traditional application to run without failure there as to be necessary resources and it hasto be installed on an operating system with correct drivers, and system configuration. In cloud native, the application interacts directly with the cloud or infrastructure to dictate itsenvironment via API. Compare to traditional applications which are installed on an OS or server, cloud native applications run on a cloud infrastructure [2]. Where each unit of microservices is containerized anddeployed in a cloud. Which is a binary of packaged code, its dependencies, and runtime. The container image acts as a repository or library for images which are stored in a container registry [2]. Containerizing each unit makes the application to run independently of the underlying infrastructure. And we can easily decouple hardware and software components [1]. As we move our application to the cloud we rely on the cloud providers, and it will be more difficult to move away from them as companies use these vendors more and more. With the use of a multi cloud strategy, the systems and storage spread out across multiple vendors. If we migrate from one vendor during the migrationthe majority of infrastructure still remains in place. And one cloud could be used as back to another cloud so that itprovides reliability to an application [3]. There are also some cons to using this approach since we are deploying our application on a multi cloud with several different vendors, and it is harder to provide visibility across many processes running in multiple clouds. Depending on how the clouds are integrated, how far the data centers are there, and how often multiple clouds interact with each othercan introduces latency. Integration of more pieces of software and hardware greater will be the attack surface. Andif the data centers are far apart it will be difficult to balance loads [3].

(IJRASET
ISSN: 2321 9653; IC Value: 45.98; SJ Impact Factor: 7.538 Volume 10 Issue IX Sep 2022 Available at www.ijraset.com

II. REVIEW OFLITERATURE
There are some frameworks like Amazon CloudWatch[4], Azure Monitor [5] that are platform specific and can only monitor the platforms for which they were designed, for example, Amazon CloudWatch can only monitor the servicesthat are installed in the Amazon cloud environment, not the Azure cloud environment.
SAMAN Barakat [6], tried to monitor and anyalyze the existing microservice based application performance. For building the microservice a Jolie an open source programming language have been used. And the Spring framework, PLAY framework have been used to implement the application. Kieker framework which is developed in Java under the Apache License Version 2.0 has been used for monitoring and Kieker's trace analysis tools have been used for analysis of the application. The performance of each method in the microservice is visualized in the deployment operation dependencygraph. A general M3 monitoring system is developed and deployedacross heterogeneous virtualization platforms to track the performance of microservices. The system contains two agents in that, Monitoring agents that keep tabs on the performance of the underlying microservices installed withineach container or virtual machine. Monitoring agents gather each service's system level statistics and communicate these data to the manager. The manager has been installed on a separate server, gathers data from various monitoring agents,which is then stored in the related database for additional performance analysis [7].
Another approach of monitoring microservice using the SYMBIOTE technique. The approach gathers coupling metrics at runtime and keeps track of them as software evolves. A longitudinal study of the measured data was doneto look for a trend in the metric. The proposed method was developed by an experimental analysis of the coupling metrics behaviour using deliberately fabricated data. Theexperiment's results demonstrated how the metrics reacted invarious scenarios, providing information for developing an analysis method for identifying architectural degradation. [8].
In microservice, unauthorized access, and sensitive data exposure are the most addressed threats. The security mechanism includes adding a specific module in architectureto handle the authorization, new algorithms to detect the threats, and implementing a developed tool for security measures. When the microservices are deployed on a different cloud platform the validation and verification are done by analyzing the performance. To avoid future threats continuous monitoring of a microservice is important [9].


III. PROPOSED WORK
As many organizations are embracing a multi cloud architecture that makes up a system to sprawl across multi cloud providers and multiple availability zones. Our approach brings greater visibility across multi cloud Native services and unifies the services sprawled across multiple clouds. The proposed system is to create an abstraction layerusing a Kong Gateway. A Kong is known as API Gateway which is an Orchestration Microservice API Gateway. It securely manages communication between clients and microservices through API. And it is open source with high performance and extensibility.

International
in Applied Science & Engineering Technology (IJRASET)

ISSN: 2321 9653; IC Value: 45.98; SJ Impact Factor: 7.538
Volume 10 Issue IX Sep 2022 Available at www.ijraset.com
In Fig.1 the system contains a Kong Gateway that sits between the client and services deployed across multi cloud infrastructures like GCP, Azure, AWS, etc… Kong Gatewayacts as a proxy for the cloud native services. It routes the incoming client requests to the relevant services by exposingpublic facing API endpoints. Kong gateway is easier to use and provides a clean interface for clients to interact with.
Kong gateway before proxying the requests to the upstream services provides additional functionality to the underlying APIs. All the requests are processed by the kong server built on top of NGINX.
A. Kong Typically Listens on These Ports
Kong waits for incoming HTTP traffic from clients on port 8000 and routes it to upstream services. On 8443 port is similar to the behavior of 8000 port but 8443 port only expects HTTPS traffic. In the kong.conf configuration file can be disabled.
Kong provides an Admin API on the 8001 port which is usedto configure listens. For HTTPS Kong provides an Admin API on port 8444.
Kong has two persistence models, Kong DB Less Mode and Kong DB Mode. Kong db mode persists all the configurations in a DB with a Cassandra / PostgreSQL. Kong db less mode reduces the complexity and provides more flexible deployment patterns. In this method, aconfiguration file is used to load and manage the whole setupin memory. This will allow for horizontal scaling and is compatible with pipelines for continuous delivery and deployment.
B. Configuring a Upstream Services
An upstream object is an API or service that is located behind Kong Gateway and to which client queries are routed.An Upstream Object in Kong Gateway is a virtual hostname that can be used to circuit break, health check, and load balance incoming requests across many services (targets). We have used services that are publicly available through REST API and deployed in the Google cloud and Cloudflareplatform to conduct the experiment.
Users Service: Users service is built with Node.js and Express, and is publicly available. The service has two GET endpoints and one POST endpoint. And these service isdeployed in GCP Cloud Functions.
Product Service: This is a simple e commerce web service built with Node.js (Express) which is publicly available through REST API. It returns Pseudo real data and the service is deployed in Cloudflare.
In order to start making requests through the kong gateway, we should configure both service and route. A Service represents an external microservice or API. The URL, wherethe service listens for requests, is the primary attribute of the service. To specify a URL, you can either use a single string or separately specify the protocol, host, port, and path. We must first add a Route to the Service before we can start sending it requests. After requests reach Kong Gateway,routes control how (and if) they are routed to respective Services. One Service mayhave several Routes.
In our case, we have created a service that points to the API’s of Users and Product Service. In the kong.yaml file wewill define both the Service with the name Users_Service and Product_Service with their respective URL. Under the services section, we have added a route with the route name and the path. We can verify the user service is added to the kong gateway using the RESTful Admin API on port 8001. To verify the route request is forwarded to users service by default kong gateway handles a proxy request on port 8000. At port 8000 we will check all themethods areworking fine.
C. Basic Authentication to a Service

To a service, we are adding a basic authentication with a username and password. Kong provides a basic authentication plugin that checks for valid credentials in the Proxy Authorization and Authorization headers. Before configuring the plugin, we need to add a consumerand basic authentication credentials i.e. username, and password. After the plugin configuration as guided in the official documentation then we start our kong gateway. When we access the kong gateway service endpoint the pop up window will open asking for a username and password. We can also pass a base64 encoding of username: password. If we pass without authorization header it will through a message stating unauthorized.
D. IP Limitation
Kong offers an IP Restriction plugin to limit access to a service or a route. By permitting or prohibiting IP addresses, the IP Restriction plugin will limit access to a service or a route. In CIDR notation, we can offer single IP addresses, groups of IP addresses, or ranges like 10.10.10.0/24.Bot Detection
ISSN: 2321 9653; IC Value: 45.98; SJ Impact Factor: 7.538 Volume 10 Issue IX Sep 2022 Available at www.ijraset.com

A bot like Search Engine Spiders which is a Web Scraper helpful for online businesses to drive relevant traffic to the organization’s website by collecting relevant information like alt tags, product pricing, and headlines to recommend a site in the search engine results pages.
On the other hand, unlike these good bots, there are some programmed bad bots that are intended to harm a business. For example, In a business in order to direct potential buyers, a rival may deploy scraper bots to check the rate prices. So it is necessary for an organization to allow/deny bots according to their business requirements. Kong provides thisability by providing a bot detection plugin. The official documentation provides a link to some popular bot’s regular expressions. We can use this regular expression to allow/denya bot to our configuration file.
E. Security Monitoring the Service
There will always be more services running in the background in business applications. The entire programme will cease working if even one of the services fails. In a multi cloud system, it will be more challenging to find a problematic service. Therefore, even after installingprotection, it is crucial to keep an eye on the services. To keep track of upstream services and API, the sophisticated tools offered by Kong include moesif API Analytics, Datadog, Prometheus, and SignalFx. We choose Prometheus,an open source technology, for our project. As a basic analytics and monitoring plugin, Prometheus is accessible. These plugins provide metrics in an exposition format for Kong and upstream services, which a Prometheus Server then scrapes. After the configuration, the metrics tracked by the plugin will be available at the http://localhost:<port>/metrics endpoint of both the Admin API and Status API. At the node level, the plugin records and exposes the metrics. The Prometheus server will identifyall Kong nodes via the service discovery protocol and then ingest data from each node. Further metrics can be visualizedin the Grafana Dashboard. Kong provides a “Kong Official” dashboard which can be directlyimported to a Grafana.
IV. RESULTS AND DISCUSSION
To carry out the test, we sent the first two requests to Users Service and Product Service to the endpoints of /users and /products of kong gateway port 8000.
Fig. 2. Response getting from the /users endpoint.

As the above response is ok and to get some alterations inthe response. We have sent a request as shown in Fig. 3 withno credentials after running the Kong Gateway with a Basic Authentication plugin.

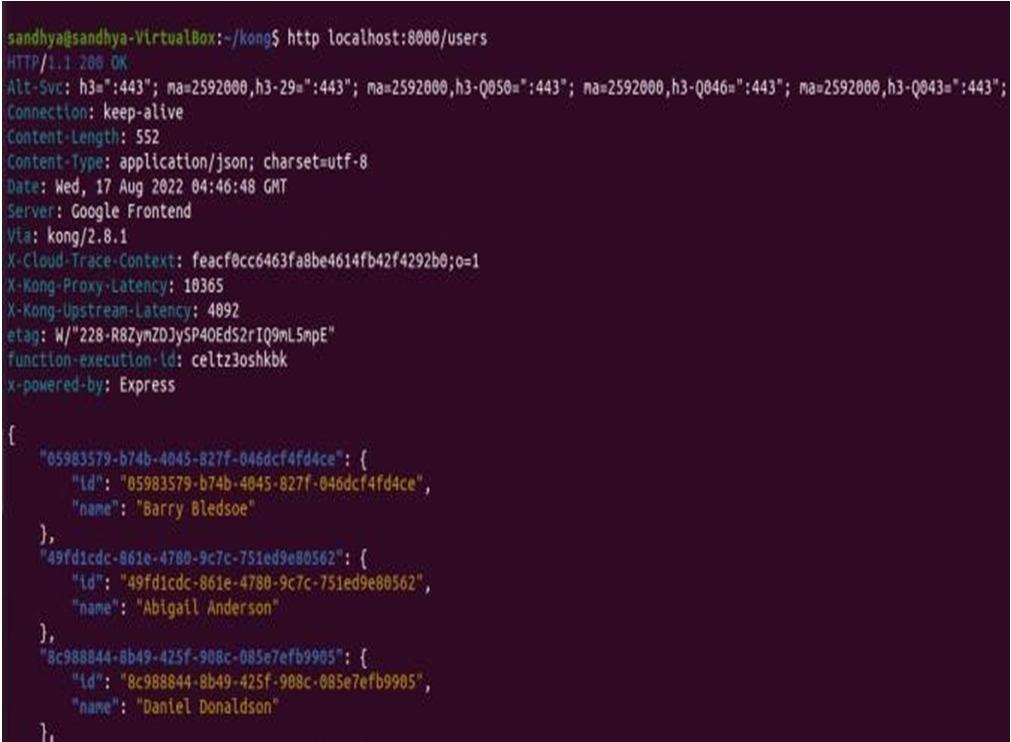
Fig. 3. Getting Unauthorized message as a response from the /usersendpoint.
For the next request we have a restricted the Firefox browserusing bot detection plugin. When we send a request to accessthe /users endpoint. We will get theresponse as shown in Fig4.
ISSN: 2321 9653; IC Value:
Impact
at www.ijraset.com

Fig.
When we access/users
And for the next test case
have restricted our
On the official Kong
Fig.
not
as a response from the /users endpoint.
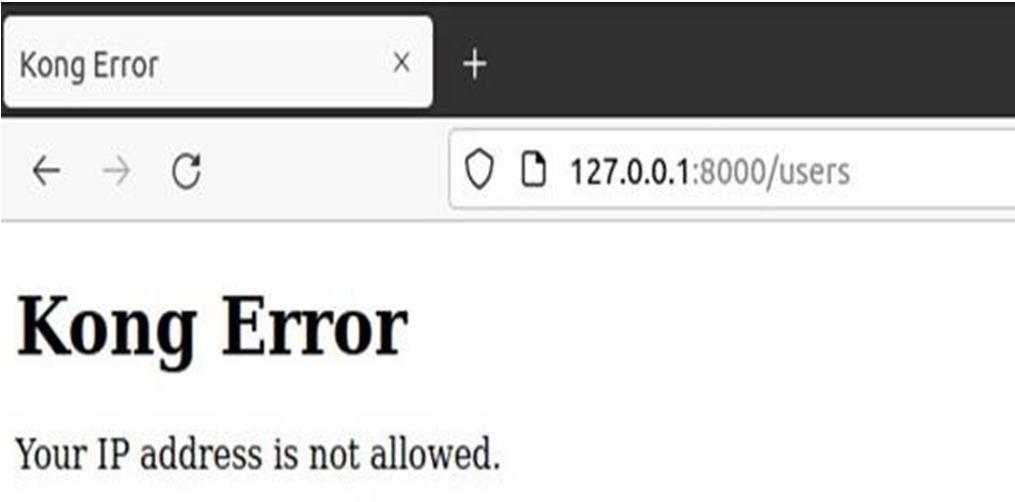
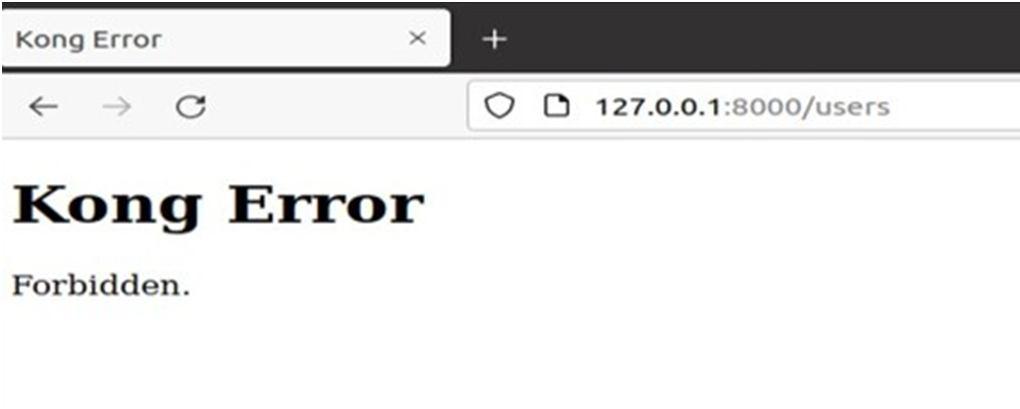
Fig.
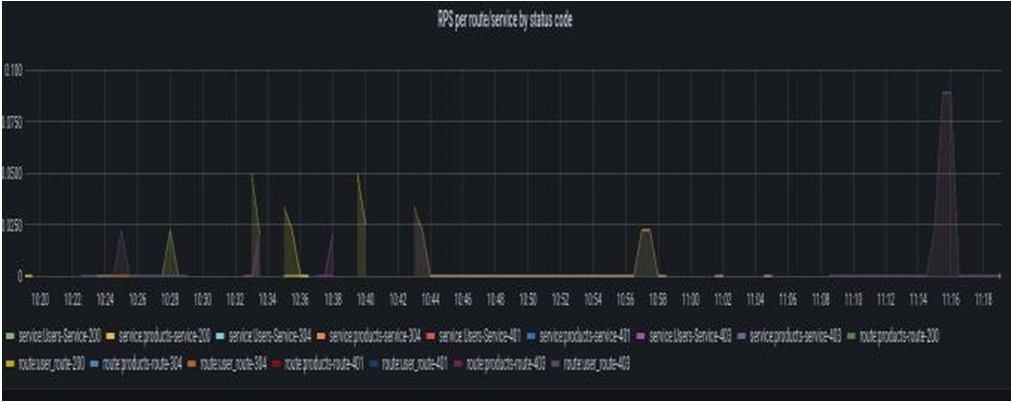
The following Fig 6 shows a number of requests coming towards service with a status code. To differentia the requesteach request has been color coded. We can see in the above diagram the first request is for an Users Service and products service the request is OK. Followed by we have an unauthorized and forbidden request i,e. 401 and 403messages. Similar to this provides a visualization of total requests and routes per second to a service. To give aninsight into how the service is performing kong dashboard provides a visualization of latency across all services, each service, and routes. And the other metrics visualization it provides are upstream time, total bandwidth, kong shared memory used by a node, kong worker Lua VM usage by Node, Nginx connection state, total connection, and handled connection.
V. CONCLUSION

Provides a solution that solves the problem of visibility of API resources across multiple clouds. And enables a great Visualization of API Security Posture and Metrics. Provides a single Plane of visibility of API Inventory and deployment environments. This solution can aid in the replacement of tools that are limited to platform specific monitoring. Allowsfor the viewing of API security metrics and posture.
For future work, we are planned to include other informationInventory information such as API schema, Sensitive data detection. And to include other clouds such as Oracle Cloud,Digital Ocean, and Data Center Application Servers. Migrateto a Standalone Web Portal / Application to provide dynamicdata updates.
International Journal for Research in Applied Science & Engineering Technology (IJRASET

ISSN: 2321 9653; IC Value: 45.98; SJ Impact Factor: 7.538
Volume 10 Issue IX Sep 2022 Available at www.ijraset.com
REFERENCES
[1] Microservice and cloud native application vs monolithic application. Available: https://blog.sparkfabrik.com/en/microservices and cloud native applications vs monolithic applications
[2] What is Cloud Native apps.
Available: https://enterprisersproject.com/article/2018/10/how explain cloud native apps plain english
[3] Multi Cloud. Available: https://www.cloudflare.com/en in/learning/cloud/what is multicloud/
[4] What is cloudwatch. Available: https://aws.amazon.com/cloudwatch/
[5] Azure Monitor. Available: https://azure.microsoft.com/en us/services/monitor/
[6] Saman Barakat, “Monitoring and Analysis of Microservices Performance”, Journal of Computer Science and Control Systems,Volume 10, May 2017.
[7] Ayman Noor, Devki Nandan Jha, Karan Mitra, Prem Prakash Jayaraman, Arthur Souza, Rajiv Ranjan and Schahram Dustdar, “A framework for monitoring microservice oriented cloud applications in heterogeneous virtualization environments”, 2019 IEEE 12th International Conference on Cloud Computing (CLOUD).
[8] Daniel R.F and Breno B.N. “A method for monitoring the coupling evolution of microservice based architectures,” Apolinário and FrançaJournal of the Brazilian Computer Society, 2021.

[9] Abdelhakim Hannousse, Salima Yahiouche, “Securing Microservicesand Microservice Architectures: A Systematic Mapping Study”, 2020.
[10] Faren, “Kongthe Microservice APIGateway”.
Available: https://medium.com/@far3ns/kong the microservice api gateway 526c4ca0cfa6
[11] Claudio Acquaviva, “Multi cloud API Gateway”.
Available: https://konghq.com/blog/multi cloud api gateway
[12] Arun Ramakani, Kong API Gateway Zero to Production. Available: https://medium.com/swlh/kong api gateway zero to production 5b8431495ee
[13] Reason to use an API Gateway.
Available: https://konghq.com/learning center/api gateway/api gateway uses#:~:text=An%20API%20gateway%20acts%20as,the%20response %20to%20the%20client
[14] Kong Gateway Configuring a service.
Available: https://docs.konghq.com/gateway/latest/get started/quickstart/configuring a service/ [15] Kong Gateway Configuring a service.
Available: https://docs.konghq.com/gateway/latest/get started/comprehensive/expose services/ [16] Kong Gateway Basic Authentication.
Available: https://docs.konghq.com/hub/kong inc/basic auth/. [17] Kong Gateway Bot Detection.
Available: https://docs.konghq.com/hub/kong inc/bot detection/ [18] KongGateway IP Restriction.
Available: https://docs.konghq.com/hub/kong inc/ip restriction/ [19] KongGateway Prometheus.
Available: https://docs.konghq.com/hub/kong inc/prometheus/. [20] Danuka Praneeth, Configuring Kong Plugins.
Available: https://danuka praneeth.medium.com/how i configured kong plugins 2134887bb2cb [21] Prometheus Overview.
Available: https://prometheus.io/docs/introduction/overview/ [22] Grafana and Prometheus Overview.
Available: https://grafana.com/docs/grafana/latest/getting started/get started grafana prometheus/
