10 VIII August 2022 https://doi.org/10.22214/ijraset.2022.46410
International Journal for Research in Applied Science & Engineering Technology (IJRASET) ISSN: 2321 9653; IC Value: 45.98; SJ Impact Factor: 7.538 Volume 10 Issue VIII Aug 2022 Available at www.ijraset.com 1270©IJRASET: All Rights are Reserved | SJ Impact Factor 7.538 | ISRA Journal Impact Factor 7.894 | Removal of Copper metal from Industrial wastewater using GCC adsorbent Aniket Gupta1, Dr. A.K. Shukla2, Anand Patel3 1M Tech Scholar, Civil Engineering Department, Institute of Engineering and Technology, Lucknow, India 2Professor, Civil Engineering Department, Institute of Engineering and Technology, Lucknow, India 3Assistant Professor, Civil Engineering Department, Institute of Engineering and Technology, Lucknow, India Abstract: An Activated carbon has been employed as a adsorbent in adsorption methods, which are widely now used by numerous researcher to remove major heavy metals from waste streams. Activated carbon are still a pricy commodity even though it is majorly use in the water and wastewater treatments industries. The demand for economically technology to remove major heavy metal from contaminated waters has recently sparked research into the development of affordable alternatives to commercial available activated carbon. The ability of glutaraldehyde cross link chitosan (GCC) co polymer to remove and recover copper (Cu (II)) from electroplating solution is examined in this study, along with the impacts of solutions chemistry on adsorption and desorption character of Cu (II) using chitosan-based resins. A GCC co polymer adsorbent was made with the help grafting medium molecular weight chitosan with glutaraldehyde at a specific weight ratio (1/17). (25 percent in H2O). within the parameters of 4 9 pH, 30 150 min of contact time, 25 200 mg/L of dosage, 30 150 mg/L of starting Cu (II) concentration (conc.). Batch tests were done to determine which settings were ideal for copper. Additionally, the effects of factors like adsorbent dosage, pH, contact time, and initial metal ions con were examined. For copper, the ideal conditions were 120 minute of contacts time, 150 gL 1 of adsorbent, 30 mgL 1 of starting Cu (II) conc. and pH 5. The relation between the conc. and the amount that adsorbent absorbed is shown by the adsorption isotherms. To elaborate adsorption kinetics we define pseudo first order and, the pseudo second orders kinetic models could be utilize. Keywords: Adsorption, cross linked chitosan, copper, isotherm, heavy metals, copolymer.
Chitosan must be stabilized since it is very soluble in the solution of acidic. Cross linking agent with Sulphur, Oxygen, and Nitrogen atoms in the functional group has been discovered to particularly important for the noble metals adsorption [8]
Numerous toxins are entering water bodies as a result of continuous growth in the world's population, manufacturing facilities, unplanned urbanization, farming endeavors, and chemical use [1]. Researchers are investigating the efficient removal of several contaminants from natural cycles, including radioactive material, sediments, heavy metals, synthetic colors, chemicals and other debris [2]. Out of all contaminant heavy metals are the one that is most commonly found in water. Heavy metal are those elements which density greater than 5 gcm 3 in the universe. About trace conc. this categorization includes crucial elements (for example vanadium, iron cobalt and manganese, zinc and copper, strontium and molybdenum) [3] Due to toxicity to a variety of life form, the existence of heavy metal ions is a significant cause for concern. The aqueous waste generated by the mining, tanneries, chloralkali, radiator manufacture, alloy smelting, and storage battery industries might contain heavy metal pollution. Heavy metal plating operations, batteries, fertilizer industries mining operations, tanneries, stabilizers, paper industries, pesticides galvanizing plant, thermoplastic, pigment manufacture and other sectors produced the majority of the heavy metal containing effluent. All living things contain the important metal copper. This material's characteristics include strong thermal and electrical conductivity, good corrosive resistance, quick accessibility, high reusability, and an aesthetic appearance [4] One of the major harmful heavy metal to the living things and one of the most periodic heavy metal contaminants in the environment is copper Copper when eaten in large quantities, can cause hepatotoxicity, hemolysis and nephrotoxicity, as well as vomiting, convulsion, clamps, and even death [5] Adsorbents are typically seen as cheap cost if they are abundant in nature, need little processing, or are leftovers or by products from another industry. Increased sorption capacity is a benefit [6] Recent investigations on inexpensive adsorbents for removing heavy metals from natural resources have been accomplished. The deacetylation of chitin to yield chitosan, a cheap adsorbent that is biodegradable and biocompatible. As a result of chitin's alkaline deacetylation, chitosan are distinctive basic partially deacetylated glucose amine polymer. After cellulose, it is the second most prevalent biopolymer on the planet and predominantly consists of (1 4 2 acetamido 2 Deoxy D glucose) units [7]
I. INTRODUCTION


B. Preparation Mechanism of GCC Copolymer for Cu (II) Adsorption
For the batch adsorption testing, 250 rpm, known volumes of the GCC co polymer resins, and the 50 mL of known synthetic Cu (II) solution conc. were combined in a conical flask of equal volume [5]. By changing just one parameter while holding the other variables constant, the satisfactory of adsorption process parameter such as adsorbent dosages, contact time, pH and starting metals ion conc. were determined. These variables ranged from 4 to 9 pH, 30 to 180 minutes, 25 to 200 g/L, and 30 to 150 mg/L, respectively. When the adsorbent was added, the timing commenced. These experiments were conducted in 150 mL Erlenmeyer flasks. After shaking, the material was collected and put through the filter with a 0.450 m pore size of Whatman membrane [11] Finally, an AAS was used to check the sample for any lingering copper ion of the solution (AAS, Model AAS 263). The trials were run three times, and the results that averaged them were published. The following equations were used to examine the removal efficiencies of GCC adsorbed. Eq. 1 is use to evaluate the percentages of copper removal, while Eq. 2 is used to get the adsorption capacity qe % = ( ) (1)
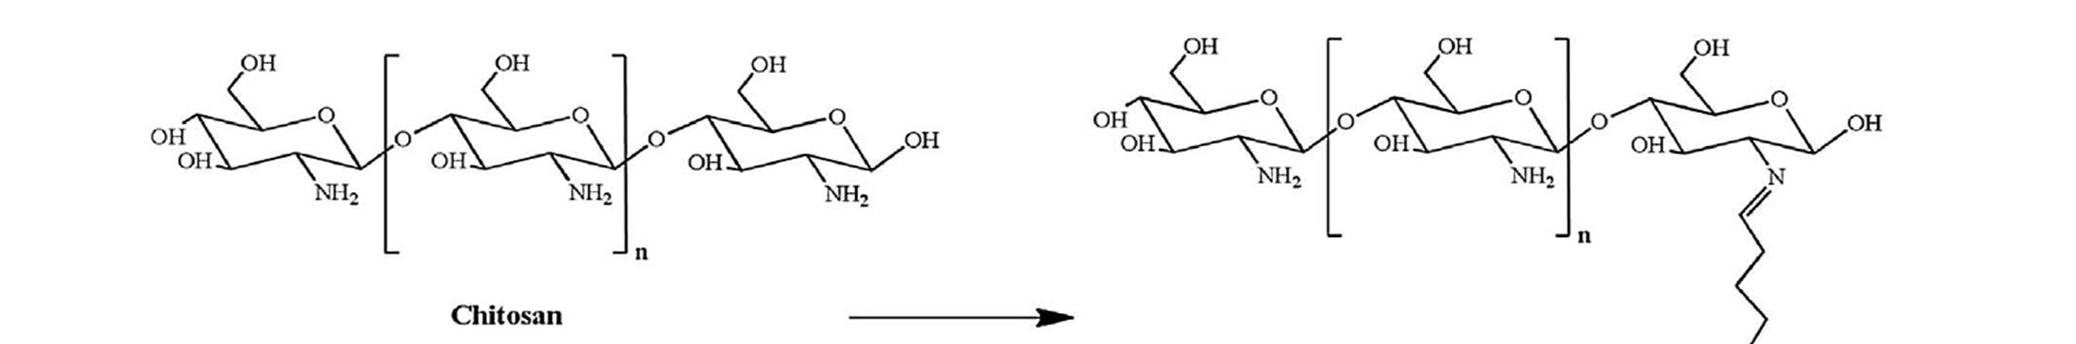
First, under constant stirring for 12 hours, 2 gm of chitosan were dissolved in 300 mL of 0.05M acetic acid. 32 mL of glutaraldehyde was then immediately added to the chitosan solutions. Reaction mixture under gelation (five minutes) turned from light yellow to dark orange within an hour of the addition. The gel were finally neutralise with 0.1 N of NaOH solutions until the pH 5 7 was achieved. Following numerous cleanings using millipore water and acetone, the final product was dried for a whole night in the vacuum oven (58°C). Then dry product were pounded into the micro powder using a mortar & pestle. It was then dried overnight at about 45°C under P2O5 in a vacuum dryer. The resulting co polymer products were crushed with the mortar and the pestle and screened through a 40 mesh filter to produce a coarse co polymer adsorbent. Crosslinking of glutaraldehyde with chitosan and the adsorption of copper on GCC were both confirmed by FTIR investigations [3].
Figure 1 Reaction mechanism of GCC copolymer.
C. Cu (II) adsorption experiment
Where, Co is the initial adsorbate conc. (mg/L) and Ce is the final equilibrium adsorbate conc. (mg/L)
International Journal for Research in Applied Science & Engineering Technology (IJRASET) ISSN: 2321 9653; IC Value: 45.98; SJ Impact Factor: 7.538 Volume 10 Issue VIII Aug 2022 Available at www.ijraset.com 1271©IJRASET: All Rights are Reserved | SJ Impact Factor 7.538 | ISRA Journal Impact Factor 7.894 |
A. Reagents
glutaraldehyde
The goal of this research is to produce and characterize cross linkeded chitosan co polymer (GCC). The chelating resin based on was created by the grafting process. Using Fourier transform infrared (FTIR) spectroscopy, the resin's surface characteristics and the presence of several functional groups were evaluated.
II. MATERIALS AND METHODS
Chitosan with a medium molecular weight and have a degree of deacetylation of between 75% and 85% was purchased from the Bangalore, India based Sigma Aldrich Corporation. Purchase from RFCL limited, New Delhi, India, was glutaraldehyde (25 percent w/v, molecular wt = 100.121) [9] Millipore water (Make: million) and 99.9% pure CuSO4 from SRL Chemicals Pvt. Ltd., India, were utilized. HCl and NaOH solutions of analytical quality, as well as a pH meter, were used to change the solution's pH. (Make: VSI 301) [10].

III. RESULTS
Only the adsorbent doses were adjusted using the optimal conditions identified during optimization trials to analyze the adsorption isotherms. After conducting Cu (II) adsorption tests at varied initial Cu (II) ion conc., adsorption capacities were determined (from 30 to 150 ppm). For each dosage of the adsorbent, 50 cc of the sample were take then mixed at 120 rpm. The data are from the experiment were model by using the Freundlich, and Langmuir adsorption isotherm [1] Since it is crucial to comprehend the rate at which the process occurs and the elements that affect the rate of the process, the kinetics of the processes were assessed. These studies might be carried out by maintaining constants for the adsorbed dose, pH, heavy metal content, and agitation rate. Samples were obtained after 50, 100, 150, 200, 250, and 300 minutes to gauge the number of heavy metals still present in the sample of solution. The datas from the experimental was then updated in both the pseudo second order model of Ho & McKey and the pseudo first order models of Lagergren [13] AND DISCUSSION
A. Characterization of GCC Adsorbent FTIR Spectroscopy
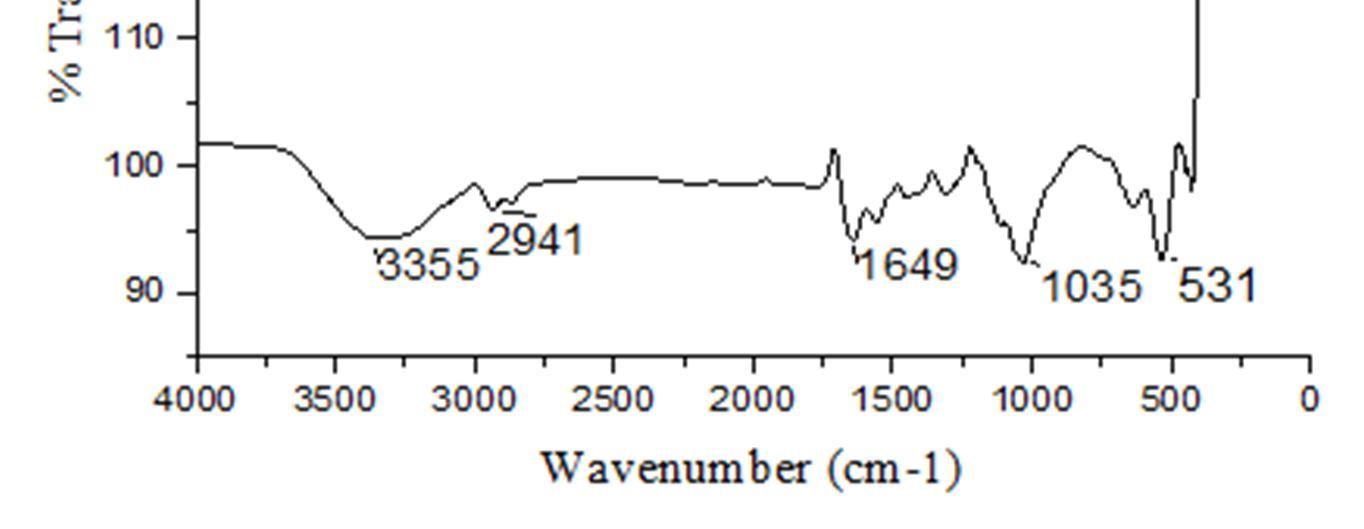
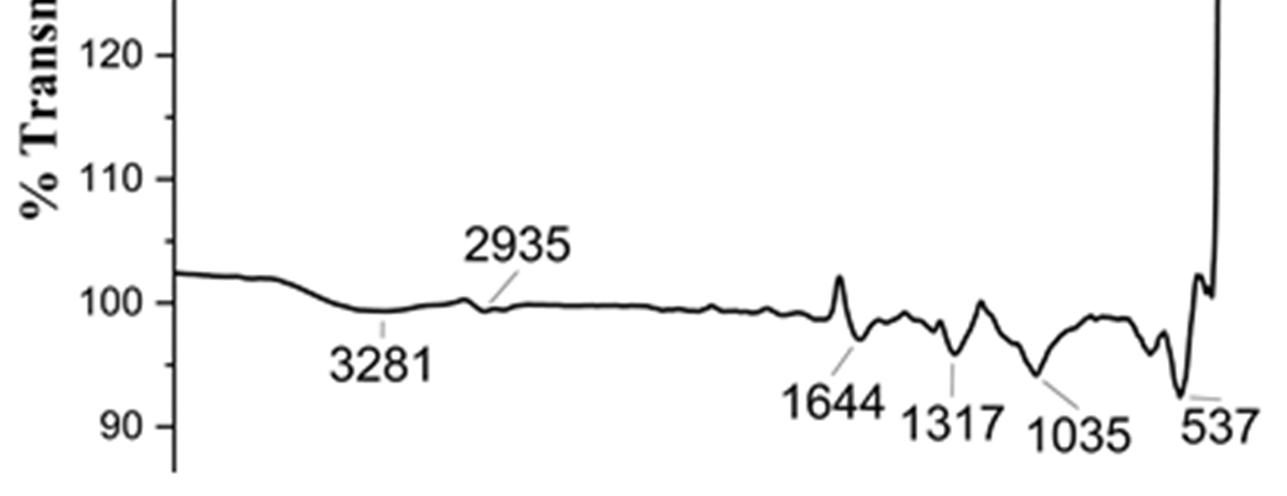
The FTIR spectras for the natural state of chitosan, GCC co polymer, and Cu (II) adsorbed GCC resins are each displayed in Figure 2. Chitosan's stretching vibrations of the intermolecular hydrogen bonds, hydroxy ( OH), and NH2 atoms have all been confirmed at 3297 cm 1. When compared to chitosan with the FTIR spectras of the GCC co polymer exhibit significant changes in several peak (from 2879, 1650, 1030, and 538 cm1 to 2941, 1649, 1035, and 531 cm 1). This demonstrates that chitosan and glutaraldehyde were cross linked chitosan [14]. About the Cu (II) loaded GCC, the noticeable peaks are shifting from 1649 to 1650 cm 1 and 531 to 538 cm 1. It might be because of a stronger chemisorption effect caused by Cu (interaction) with the NH group. Oxygen atom has lone pair of the electrons in O H and the nitrogen atoms in the C = N. In conclusion, GCC copolymer would contain both imine and amine groups, both of which favourable for Cu (II) adsorption.
D. Isotherm and Kinetics Studies
International Journal for Research in Applied Science & Engineering Technology (IJRASET) ISSN: 2321 9653; IC Value: 45.98; SJ Impact Factor: 7.538 Volume 10 Issue VIII Aug 2022 Available at www.ijraset.com 1272©IJRASET: All Rights are Reserved | SJ Impact Factor 7.538 | ISRA Journal Impact Factor 7.894 | = ( ) (2) Where, Co and Ce are the initial and equilibrium liquid phase conc. of the Cu ion in mg/L, and V is known as the volume of the solution in Liter, W is the weight of the adsorbent that is used in g, and qe is known as the removal efficiency of the adsorbent in mg/g [12].
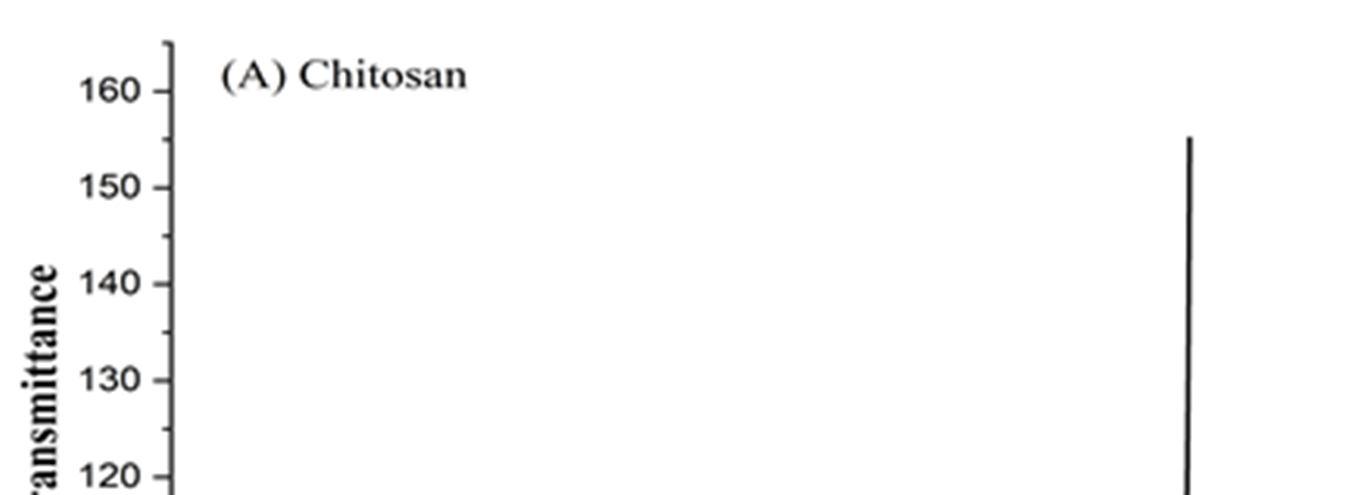

Figure 2 FTIR spectra of (a)Raw Chitosan; (b) Glutaraldehyde Cross linked chitosan and (c) Cu (II) loaded copolymer; respectively. B. Effects of pH pH is known to be one of major factor in process of adsorption because of its effect on adsorption effectiveness [9] The functional groups in charge of metal ion binding on the adsorbent surface are significantly influenced by pH. Additionally, ions in the sol. compete with one another for the active site of the adsorbent. This competition is impacted by the fluid's pH. A batch method was used to explore how pH affects the adsorption process. The conditions were room temperature, 180 minutes of contact time, 120 rpm of continuous agitation, and 15 gL 1 of the adsorbents. Results of the investigation into how pH affects copper extraction by GCC adsorbent are shown in Figure 3. As a result, it was discovered that pH is the ideal pH for maximizing copper uptake. The GCC adsorbent offered the highest removal rate of 85% at pH 7.
International Journal for Research in Applied Science & Engineering Technology (IJRASET) ISSN: 2321 9653; IC Value: 45.98; SJ Impact Factor: 7.538 Volume 10 Issue VIII Aug 2022 Available at www.ijraset.com 1273©IJRASET: All Rights are Reserved | SJ Impact Factor 7.538 | ISRA Journal Impact Factor 7.894 | `


One of most important variables in adsorption research is the effects of the contact time take place between the adsorbate and the adsorbent particles [15] With a 15 g/L adsorbent dosage and a pH of 7, the experiments were held at room temperature over 30 to180 minutes in 30 minute intervals. Adsorbate conc. and agitation speed were both maintained at 120 rpm and 15 g/L, respectively. Up to 30 minutes were spent during the early phase of fast adsorption before the rate steadily decreased. 86 percent of the time, or 120 minutes, was devoted to the adsorption process before equilibrium was established. After 120 minutes, no discernible difference in the elimination of Cu was seen in Figure 4. This is because there are so many free surface sites available for the adsorption at the initial stages process. 40 60 80 100 120 140 160 180 200 40 50 60 70 80 90 % (min)
Figure 4 Effects of contact time on the removal of Cu (II) by GCC
International Journal for Research in Applied Science & Engineering Technology (IJRASET) ISSN: 2321 9653; IC Value: 45.98; SJ Impact Factor: 7.538 Volume 10 Issue VIII Aug 2022 Available at www.ijraset.com 1274©IJRASET: All Rights are Reserved | SJ Impact Factor 7.538 | ISRA Journal Impact Factor 7.894 | However, the lowest adsorption capacity of 32% at pH 4 was noted from Figure 3. Both the adsorption percent and removal in mgg 1 show identical decreasing trend when the pH of the sol. lowers in this experiment, where the adsorbent dosage and the initial conc. of adsorbate remained constant. As higher the pH causes the surfaces of the adsorbent to become negatively charge, which causes a decrease in the adsorbent surface. Additionally, the competitive adsorption results in the bunch of OH in the aqueous solution. The strong electrostatic attraction is what accounts for the increased adsorption capacity seen at lower pH levels. 4 5 6 7 8 9 30 40 50 60 70 80 90 % Removal pH
20
20 30
C. Effects of Contact Time
Figure 3 Effect of pH on the removal of Cu (II) by GCC.
Removal Time
International Journal for Research in Applied Science & Engineering Technology (IJRASET) ISSN: 2321 9653; IC Value: 45.98; SJ Impact Factor: 7.538 Volume 10 Issue VIII Aug 2022 Available at www.ijraset.com 1275©IJRASET: All Rights are Reserved | SJ Impact Factor 7.538 | ISRA Journal Impact Factor 7.894 | D. Effects of Adsorbent Dose Under various experimental conditions, the effects of GCC adsorbent dosages on copper removal efficiency was examined using adsorbent dosages of 25g/L, 50g/L, 100g/L, 150g/L, and 200g/L. The copper adsorption percentage increased from 32 to 89 percent as the adsorbent doses were increase from 25 to 150 g/L. On the other hand, as the ions adsorption capacity per gram of adsorbent drop, the adsorption capacity also decreases which can also be seen from Figure 5 [16] As a result, higher removal and reduced capacitance are anticipated as the adsorbent dosage is raised, which is consistent with the study's findings 20 40 60 80 100 120 140 160 180 200 220 30 40 50 60 70 80 90 Removal% Dose (g/L) Figure 5 Effects of adsorbent dose on the removal of Cu (II) by GCC. E. Effect of Initial Conc When choosing ideal experimental adsorption settings, it is important to consider the rate of adsorption because it depends on the starting conc. of the adsorbate [18] [19]. Figure 6 illustrates the influence of various beginning copper concentration (pH 7, 120 rpm speed, 120 minutes of time for contact and 150 g/L adsorbent dosage) on the efficiencies of copper removal under the const. experimental condition 20 40 60 80 100 120 140 160 82 84 86 88 90 92 94 96 Removal% Initial concentration (mg/L) Figure 6 Effect of initial conc. on the removal of Cu (II) by GCC.
RL > 1 and RL = 1 Irreversible
Eq. (3), following = + (3) Where, qe
The parameters of the Langmuir model determined using the linearized form, which is shown in is amount of absorbed by the adsorbent mg/g and is known as the equilibrium copper conc. in mg/L. The adsorption constant and max amount of the adsorbate that may be adsorbed by GCC adsorbent, respectively, denoted by the letters For this experiment, K and values were calculated using the slope and intercept [18]. One of major features of the model is the ability to calculate a dimensionless variable also known for the equilibrium parameter, as shown in Eq.
RL = 0
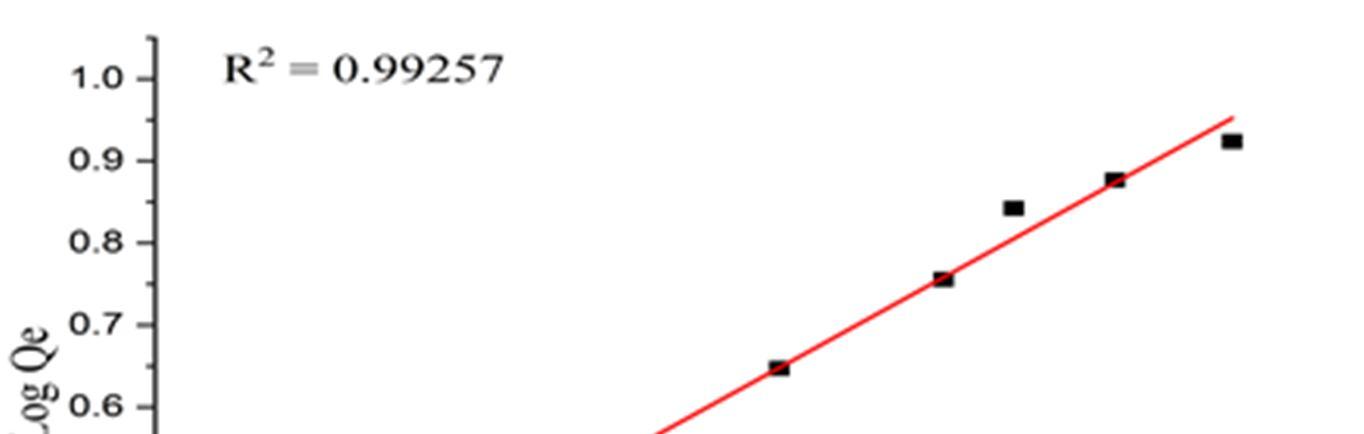
The intercept and slope of the linear plot of logqe versus logCe displayed in Figure are used to calculate the Freundlich isotherm constants Kf and 1/n, respectively. If n is in the range of 1 and 10, positive adsorption is indicated. Conversely, if 1/n is larger than 1 then it indicates cooperative adsorption and if it is less than 1 then it indicates regular adsorption [19] The numerical value of 1/n in Table 2 of 0.52298 denotes a favorable adsorption process.
KL and qm [17]
regimes: Favourable
Ce
Langmuir
= ( ) (4)
qm
(5) = +( ) (5)
International Journal for Research in Applied Science & Engineering Technology (IJRASET) ISSN: 2321 9653; IC Value: 45.98; SJ Impact Factor: 7.538 Volume 10 Issue VIII Aug 2022 Available at www.ijraset.com 1276©IJRASET: All Rights are Reserved | SJ Impact Factor 7.538 | ISRA Journal Impact Factor 7.894 | F. Adsorption Isotherms
RL,
Cu
are
The magnitude of RL affirms one of the following adsorption: and linear adsorption: adsorption:
0 < RL < 1 Unfavourable
Where, Ce is the final concentration of Cu in solution, or equilibrium concentration (mg/L), and qe is the metal absorption (mg/g) at equilibrium, Kf is the measure of adsorption capacity, 1/n is the adsorption intensity.
adsorption
were
L
The linearized form of the Freundlich isotherm model is shown in Eq.
Figure 7 Langmuir adsorption isotherm model for copper.
in

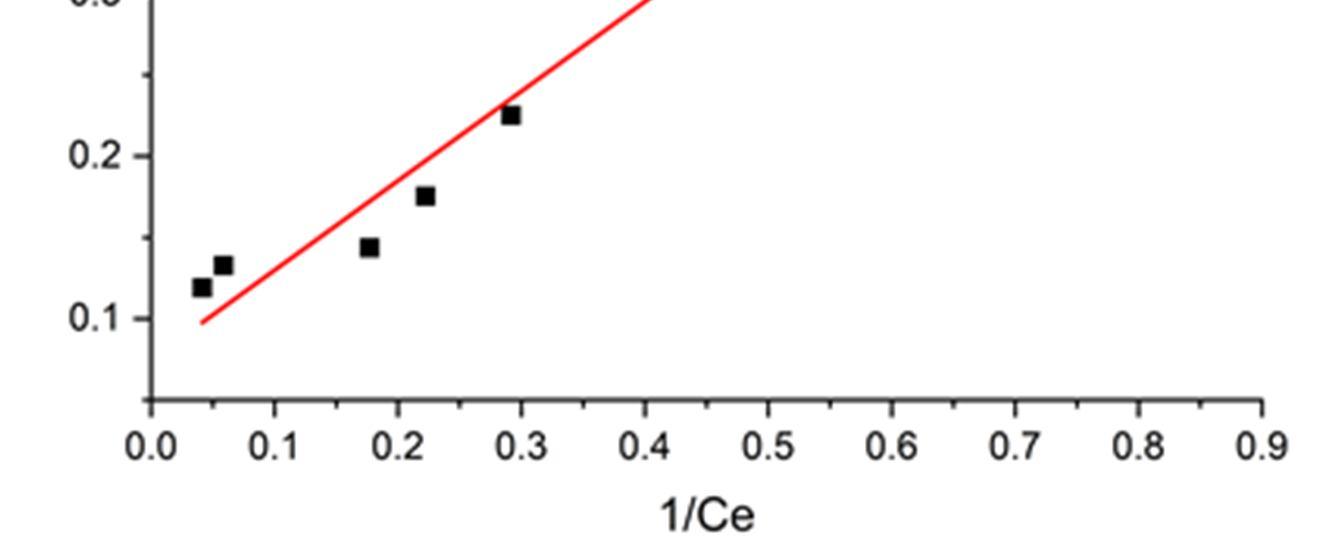
International Journal for Research in Applied Science & Engineering Technology (IJRASET) ISSN: 2321 9653; IC Value: 45.98; SJ Impact Factor: 7.538 Volume 10 Issue VIII Aug 2022 Available at www.ijraset.com 1277©IJRASET: All Rights are Reserved | SJ Impact Factor 7.538 | ISRA Journal Impact Factor 7.894 | Figure 8 Freundlich adsorption isotherm model for copper. Table 1 . Parameters of Langmuir isotherm model for copper R2 Adsorbent Qo Kl Rl 0.97399 GCC 13.37256 0.13566 0.128485 Table 2 Parameters of Freundlich isotherm model for copper Adsorbent Kf 1/n R2 GCC 1.694377 0.52298 0.9925 G. Adsorption Kinetics
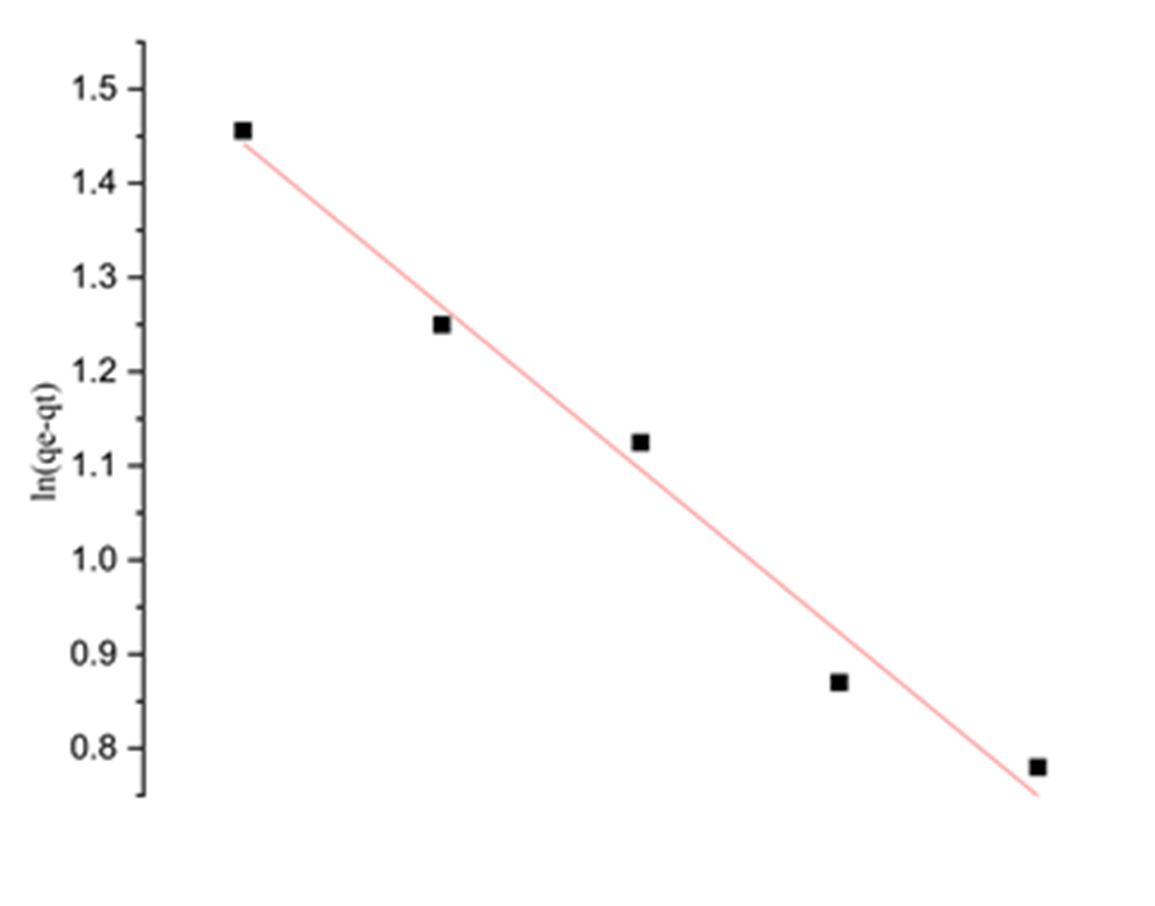
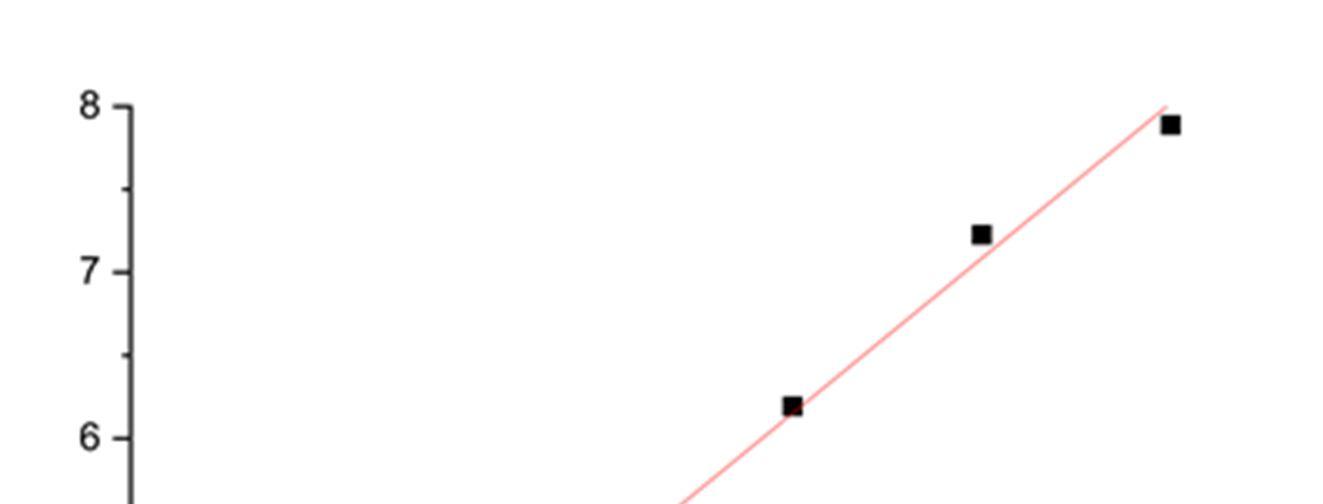
To evaluate the kinetic mechanism that controls the adsorption process, the pseudo first order and pseudo second order interpretations of the experimental data were attempted [20]. This is how the pseudo first order model is written: ( )= ( ) (6) where qe and qt (mg/g) represent the number of Cu ions adsorbed per unit weight of the adsorbents at equilibrium and time t (min), respectively, and k1 is the rate constant of the pseudo first order kinetic model. If a linear relationship can be shown when plotting ln (qe qt) v/s time (t) as shown in the Figure 9, pseudo first order kinetics is appropriate [21] In addition, the rate constants (k1), qe(cal), and correlation coefficient were calculated using the straight line plot of ln (qe qt) v/s time. The pseudo second order model is expressed by Eq. (7): = + (7) Where, k2 is known as the rate constant of the pseudo second order kinetic model, and qe and qt (mg/g) indicate the number of Cu ions adsorbing per unit weight of the adsorbents at the equilibrium and time t (min), respectively [13,22] The pseudo second order kinetic model should apply as a straight line on the plot of t/Qt versus t. The rate constant can be calculated using the slope and the intercept of the plots of the rate constant (k2) and computed equilibrium adsorptions capacity (qe (cal)), which is shown in Figure 10

International Journal for Research in Applied Science & Engineering Technology (IJRASET) ISSN: 2321 9653; IC Value: 45.98; SJ Impact Factor: 7.538 Volume 10 Issue VIII Aug 2022 Available at www.ijraset.com 1278©IJRASET: All Rights are Reserved | SJ Impact Factor 7.538 | ISRA Journal Impact Factor 7.894 | Figure 9 Pseudo first order kinetics plot for copper. Figure 10 Pseudo second order kinetics plot for copper. Table 3 Pseudo first order kinetics parameters Adsorbent qe (exp) qe (cal) kl (min 1) R2 GCC 8.391933 5.983466 0.0001073 0.95768 Table 4 Pseudo second order kinetics parameters Adsorbent qe (exp) qe (cal) k2 (g mg 1 min 1) R2 GCC 8.391933 10.53319 0.000144 0.99446

holistic support and Ecomen
Journal.
[10] X. qi Liu, X. xin Zhao, Y. Liu, T. an Zhang, Review on preparation and adsorption properties of chitosan and chitosan composites, Polymer Bulletin. 79 (2022) 2633 2665. https://doi.org/10.1007/s00289 021 03626 R.K. Vempati, S.C. Musthyala, M.Y.A. Mollah, D.L. Cocke, Surface analyses of pyrolysed rice husk using scanning force microscopy, Fuel. 74 (1995) 1722 1725. Y. Birhanu, S. Leta, G. Adam, Removal of chromium from synthetic wastewater by adsorption onto Ethiopian low cost Odaracha adsorbent, Applied Water Science. 10 (2020). https://doi.org/10.1007/s13201 020 01310 3 P. Kumar, REMEDIATION OF HEAVY METALS FROM MUNICIPAL SEWAGE BY TREATMENT IN STP AND THE EFFECT OF TREATED SEWAGE ON THE SURFACE WATER AND SEDIMENT QUALITY OF RIVER GANGA AT KANPUR, UTTAR PRA... RHIZOSPHERE BIOREMEDIATION OF HEAVY METALS FROM ELECTRONIC WASTE CONTAMINATED SOIL View project Incense sticks ash View project, (n.d.). https://doi.org/10.13140/RG.2.2.16446.84805. B. Li, C.L. Shan, Q. Zhou, Y. Fang, Y.L. Wang, F. Xu, L.R. Han, M. Ibrahim, L.B. Guo, G.L. Xie, G.C. Sun, Synthesis, characterization, and antibacterial activity of cross linked chitosan glutaraldehyde, Marine Drugs. 11 (2013) 1534 1552. https://doi.org/10.3390/md11051534
9. [11]
https://doi.org/10.1016/0016 2361(94)00119 C [12]
The affinity of GCC to absorb Cu (II) from water has been studied. The amount eliminated depended on the solution's conc., pH, temperature, and length of contact. The pores on the adsorbents surface before and after adsorption are shown in the Fourier transform infrared characterization data as an indicator of the adsorption capabilities. A batch experiment revealed that 120 min, pH 7, 150 g/L, and 30 mg/L were the optimal contact times, GCC dosages, initial copper conc. and pH levels. Cu was extracted from the wastewater by the GCC adsorbent to a 94.68% level. Fitting the equilibrium and the kinetic data gathered during Cu (II) adsorption to the Langmuir and the pseudo second order kinetic models, respectively. Dr. A.K. Shukla, CED, IET Lucknow Asst. Prof. Anand Patel CED, IET Lucknow, their Laboratories Ltd. K. Selvi, S. Pattabhi, K. Kadirvelu, Removal of Cr(VI) from aqueous solution by adsorption onto activated carbon, Bioresource Technology. 80 (2001) 87 89. M. Hong, L. Yu, Y. Wang, J. Zhang, Z. Chen, L. Dong, Q. Zan, R. Li, Heavy metal adsorption with zeolites: The role of hierarchical pore architecture, Chemical Engineering 359 (2019) Srimoon, Potipat, Development of beads as an oil adsorbent and its application in household grease traps, ScienceAsia. 47 (2021) 330 339. Zhu, J. Hu, J. Wang, Competitive adsorption of Pb(II), Cu(II) and Zn(II) onto xanthate modified magnetic chitosan, Journal of Hazardous Materials. 221 222 (2012) 155 161. https://doi.org/10.1016/j.jhazmat.2012.04.026 G. Jain, P. Rath, REMOVAL OF COPPER AND ZINC FROM WASTEWATER USING CHITOSAN Under the Guidance of, n.d. H.C. Wells, K.H. Sizeland, R.L. Edmonds, W. Aitkenhead, P. Kappen, C. Glover, B. Johannessen, R.G. Haverkamp, Stabilizing chromium from leather waste in biochar, in: ACS Sustainable Chemistry and Engineering, American Chemical Society, 2014: pp. 1864 1870. https://doi.org/10.1021/sc500212r S. Nagireddi, V. Katiyar, R. Uppaluri, Pd(II) adsorption characteristics of glutaraldehyde cross linked chitosan copolymer resin, International Journal of Biological Macromolecules. 94 (2017) 72 84. https://doi.org/10.1016/j.ijbiomac.2016.09.088.
[14]
[20] H. Yuh Shan, ADSORPTION OF HEAVY METALS EROM WASTE STREAMS BY PEAT School of Chemical Engineering, (1995) 130 137. https://etheses.bham.ac.uk//id/eprint/8742/1/Ho%2C Yuh Shan_1995_PhD_01840180_%5BeTheses%5D.pdf. [21] S. Ding, X. Zhang, X. Feng, Y. Wang, S. Ma, Q. Peng, W. Zhang, Synthesis of N,N′ diallyl dibenzo 18 crown 6 crown ether crosslinked chitosan and their adsorption properties for metal ions, Reactive and Functional Polymers. 66 (2006) 357 363. https://doi.org/10.1016/j.reactfunctpolym.2005.08.008
[22] H.A. Hegazi, Removal of heavy metals from wastewater using agricultural and industrial wastes as adsorbents, HBRC Journal. 9 (2013) 276 282. https://doi.org/10.1016/j.hbrcj.2013.08.004
[15] S.L. Somasani, Removal of Heavy Metals from Drinking Water by Adsorption onto Limestone with a Focus on Copper and Aluminum Applications, Western Kentucky University TopSCHOLAR. (2012) 74 [16] W.E. Marshall, L.H. Wartelle, D.E. Boler, M.M. Johns, C.A. Toles, Enhanced metal adsorption by soybean hulls modified with citric acid, Bioresource Technology. 69 (1999) 263 268. https://doi.org/10.1016/S0960 8524(98)00185 0. [17] M.H. Armbruster, J.B. Austin, The Adsorption of Gases on Plane Surfaces of Mica, J Am Chem Soc. 60 (1938) 467 475. https://doi.org/10.1021/ja01269a066
[7]
[8] Q. Zia, M. Tabassum, H. Gong, J. Li, A Review on Chitosan for the Removal of Heavy Metals Ions, Journal of Fiber Bioengineering and Informatics. 12 (2019) 103 128. https://doi.org/10.3993/JFBIM00301
363 372. https://doi.org/10.1016/j.cej.2018.11.087 [3] R.
https://doi.org/10.1016/S0960 8524(01)00068 2 [2]
[18] M. Ajmal, R. Ali Khan Rao, S. Anwar, J. Ahmad, R. Ahmad, Adsorption studies on rice husk: Removal and recovery of Cd(II) from wastewater, Bioresource Technology. 86 (2003) 147 149. https://doi.org/10.1016/S0960 8524(02)00159 1. [19] A. Aurich, J. Hofmann, R. Oltrogge, M. Wecks, R. Gläser, L. Blömer, S. Mauersberger, R.A. Müller, D. Sicker, A. Giannis, Improved Isolation of Microbiologically Produced (2R,3S) Isocitric Acid by Adsorption on Activated Carbon and Recovery with Methanol, Organic Process Research and Development. 21 (2017) 866 870. https://doi.org/10.1021/acs.oprd.7b00090
and
V. ACKNOWLEDGEMENTS The authors thank
J.
[9] D.Y. Pratt, L.D. Wilson, J.A. Kozinski, Preparation and sorption studies of glutaraldehyde cross linked chitosan copolymers, Journal of Colloid and Interface Science. 395 (2013) 205 211. https://doi.org/10.1016/j.jcis.2012.12.044
[5]
[13]
Pvt.
chitosan
Lucknow, to providing the essential facilities for conducting this research. REFERENCES [1]
International Journal for Research in Applied Science & Engineering Technology (IJRASET) ISSN: 2321 9653; IC Value: 45.98; SJ Impact Factor: 7.538 Volume 10 Issue VIII Aug 2022 Available at www.ijraset.com 1279©IJRASET: All Rights are Reserved | SJ Impact Factor 7.538 | ISRA Journal Impact Factor 7.894 | IV. CONCLUSIONS
[6]
https://doi.org/10.2306/SCIENCEASIA1513 1874.2021.046 [4] Y.
