10 VII July 2022 https://doi.org/10.22214/ijraset.2022.46014

Reduction of Speckle Noise in SAR Images With Hybrid Wavelet Filter
Keywords: Additive White Gaussian Noise (AWGN), Bivariate Shrinkage, Discrete Wavelet Transform (DWT), Speckle Noise, Synthetic Aperture Radar (SAR), Wavelet Filter.
This paper suggests a wavelet based bivariate shrinking technique that significantly reduces speckle in order to produce high resolution SAR images.
I. INTRODUCTION
International Journal for Research in Applied Science & Engineering Technology (IJRASET) ISSN: 2321 9653; IC Value: 45.98; SJ Impact Factor: 7.538 Volume 10 Issue VII July 2022 Available at www.ijraset.com 4834©IJRASET: All Rights are Reserved | SJ Impact Factor 7.538 | ISRA Journal Impact Factor 7.894 |
Synthetic aperture radar (SAR) sensors provide a number of advantages over optical remote sensing, the most significant of which is the ability to record throughout the day and throughout the year [1]. The existence of speckle noise, a type of unwanted or undesirable alteration signal related granular noise, is the main drawback of SAR images [2]. Over the past three decades, a variety of SAR image de noising approaches have been put forth. To address the problem, a number of researchers average a fixed number of various photographs but value a considerable loss in picture resolution. The additive model produced by the logarithmic transformation that was initially employed to minimise speckle noise is easier to utilize. In order for certain well known methods for eliminating distortion to also operate with the modified model, additive white Gaussian noise (AWGN) may be used as a model [3]. Such methods usually ignore a few basic speckle features despite how simple they are to use. The zero mean Normal Distribution, or what is commonly referred to as the Gaussian distribution, is not exactly followed by the log transformed speckle interference. Therefore, the variance needs to be corrected before continuing the process [4]. During the same time period, de noising inside this initial domain was tackled by extremely sophisticated algorithms based on the multiplicative speckle paradigm. Such studies unequivocally established the necessity of a certain kind of local adaptation to account for the non stationary of this image. Additional methods for eliminating distortion in the transform domain are becoming available with the development and improvement of such multi scale analysis framework. After a homomorphic filtering, wavelet shrinkage might be easily added to such altered coefficients. In addition to the spatial domain, wavelet techniques benefit from spatial adaptation while enhancing the image to successfully maintain both image textures and bounds [5] [8].
Abstract: Images produced by synthetic aperture radar (SAR) are crucial for observing and visualizing situations. However, speckle noise makes it difficult to assess SAR images since it reduces image quality and leads to incorrect interpretation. Multiplicative noise features can be found in speckle noise. For the past few years, experts have concentrated on despeckling or speckle reduction. However, the majority of the current efforts showed a loss of edge information. Since wavelet transform and bivariate shrinkage functions have many advantages, this study is devoted to designing a method for speckle removal. After performing a logarithmic transformation to turn multiplicative noise into additive noise, the suggested approach next applies a Lee filter. Then, a wavelet transform was used to breakdown the filtered image. Prior to applying the median filter, the bivariate shrinkage function was used to estimate each coefficient. The simulation results demonstrate that the suggested approach outperforms previous work and several traditional methods.
Over the past few years, some researchers have worked very hard on SAR to eliminate speckles, and many methods have been created, such as the Lee filter [5], the Kuan filter [6], the Frost filter [7], and the maximum a posteriori (MAP) filter [9]. On the other hand, traditional spatial domain techniques frequently over smooth details like corners and texturing, which can occasionally degrade the spatial quality of images. Such filtering techniques are simple and uncomplicated, but they do not preserve visual characteristics like brightness, strength, edges, borders, etc., and system performance is likely to be affected by the relevant terrain. Consequently, transform domain (mathematical method) filters have been developed recently and have produced excellent results. Examples include the wavelet transform [8], [9], curvelet transform [10], [11], and shearlet transform [12], [13]. Comparatively, while transform domain techniques effectively minimise speckle, they also have the potential to cause pixel distortion and spurious defects, as well as errors in the preservation of back scatter and detailed information in specific places. Despite the image's valuable local or global features, this is primarily due to the transform domain's inherent inefficiency.
Aafreen Alam1, Dr. Avinash Rai2 1Mtech Scholar RGPV Bhopal, 2Assistant Professor, RGPV Bhopal


International Journal for Research in Applied Science & Engineering Technology (IJRASET) ISSN: 2321 9653; IC Value: 45.98; SJ Impact Factor: 7.538 Volume 10 Issue VII July 2022 Available at www.ijraset.com 4835©IJRASET: All Rights are Reserved | SJ Impact Factor 7.538 | ISRA Journal Impact Factor 7.894 |
A. Extension of the symmetrical boundary
Wavelet transformation can effectively define functions or signals with localised features due to the limited support of wavelet basis functions. Then, using a wavelet based method, we reduce speckle noise. Last but not least, we found that wavelet based denoising works better than conventional speckle filters.
II. PROBLEM IDENTIFICATION
On the initial border, the denoising algorithm will use symmetrical extension. In this case, we suggest using symmetrical boundary extension rather than zero padding to increase the image size to 512 pixels by 512 pixels because symmetrical boundary extension does not significantly introduce distortion on the margins. This method involves expanding the original image's four sides before extending the remaining corners.
B. Wavelet Decomposition
The noise with unknown variance is typically believed to be stationary. Eqn.(4) represents the logarithmic transformation of y(i,j) for the purpose of evaluating the additive noise variance. ln ( , ) =ln ( , ) +ln( ( , )) (4) After applying ln(y(i,j)) to the discrete wavelet transform (DWT), thresholding is carried out. Then, as seen in Figure 1, the inverse DWT is applied, producing the opposite of the logarithmic operation. Fig.1 Block diagram for speckle SAR image denoising utilising a logarithmic transformation
When compared to Gaussian noise, the multiplicative, non Gaussian noise found in SAR images is much more challenging to eliminate. The fundamental cause of this is that noise variance varies as intensity changes. This multiplicative noise is described mathematically in eqn. (3). y(i,j)=x(i,j) n(i,j) (3) Where, ( , ) = Speckle image, ( , ) = Original image and ( , ) = non gaussian noise
The image is divided into wavelets and transformed into 2D filter banks in this step. The image's row and column are subjected to the filter bank. Applying 1D filter bank analysis to each row and column results in the creation of two sub bands, /2 and /2 The /2 rows and /2columns of each sub band are then subjected to 1D analysis.
III. METHODOLOGY
Threshold selection is used for denoising. To create the , , and sub band areas, a 2D sampled wavelet transform is used. Scale is shown here as k and j is the coarsest scale. Scale is finer when k is less. P(S) represents the parent of sub band S. Noise variance σn 2 is calculated from noisy wavelet coefficients according to the formula in eqn. (5) σ = Median(|y|) 06745 (5) Where, y is element of sub band HH σ and σ can be found by : σ = 1 N y ∈ (6) σ = 1 N y ∈ ( ) (7) Where σ and σ are Variances of y andy Using these variances signal variance σ &σ can be estimated by applying formula given as: σ = σ σ (8) θW= θ+yln(x) DWT w(.) Thresholding T(.) IDWT w T(.) exp(x)
C. Denoising Procedure


Equivalent Numbers of Looks (ENL): ENL is a performance metric that can be used to assess the level of speckle noise. Higher scores indicate higher quality. ENL is quantified mathematically as in eqn. (13). = (13) Where is the mean of the uniform region and is the standard deviation of an uniform region.
Peak Signal to Noise Ratio (PSNR): The PSNR is most frequently used as a gauge of reconstruction quality in image compression and de noising. The PSNR is determined by: =10log 255 (14) Therefore, according to equation (14), a greater PSNR value denotes improved image speckle reduction. However, in this case, for the huge speckle reduction MSE is larger.
b) Bivariate shrinkage function is applied on coefficient. Filter banks are employed during the reconstruction process. The 2D filter bank from and is used to merge the sub bands.
A. Quality Metrics
Noise Variance: A smaller variance produces a clearer image as more speckles are eliminated. The eqn. (11) provides the variance computation formula. = 1 (11) Mean Square Error (MSE): MSE is measured by computing the difference in error between the original and reconstructed pictures A higher MSE value indicates improper despeckling. It is calculated mathematically using eqn. (12). = 1 ( ) (12) Where, ^ = reconstructed image, = original image and = Size of the image.
International Journal for Research in Applied Science & Engineering Technology (IJRASET) ISSN: 2321 9653; IC Value: 45.98; SJ Impact Factor: 7.538 Volume 10 Issue VII July 2022 Available at www.ijraset.com 4836©IJRASET: All Rights are Reserved | SJ Impact Factor 7.538 | ISRA Journal Impact Factor 7.894 | σ = σ σ (9) Using bivariate shrinkage function w = y +y √3σ σ +y y +y (10) The algorithm is illustrated as: 1) Evaluate σn 2 . 2) For each wavelet co efficient.
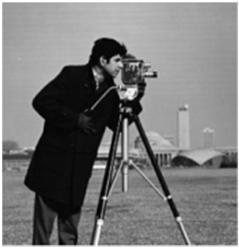
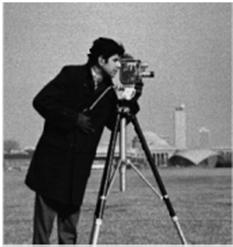
The standard photos for the 8 bit grey level (Lena, Boat, Cameraman, Airplane, Man, Peppers, and House) were used as the reference images in this study. Speckle noise was added to each image to test the effectiveness of the image noise reduction technique.
a) Calculate σ , signal variance.
There are many different assessment metrics that are used to evaluate the effectiveness of speckle reduction systems. The sections that follow discuss several important factors.
IV. RESULTS AND DISCUSSION
NIQE_diff: The Natural Image Quality Evaluator (NIQE) is a performance metric used to gauge the quality of images. The NIQE diff is used to determine the quality difference between an original image and a denoised or reconstructed image. It is assessed mathematically according to Equation (15): = ( ) ( ) (15) B. Result Analysis
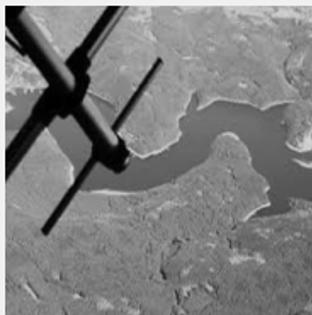
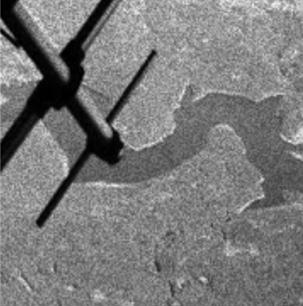
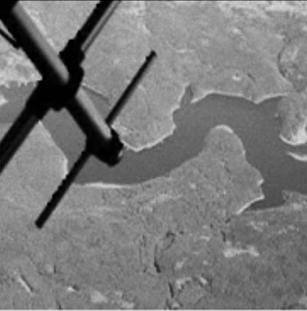
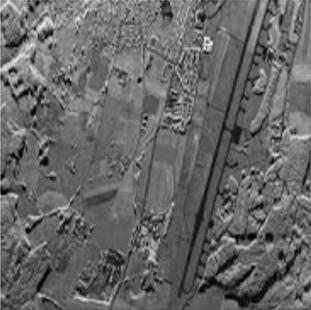
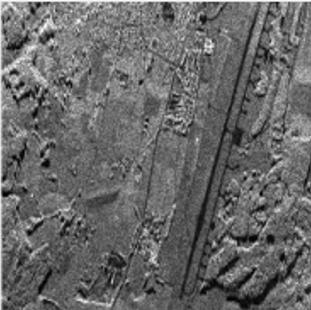
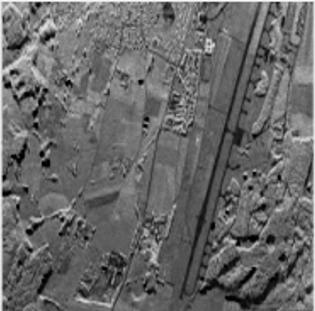
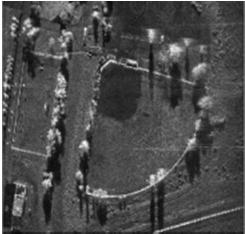
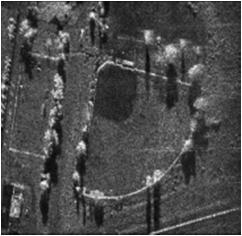
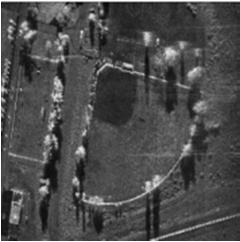
International Journal for Research in Applied Science & Engineering Technology (IJRASET) ISSN: 2321 9653; IC Value: 45.98; SJ Impact Factor: 7.538 Volume 10 Issue VII July 2022 Available at www.ijraset.com 4837©IJRASET: All Rights are Reserved | SJ Impact Factor 7.538 | ISRA Journal Impact Factor 7.894 | These photos demonstrated the traits of multiplicative noise that followed the Rayleigh distribution. All image processing was carried out in MATLAB (R2020). The suggested algorithm is contrasted to conventional filtering approaches as Gaussian, Frost, SRAD, Bitonic filters, K SVD and Pre processing Filter, and Discrete Wavelet Transform Based Noise Reduction Technique algorithm to assess the efficacy of speckle noise reduction. Fig. 3 presents some of the test findings for the suggested methodology. The suggested wavelet based bivariate shrinking methodology is compared with other techniques in Tables I and II. Bivariate Shrinkage Function provides the lowest noise variance among common filterImageOriginaltechniques. Noisy Image ImageDenoised Fig. 3. The test images (left) original, (centre) under noise and (right) after filtration Table 1. Comparative Performance Analysis Image (size) Measure Noisy Gaussian K SVD Frost SRAD Bitonic Previous Proposed (512Lenax 512) RMSE 30.31 13.49 15.18 17.40 11.85 13.31 8.18 7.50 PSNR (dB) 18.50 25.53 24.51 23.32 26.65 25.65 29.88 29.90 SSIM 0.27 0.70 0.56 0.45 0.72 0.75 0.81 0.82 (512Boat x 512) RMSE 31.66 13.86 16.37 19.54 11.20 14.53 10.93 9.5 PSNR (dB) 18.12 25.30 23.85 22.31 27.15 24.89 27.36 28.2 SSIM 0.32 0.65 0.53 0.43 0.70 0.64 0.72 0.85 (256Cameramanx256) RMSE 31.05 19.14 18.21 19.96 12.20 18.77 11.84 9.36 PSNR (dB) 18.29 22.49 22.92 22.13 26.41 22.66 26.66 27.54 SSIM 0.41 0.61 0.50 0.47 0.70 0.69 0.77 0.79 (256Housex 256) RMSE 33.05 13.90 18.09 19.52 10.28 12.15 9.37 9.24 PSNR (dB) 17.75 25.27 22.98 22.32 27.89 26.44 28.69 28.75

[3] Argenti, F., Bianchi, T., &Alparone, L. (2006). Multiresolution MAP despeckling of SAR images based on locally adaptive generalized Gaussian pdf modeling. IEEE Transactions on Image Processing, 15(11), 3385 3399. https://doi.org/10.1109/TIP.2006.881970.
[7] Frost, V. S., Stiles, J. A., Shanmugan, K. S., & Holtzman, J. C. (1982). A Model for Radar Images and Its Application to Adaptive Digital Filtering of Multiplicative Noise. IEEE Transactions on Pattern Analysis and Machine Intelligence, PAMI 4(2), 157 166. https://doi.org/10.1109/TPAMI.1982.4767223.
I express my heartfelt and profound gratitude to Dr. Sudhir Singh Bhadauria (Director), University Institute of Technology Rajiv Gandhi Proudyogiki Vishwavidyalaya, Bhopal for help and Encouragement at all the stages of my thesis work. Finally, I would like to say that I am indebted to my parents and friends for everything that they have done for me. All of this would have been impossible without their constant support. I also thanks to God for being kind to me and driving me through this journey.
[8] Gleich, D., Kseneman, M., &Datcu, M. (2010). Despeckling of terraSAR X data using second generation wavelets. IEEE Geoscience and Remote Sensing
I express my ardent and earnest gratitude to my guide Dr. Avinash Rai, Department of Electronics & Communication Engineering, University Institute of Technology Rajiv Gandhi Proudyogiki Vishwavidyalaya, Bhopal for help and Encouragement at all the stages of my thesis work. I express my heartfelt and profound gratitude to Prof Dr. Sanjay K. Sharma, Head Of Department Electronics & Communication Engineering, University Institute of Technology Rajiv Gandhi Proudyogiki Vishwavidyalaya, Bhopal for help and Encouragement at all the stages of my thesis work.
This research paper is the result of guidance and support of various people at University Institute of Technology, Rajiv Gandhi Proudyogiki Vishwavidyalaya Bhopal, without whom all my effort would have been directionless and fruitless. I sincerely thank all of them, for supporting me in completing the thesis work.
[1] Achim, A., Tsakalides, P., &Bezerianos, A. (2003). SAR image denoising via Bayesian wavelet shrinkage based on heavy tailed modeling. IEEE Transactions on Geoscience and Remote Sensing, 41(8), 1773 1784. https://doi.org/10.1109/TGRS.2003.813488
International Journal for Research in Applied Science & Engineering Technology (IJRASET) ISSN: 2321 9653; IC Value: 45.98; SJ Impact Factor: 7.538 Volume 10 Issue VII July 2022 Available at www.ijraset.com 4838©IJRASET: All Rights are Reserved | SJ Impact Factor 7.538 | ISRA Journal Impact Factor 7.894 | SSIM 0.24 0.64 0.53 0.37 0.68 0.73 0.77 0.80 (1024x1024)Man RMSE 24.68 10.81 13.53 15.03 8.83 11.76 8.63 7.69 PSNR (dB) 20.28 27.45 25.50 24.59 29.21 26.72 29.41 29.80 SSIM 0.47 0.73 0.62 0.58 0.77 0.70 0.79 0.90 Table 2. ENL Comparative Analysis Measure Noisy Gaussian K SVD Frost SRAD Bitonic Previous Proposed ENL 31.41 163.82 340.33 88.80 156.74 260.18 246.17 357.35 50.49 96.03 255.18 106.57 159.14 213.23 210.88 328.59 V. CONCLUSION In this study, the wavelet transform is used to scale the image, eliminate speckle noise, and create a multi resolution representation. The paper uses a bivariate shrinkage function in combination with wavelet decomposition at various noise variance levels to achieve this. The outcome is assessed based on various performance metrics and contrasted with some already in use strategies. Results allow for the development of more efficient approach. Future research can expand on this work by using dual tree complex wavelet transforms to denoise and de blur multiple resolution images.
[2] Zhao, Q., Wu, S., Zhang, Z., Sun, Y., Fu, Y., & Wang, H. (2021). SAR Image Noise Reduction Based on Wavelet Transform and DnCNN. 1 4. https://doi.org/10.23919/CISS51089.2021.9652335.
VI. ACKNOWLEDGMENT
[4] Castaneda, R., Garcia Sucerquia, J., &Doblas, A. (2021). Speckle noise reduction in coherent imaging systems via hybrid median mean filter. https://doi.org/10.1117/1.OE.60.12.123107.
[5] Chen, G., Li, G., Liu, Y., Zhang, X. P., & Zhang, L. (2018). SAR image despeckling by combination of fractional order total variation and nonlocal low rank regularization. Proceedings International Conference on Image Processing, ICIP, 2017 September, 3210 3214. https://doi.org/10.1109/ICIP.2017.8296875.
[6] Choi, H., &Jeong, J. (2018). Despeckling images using a preprocessing filter and discrete wavelet transform based noise reduction techniques. IEEE Sensors Journal, 18(8), 3131 3139. https://doi.org/10.1109/JSEN.2018.2794550.
REFERENCES
International Journal for Research in Applied Science & Engineering Technology (IJRASET)
[15] Khare, S., & Kaushik, P. (2021). Speckle filtering of ultrasonic images using weighted nuclear norm minimization in wavelet domain. Biomedical Signal Processing and Control, 70, 102997. https://doi.org/10.1016/J.BSPC.2021.102997.
[19] Liu, S., Shi, M., Hu, S., & Xiao, Y. (2014). Synthetic aperture radar image de noising based on Shearlet transform using the context based model. Physical Communication, 13(PC), 221 229. https://doi.org/10.1016/J.PHYCOM.2014.02.002.
[9] Guan, D., Xiang, D., Hu, C., & Zhong, Z. (2019). Sar Image Despeckling with the Multi Scale Nonlocal Low Rank Model. International Geoscience and Remote Sensing Symposium (IGARSS), 2941 2944. https://doi.org/10.1109/IGARSS.2019.8899791.
[20] Rahimizadeh, N., Hasanzadeh, R. P., &Janabi Sharifi, F. (2020). An optimized non local LMMSE approach for speckle noise reduction of medical ultrasound images. Multimedia Tools and Applications 2020 80:6, 80(6), 9231 9253. https://doi.org/10.1007/S11042 020 10051 Z.
[26] Wang, B. H., Zhao, C. Y., & Liu, Y. Y. (2018). An improved SAR interferogram denoising method based on principal component analysis and the Goldstein filter. Remote Sensing Letters, 9(1), 81 90. https://doi.org/10.1080/2150704X.2017.1392633
[17] Kuan, D. T., Sawchuk, A. A., Strand, T. C., &Chavel, P. (1985). ADAPTIVE NOISE SMOOTHING FILTER FOR IMAGES WITH SIGNAL DEPENDENT NOISE. IEEE Transactions on Pattern Analysis and Machine Intelligence, PAMI 7(2), 165 177. https://doi.org/10.1109/TPAMI.1985.4767641.
4839
[12] Hou, B., Zhang, X., Bu, X., & Feng, H. (2012). SAR image despeckling based on nonsubsampled shearlet transform. IEEE Journal of Selected Topics in Applied Earth Observations and Remote Sensing, 5(3), 809 823. https://doi.org/10.1109/JSTARS.2012.2196680.
[18] Lee, J. Sen. (1980). Digital Image Enhancement and Noise Filtering by Use of Local Statistics. IEEE Transactions on Pattern Analysis and Machine Intelligence, PAMI 2(2), 165 168. https://doi.org/10.1109/TPAMI.1980.4766994.
ISSN: 2321 9653; IC Value: 45.98; SJ Impact Factor: 7.538 Volume 10 Issue VII July 2022 Available at www.ijraset.com ©IJRASET: All Rights are Reserved | SJ Impact Factor 7.538 | ISRA Journal Impact Factor 7.894 | Letters, 7(1), 68 72. https://doi.org/10.1109/LGRS.2009.2020610.
[25] Sujitha, A. G., Vasuki, D. P., & Deepan, A. A. (2019). Hybrid Laplacian Gaussian Based Speckle Removal in SAR Image Processing. Journal of Medical Systems, 43(7). https://doi.org/10.1007/S10916 019 1299 0.
[13] Jain, L., & Singh, P. (2020). A novel wavelet thresholding rule for speckle reduction from ultrasound images. Journal of King Saud University Computer and Information Sciences https://doi.org/10.1016/J.JKSUCI.2020.10.009
[28] Yan, P., Chen, C., & Chen, C. (2005). An algorithm for filtering multiplicative noise in wide range Un algorithme pour le filtrage du bruit multiplicatif
[24] Singh, P., Shree, R., & Diwakar, M. (2021). A new SAR image despeckling using correlation based fusion and method noise thresholding. Journal of King Saud University Computer and Information Sciences, 33(3), 313 328. https://doi.org/10.1016/J.JKSUCI.2018.03.009.
[27] Yahia, M., Ali, T., Mortula, M. M., Abdelfattah, R., Mahdy, S. El, &Arampola, N. S. (2020). Enhancement of SAR Speckle Denoising Using the Improved Iterative Filter. IEEE Journal of Selected Topics in Applied Earth Observations and Remote Sensing, 13, 859 871. https://doi.org/10.1109/JSTARS.2020.2973920
[14] Jain, V., Shitole, S., Turkar, V., & Das, A. (2020). Impact of DFT based speckle reduction filter on classification accuracy of synthetic aperture radar images. 2020 IEEE India Geoscience and Remote Sensing Symposium, InGARSS 2020 Proceedings, 54 57. https://doi.org/10.1109/INGARSS48198.2020.9358943.
[10] Guan, D., Xiang, D., Tang, X., &Kuang, G. (2019). SAR Image Despeckling Based on Nonlocal Low Rank Regularization. IEEE Transactions on Geoscience and Remote Sensing, 57(6), 3472 3489. https://doi.org/10.1109/TGRS.2018.2885089.
APPLICATIONS
[21] Ranjani, J. J., &Thiruvengadam, S. J. (2010). Dual tree complex wavelet transform based sar despeckling using interscale dependence. IEEE Transactions on Geoscience and Remote Sensing, 48(6), 2723 2731. https://doi.org/10.1109/TGRS.2010.2041241.
[23] Shang, R., Liu, M., Lin, J., Feng, J., Li, Y., Stolkin, R., & Jiao, L. (2022). SAR Image Segmentation Based on Constrained Smoothing and Hierarchical Label Correction. IEEE Transactions on Geoscience and Remote Sensing, 60. https://doi.org/10.1109/TGRS.2021.3076446.
[22] Rebar Ihsan, R., Almufti, S. M., &Marqas, R. B. (2020). A Median Filter With Evaluating of Temporal Ultrasound Image for Impulse Noise Removal for Kidney Diagnosis. Journal of Applied Science and Technology Trends, 1(2), 71 77. https://doi.org/10.38094/jastt1217
[11] Geng, J., Fan, J., Ma, X., Wang, H., & Cao, K. (2016). An iterative low rank representation for SAR image despeckling. International Geoscience and Remote Sensing Symposium (IGARSS), 2016 November, 72 75. https://doi.org/10.1109/IGARSS.2016.7729009.
[16] Ko, J., & Lee, S. (2022). SAR Image Despeckling Using Continuous Attention Module. IEEE Journal of Selected Topics in Applied Earth Observations and Remote Sensing, 15, 3 19. https://doi.org/10.1109/JSTARS.2021.3132027.