10 XII December 2022 https://doi.org/10.22214/ijraset.2022.48230
ISSN: 2321-9653; IC Value: 45.98; SJ Impact Factor: 7.538 Volume 10 Issue XII Dec 2022- Available at www.ijraset.com

ISSN: 2321-9653; IC Value: 45.98; SJ Impact Factor: 7.538 Volume 10 Issue XII Dec 2022- Available at www.ijraset.com
2
Salonica Jennifer1, Basavalingappa , Veereshaiah H.M3, GurupadaSwamy N.M41
PG Scholar, Dept. of Civil engineering, Rao Bahadur Y Mahabaleswarappa Engineering College2, 3, 4Assistant Professor, Dept. of Civil engineering, Rao Bahadur Y Mahabaleswarappa Engineering College

Abstract: Sand and cement, which go into making concrete, is in great demand because it is a crucial building material. Due to this demand, environmental degradation is rising during the production of cement and river basins are running out of sand. Concrete is being updated with suitable substitutes without sacrificing its durability and strength. Fly ash and M sand are used in this study as alternatives to cement and fine aggregates, respectively. Fly ash is by product of combustion process; hence utilizing this product in concrete can be advantageous to both the environment and cost considerations. Whereas M sand is obtained by crushing aggregates into desirable sizes which can benefit workability of concrete .The percentage of these alternatives for which partial replacement results in higher test values is indicated in this study. Super plasticizer was used in testing on newly laid concrete. M 45 grade concrete mix design as per IS 10262:2019 is calculated. Testing was done on M45 grade fresh concrete for workability: slump cone test, compaction factor test, vee bee consist-meter test, as well as hardened concrete for compression strength, tensile strength, and flexural strength. The tests were conducted for variable percentages of fly ash and M sand by weight of cement and natural sand replacement. In this study natural sand is replaced with M sand in 0, 10, 20, 30, 40 & 50% for every 0%, 10% & 15% replacement of fly ash with cement. Satisfying results were found for 10% fly ash and 40% M sand mix for both workability tests and strength tests conducted in the specimen.
Concrete is an essential building material that you can use to enhance the strength of your building.The major raw material for concrete production is limestone & natural sand which are coming with cost to both environmentally & financially. Due to rapid urbanization of developing nations and the upkeep of structures in developed nations, there is a high demand for high-quality concrete at the same time. Therefore, the production of concrete can be made more sustainable by substituting some concrete constituents with industrial waste, since these substitutes are already produced but still disposed. On the other hand, the addition of discussed industrial wastes has been shown to improve the properties of concrete: strength and workability. Sand is currently very expensive. Large-scale market introductions of materials like artificial sand have significantly lessened the cost burden of river sand on concrete. It makes sense for the world to use industrial wastes, such as slag, fly ash, etc., to partially replace fine aggregates.
When lignite or pulverised coal is burned, a significant amount of by- product is formed in thermal power plants, due to the high burning temperature of the coal, the fragmented particles that become molten and then solidify are generally spherical particles known as Fly ash. Fly ash is fine spherical silt sized (10-100 μ) solid residual, which could be transported easily by flue gases and deposited at electro- filters. About 80% of the ash residue produced is carried by flue gases and subsequently collected by electrostatic precipitators that are installed in chimneys to decrease air pollution. The remaining 20% of the residual is at the bottom forming bottom ash. Fly ash, hopper ash, or chimney ash are all terms used to describe the ash that is collected at the top of the chimney. Fly ash is made up of organic components like unborn carbon and inorganic substances like silica and alumina. The fly ash's mineral makeup and particle sizes have a big impact on its pozzolonic properties.
1) Improved workability: The shape of particles is spherical hence they act as small ball bearings in concrete as lubricants.
2) Lowered water demand: Fly ash, which accounts for around 20% of the cementitious material, reduces water demand by about 10%.
ISSN: 2321-9653; IC Value: 45.98; SJ Impact Factor: 7.538
Volume 10 Issue XII Dec 2022- Available at www.ijraset.com
3) Reduced heat of hydration: Concrete's hydration heat can be reduced by using fly ash.
4) Improved ultimate strength: Fly ash concrete gains strength over time as a result of growing binder resulted by the interaction of the fly ash with available lime.
5) Reduced permeability: Because of the improved binder produced by the interaction between the fly ash and easily accessible lime, fly ash concrete gets stronger over time.
6) Improved resistance to corrosion: The corrosion resistance is increased by the decrease in permeability.
M Sand is manufactured sand used in cement or concrete construction that is made by crushing rocks or granite. Natural sources for sand such as river sand, stream sand, pit sand, sea sand and other sands, for use as aggregate in construction are becoming scarce and exhausted as a result of environmental deterioration. M Sand was developed in response to a rising need in the building sector for alternative aggregates. Another argument in favour of its utilisation is the active availability of M sand, which cuts down on pollutants and transit times. M Sand is a better option than river sand since it is manufactured by machines in the correct ratios of particle size.
1) Greater Durability: M Sand can withstand challenging environmental conditions and has balanced physical and chemical characteristics.
2) Higher Strength: M Sand doesn't contain any elongated or flaky particles and has a smooth surface texture thanks to the usage of a VSI shaping machine.
3) Greater Workability: Mortar has outstanding workability due to its cubical shape and correct gradation, which calls for particles to range in size from 150 microns to 4.75 mm.
4) Economy: Waste is nonexistent because M Sand doesn't have any contaminants like river sand does. Given that it is easily accessible, the cost of transportation also decreases.
The goal is to determine the strength parameters to efficiently utilize fly ash and M sand in the mix as it decreases the environmental effect and also can be made cost effective as well as not compromising with the durability and strength parameters. In this study natural sand is replaced with M sand in 0, 10, 20, 30, 40 & 50% for every 0%, 10% & 15% replacement of fly ash with cement. Tests such as compressive strength test, split tensile test & flexural strength test are conducted. Workability tests such as vee bee consist-meter test, compaction factor test and slump cone test are as well conducted on fresh concrete. Both fly ash & M sand have been studied as potential partial replacements in concrete. In the current study, the behaviour of concrete is made by swapping out traditional components for the right proportion of these alternates is examined. Tests for workability and strength are used to see the impact of the fly ash and M sand.
1) Cement: OPC 43 grade cement was used with the properties listed below
TABLE -1: Properties of Cement Material Properties Results
Specific Gravity 3.15
Fineness 4%
Normal Consistency 34%
Initial setting time 45 min
Final setting time 5 hrs 50 min
ISSN: 2321-9653; IC Value: 45.98; SJ Impact Factor: 7.538 Volume 10 Issue XII Dec 2022- Available at www.ijraset.com
2) Fly Ash: Class F dry fly ash with properties below
TABLE -2: Properties of Fly ash
Seive size(μ) Weight retained (gms) % passing 90 95 92% 75 122 83% 45 704 62% Specific Gravity 2.2
TABLE -3: Properties of Fine aggregates
Sieve size(μ) Cumulative % passing Specifications of zone II (IS:383-1970) 4.75mm 100 90-100 2.36mm 98 75-100 1.18mm 83 55-90 600 55 35-59 300 16 8-30 150 2 0-10 Pan 0 0 Specific Gravity 2.65 Bulk Density 1765 Kg/m3 Water Absorption 1.0%
IS Sieve Size in mm
TABLE -4: Properties of Coarse aggregates
% passing of CA % passing of different fractions Specifications as per IS: 3831970 I (20mm) II (12.5mm) I 60% II 40% Combined 100% graded Single sized I II 20 100 100 60 40 100 95-100 85-10012.5 0 98.50 0 0 0 - - 85-100 10 0 32.20 0 29.50 29.50 25-55 0-20 0-45 4.75 0 8.40 0 4.10 4.10 0-10 0-5 0-10
Specific Gravity = 2.74 Bulk Density = 1732 Kg/m³ Water Absorption = 0.5%
ISSN: 2321-9653; IC Value: 45.98; SJ Impact Factor: 7.538 Volume 10 Issue XII Dec 2022- Available at www.ijraset.com
A. M45 grade concrete mix design (As per IS: 10262 – 2019)
1) Target mean strength : f ’ck = fck 1.65 s = 45 1.65 5 => f’ck = 53.25 N/mm2 . W/C = 0.45< 0.60( Fig. 1 of IS 10262:2019)
2) Determination of water content : =186 + [8.4/100*186] =201.62kg( 120mm slump) Water content = 201.62 x 0.77 = 155.25 Kg ( Super plasticizer is used)
3) Determination of cement content:
Cement = = => Cement content =345 Kg/m³
Cemenetitious material content = 345 x 1.10 = 379 Kg/m³ W/C = = 0.41
Total cementitious material content = 379 x 30% = 113.85 Kg/m³(Fly ash @ 30%)
Cement = 379 – 113.85 = 265.65 Kg/m³ Cement content = 379 Kg/m3> 240 Kg/m3( T-5 IS 456-2000)
4) Quantity of Coarse & fine aggregates: for W/C =0.41, = 0.62 + 0.019 ( correction applied) coarse aggregate corrected volume = 0.639 m³ for fine aggregate = 1.00 0.639 fine aggregate corrected volume = 0.361 m³
B. Mix Design Calculations per Unit Volume
1) Concrete volume = 1.00 m3
2) Wet concrete entrapped air volume = 0.01 m3 3) Cement volume = = = 0.08 m3
4) Volume of fly ash = = = 0.052 m3 5) Volume of water = = = 0.155 m3 6) Chemical admixture volume = = = 0.003 m3 7) Volume of all in aggregate = [(1-0.01) (0.08+0.052+0.155+0.003 = 0.70 m3
8) Mass of CA = g CA corrected volume Sp gty of CA 1000 = 0.70 0.639 2.74 1000 = 1217.47 Kg 9) Mass of FA = g FA corrected volume Sp gty of FA 1000 = 0.70 0.361 2.65 1000 = 665.21 Kg
TABLE-5 Mix proportion
Cement (Kg/m3) Fine aggregate (Kg/m3) Coarse aggregate (Kg/m3)
Water (Kg/m3) Fly ash (Kg/m3) Chemical admixture (Kg/m3) 265.65 665.21 1217.7 155.25 113.85 3.79
ISSN: 2321-9653; IC Value: 45.98; SJ Impact Factor: 7.538 Volume 10 Issue XII Dec 2022- Available at www.ijraset.com
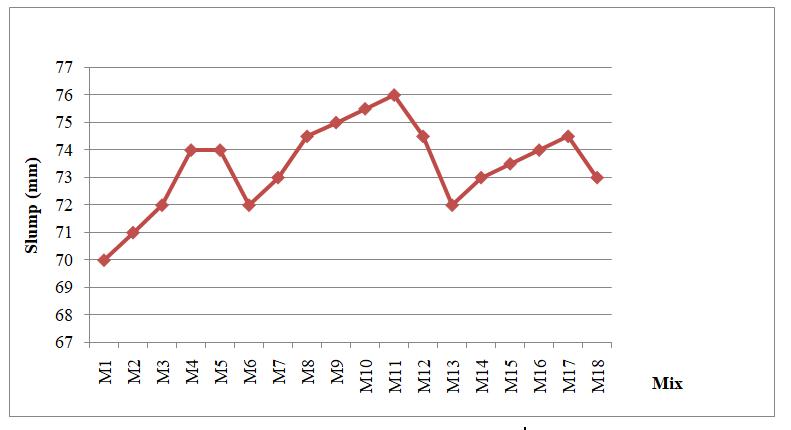
TABLE -6: Variation of Slump values
Sl N o
% replaceme nt of Fly Ash with OPC
% replacement of natural sand with M sand
Slump values(m m)
M1 0 0 70.00
M2 0 10 71.00
M3 0 20 72.00
M4 0 30 74.00
M5 0 40 74.00
M6 0 50 72.00
M7 10 0 73.00
M8 10 10 74.50 M9 10 20 75.00
M10 10 30 75.50 M11 10 40 76.00
M12 10 50 74.50
M13 15 0 72.00
M14 15 10 73.00
M15 15 20 73.50
M16 15 30 74.00 M17 15 40 74.50 M18 15 50 73.00
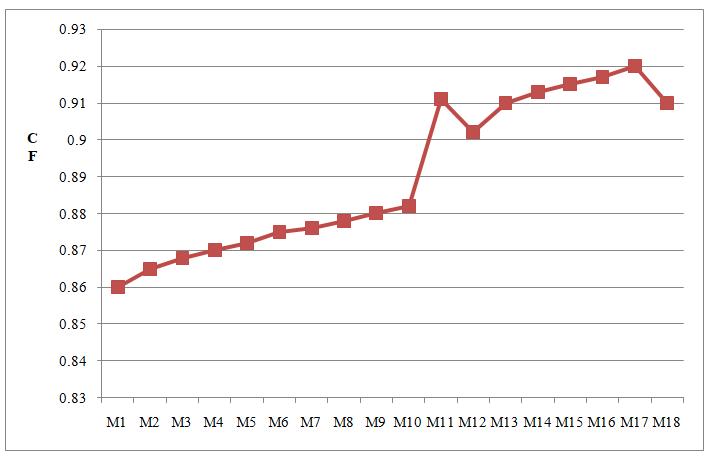
TABLE -7: Variation of Compaction factor values
Sl No. % replacement of Fly Ash with OPC
% replacement of natural sand with M sand
Compaction Factor (CF)
M1 0 0 0.860
M2 0 10 0.865 M3 0 20 0.868 M4 0 30 0.870 M5 0 40 0.872 M6 0 50 0.875
M7 10 0 0.876
M8 10 10 0.878
M9 10 20 0.880
M10 10 30 0.882
M11 10 40 0.911
M12 10 50 0.902
M13 15 0 0.910
M14 15 10 0.913
M15 15 20 0.915
M16 15 30 0.917
M17 15 40 0.920
M18 15 50 0.910
CHART -1: Variation of Slump values
CHART -2: Variation of CF values
Sl N o
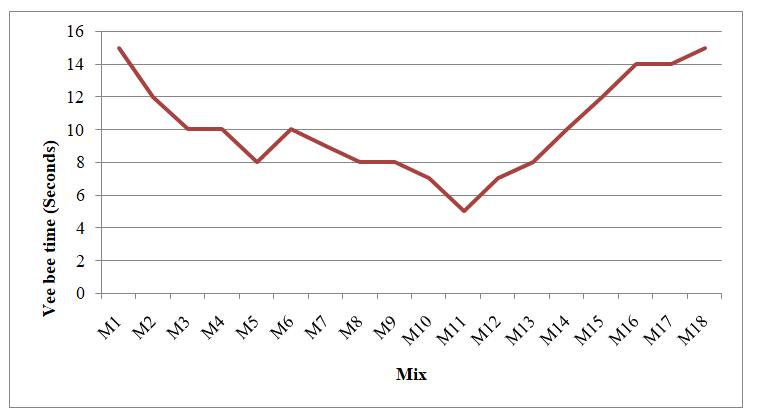
TABLE -8: Variation of Vee Bee time
% replacement of Fly Ash with OPC
% replacement of natural sand with M sand
Vee – Bee time ( sec)
M1 0 0 15
M2 0 10 12 M3 0 20 10 M4 0 30 10 M5 0 40 8 M6 0 50 10 M7 10 0 9 M8 10 10 8 M9 10 20 8
M10 10 30 7 M11 10 40 5 M12 10 50 7 M13 15 0 8 M14 15 10 10 M15 15 20 12 M16 15 30 14 M17 15 40 14 M18 15 50 15
B. Results Of Tests On Hardened Concrete
TABLE -9: Variation of Compressive strength at 7 days
Sl. No. Specimen Failure load (kN )
Compressive strength (MPa)
1. F 0% – M 0%(RM) 698 31.00
2. F 0% – M 10% 743 33.00 3. F 0% – M 20% 754 33.50 4. F 0% – M 30% 765 34.00 5 F 0% – M 40% 788 35.00 6. F 0% – M 50% 743 33.00
7. F 10% – M 0% 802 35.65
8. F 10% – M 10% 854 37.95 9. F 10% – M 20% 867 38.525 10. F 10% – M 30% 880 39.10 11. F 10% – M 40% 906 40.25 12. F 10% – M 50% 854 37.95
13. F 15% – M 0% 729 31.372 14. F 15% – M 10% 752 33.396 15. F 15% – M 20% 763 33.902 16. F 15% – M 30% 775 34.408 17. F 15% – M 40% 797 35.42 18. F 15% – M 50% 752 33.396
ISSN: 2321-9653; IC Value: 45.98; SJ Impact Factor: 7.538 Volume 10 Issue XII Dec 2022- Available at www.ijraset.com
CHART -3: Variation of Vee Bee time
CHART-4: Variation of Compressive strength at 7 days
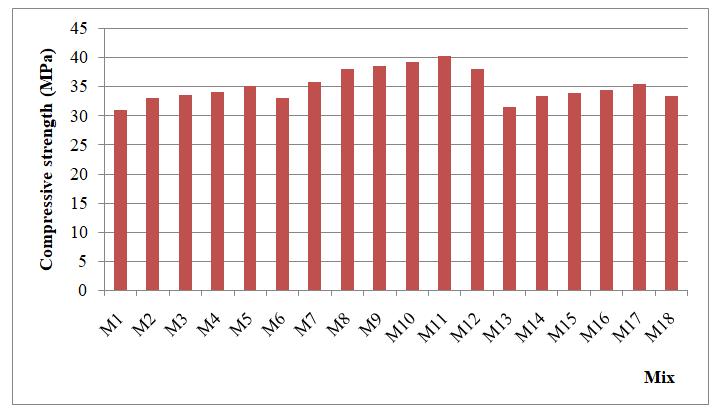
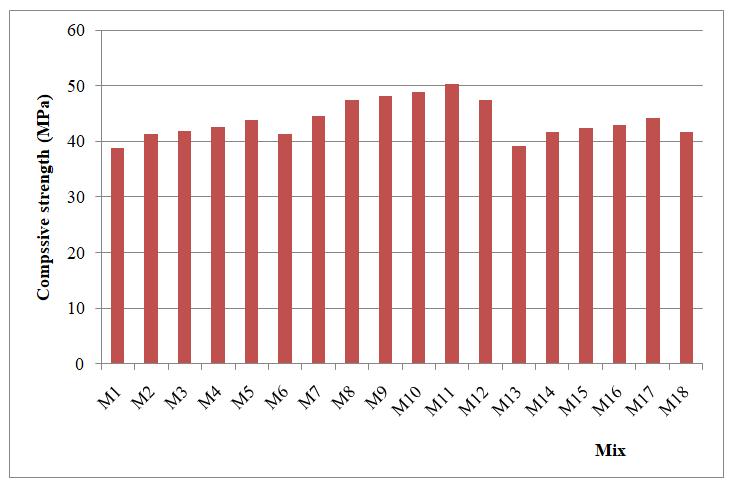
TABLE -10: Variation of Compressive strength at 28 days
Sl. N o
Specimen Failure load( kN )
Compressive strength (MPa)
1. F 0% – M0%(RM) 872 38.75
2. F 0% – M 10% 929 41.25
3. F 0% – M 20% 943 41.875
4. F 0% – M 30% 957 42.51
5. F 0% – M 40% 985 43.75
6. F 0% – M 50% 929 41.25
7. F 10% – M 0% 1003 44.56
8. F 10% – M 10% 1067 47.43
9. F 10% – M 20% 1083 48.15
10. F 10% – M 30% 1100 48.87
11. F 10% – M 40% 1132 50.31
12. F 10% – M 50% 1067 47.43
13. F 15% – M 0% 882 39.21
14. F 15% – M 10% 940 41.74
15. F 15% – M 20% 954 42.37
16. F 15% – M 30% 968 43.01
17. F 15% – M 40% 996 44.27
18. F 15% – M 50% 940 41.74
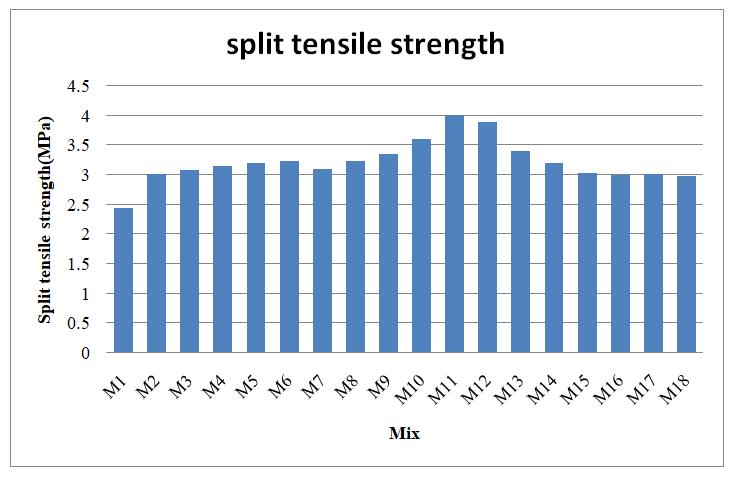
TABLE -11: Variation of Split tensile strength
Sl. N o .
Specimen
Failure load ( kN) Split tensile strength (MPa)
1. F 0% – M 0%(RM) 174 2.45
2. F 0% – M 10% 213 3.01
3. F 0% – M 20% 218 3.08
4. F 0% – M 30% 223 3.15
5. F 0% – M 40% 227 3.20
6. F 0% – M 50% 229 3.24
7. F 10% – M 0% 220 3.10
8. F 10% – M 10% 229 3.24
9. F10% – M 20% 237 3.35
10. F 10% – M 30% 255 3.60
11. F 10% – M 40% 284 4.01
12. F 10% – M 50% 276 3.90
13. F 15% – M 0% 241 3.40
14. F 15% – M 10% 227 3.21
15. F 15% – M 20% 215 3.03
16. F 15% – M 30% 213 3.00
17. F 15% – M 40% 213 3.01
18. F 15% – M 50% 211 2.98
ISSN: 2321-9653; IC Value: 45.98; SJ Impact Factor: 7.538
Volume 10 Issue XII Dec 2022- Available at www.ijraset.com
CHART-5:Variation of Compressive strength at 28 days
CHART-6: Variation of Split tensile strength of concrete
Factor 7.894
ISSN: 2321-9653; IC Value: 45.98; SJ Impact Factor: 7.538 Volume 10 Issue XII Dec 2022- Available at www.ijraset.com
TABLE -12: Variation of flexural strength
Sl. N o. Specimen Failure load (kN)
Flexural strength (MPa)
1. F 0% – M 0%(RM) 14.50 5.8
2. F 0% – M 10% 15.25 6.1
3. F 0% – M 20% 16.25 6.5
4. F 0% – M 30% 17.00 6.8
5. F 0% – M 40% 18.75 7.5
6. F 0% – M 50% 18.25 7.3
7. F 10% – M 0% 16.00 6.4
8. F 10% – M 10% 17.00 6.8
9. F 10% – M 20% 17.50 7.0
10. F 10% – M 30% 18.25 7.3
11. F 10% – M 40% 19.25 7.7
12. F 10% – M 50% 18.75 7.5
13. F 15% – M 0% 17.50 7.0
14. F 15% – M 10% 16.75 6.7
15. F 15% – M 20% 16.50 6.6
16. F 15% – M 30% 15.75 6.3
17. F 15% – M 40% 15.00 6.0
18. F 15% – M 50% 14.75 5.9
CHART-7: Variation of flexural strength of concrete
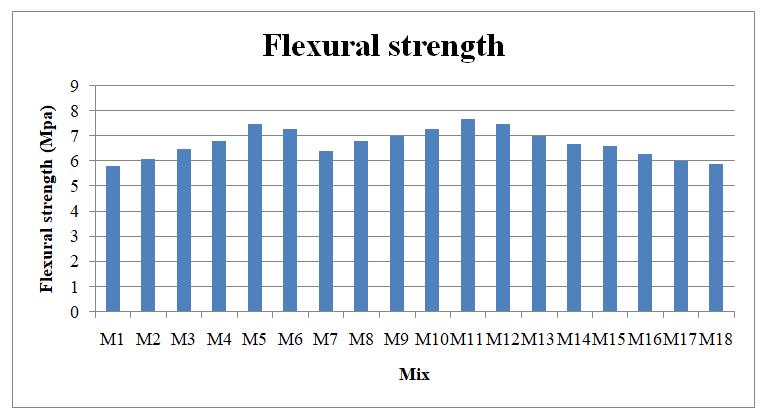
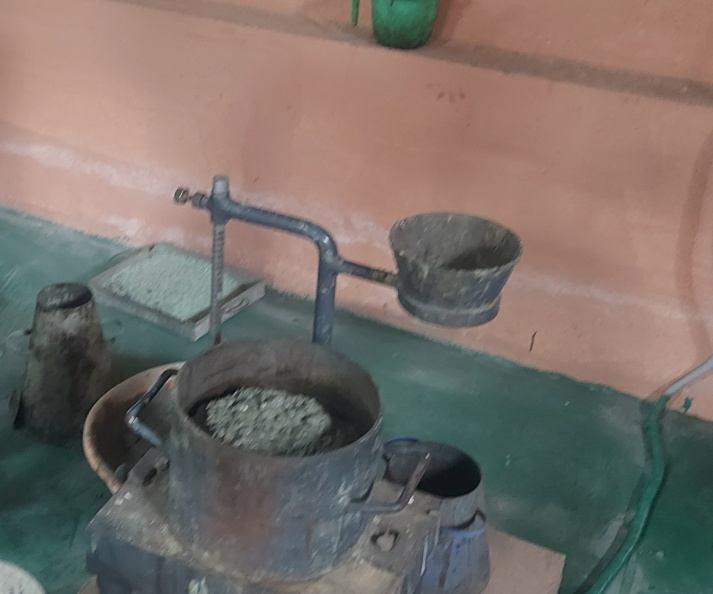
Fig -1: Vee bee consistometer test
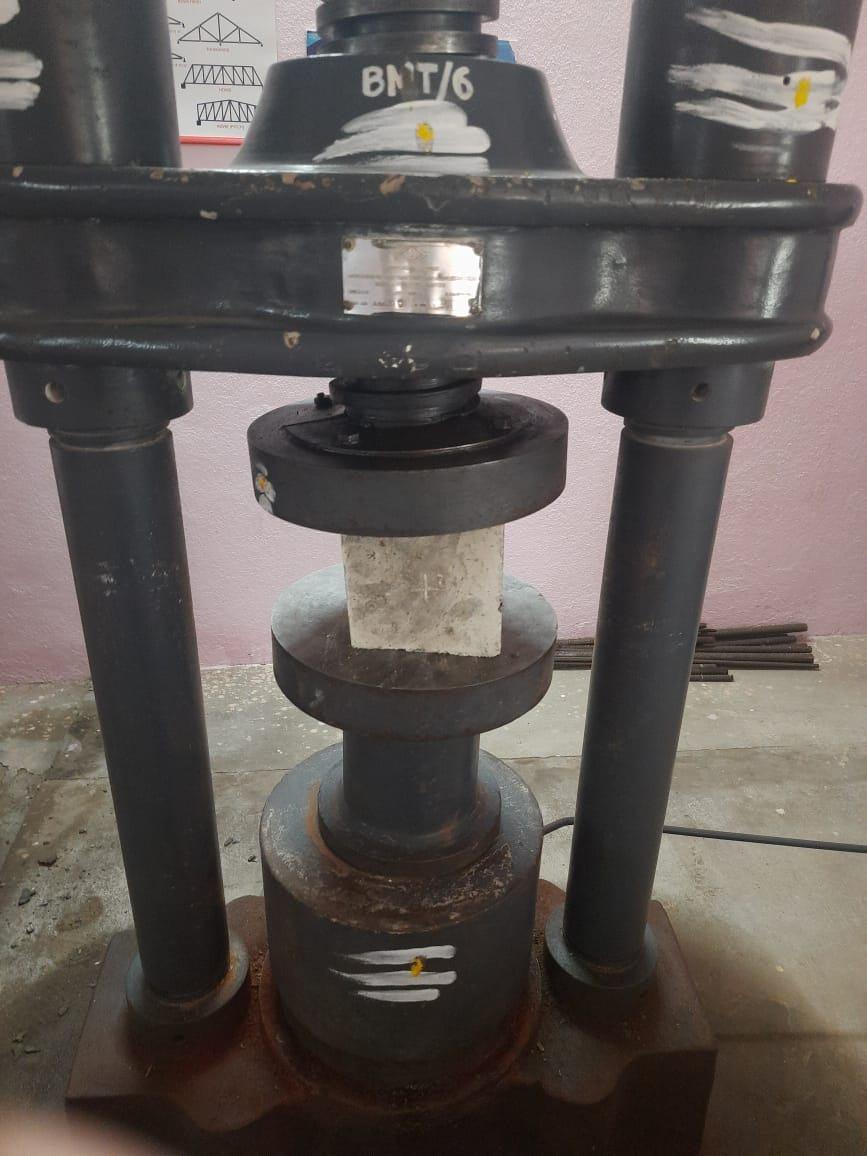
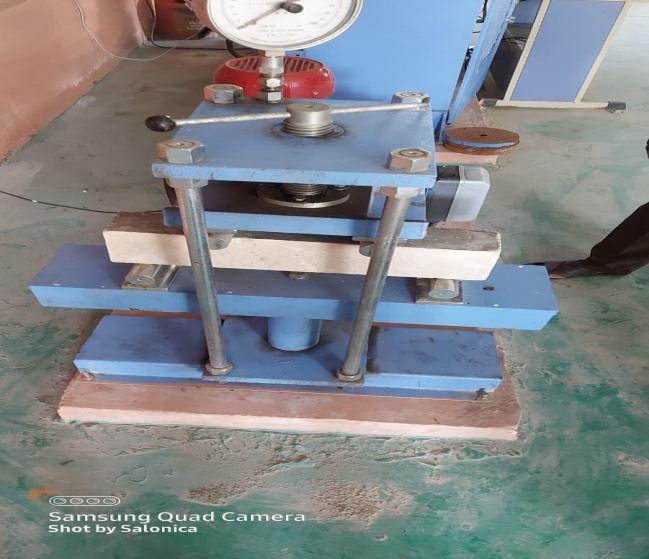
Fig -2: compression test
ISSN: 2321-9653; IC Value: 45.98; SJ Impact Factor: 7.538 Volume 10 Issue XII Dec 2022- Available at www.ijraset.com
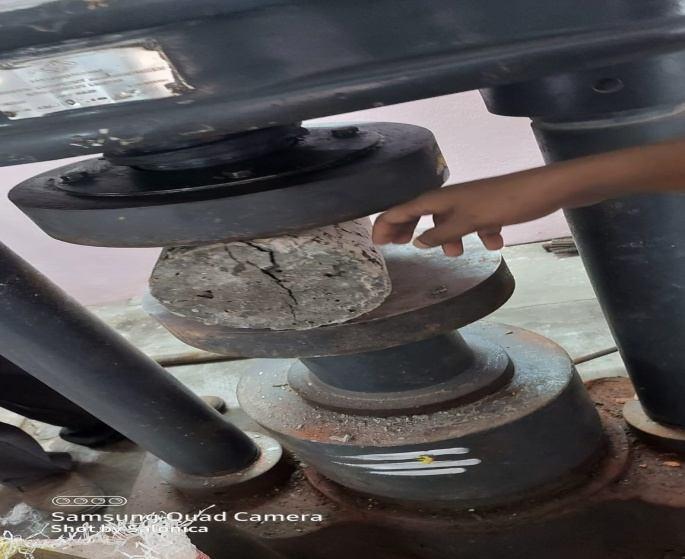
Fig -3: Split tensile test
Fig 4: Flexural test
A. Workability goes on increasing up to 40% replacement of natural sand by M sand & 10% replacement of OPC by fly ash. Beyond this replacement level workability reduces.
B. Workability of concrete produced by replacing natural sand by M sand & OPC by fly ash is higher as compared to reference concrete.
C. Higher compressive strength can be obtained when the 40% replacement of natural sand by M sand & 10% replacement of OPC by fly ash.
D. Higher split tensile strength can be obtained when the 40% replacement of natural sand by M sand & 10% replacement of OPC by fly ash.
E. Concrete produced by replacing natural sand by M sand & OPC by fly ash exhibit higher split tensile strength as compared to reference concrete.
F. Higher flexural strength can be obtained when the 40% replacement of natural sand by M sand & 10% replacement of OPC by fly ash.
G. Concrete produced by replacing natural sand by M sand & OPC by fly ash exhibit higher flexural strength as compared to reference concrete.
[1] Rafat Siddique “effect of fine aggregate replacement with class f fly ash on the mechanical properties of concrete” 33 (2003) pp 539–547
[2] Patil S L Kale J N Suma S “fly ash concrete a technical analysis for compressive strength” (2007)
[3] Wolfe, Michael Hayse “Bond strength of high volume fly ash concrete” University of Science and Technology (2011)
[4] AnandKumar B .G” Effective Utilization of Fly Ash and Supplementary Cementitious Materials in Construction Industry”
[5] Venkatachalapathy Venkitasamy Srinivasan Gopala Krishnan, B.P.C Rao “ Performance of fly ash blended crushed sand concrete”
[6] IS 456-2000 Specifications for plain and reinforced concrete.
[7] IS: 10262 – 2019 Specifications for plain and reinforced concrete.
[8] IS: 8112 - 1989 Specifications for plain and reinforced concrete.
[9] IS: 383-1970 Specifications for plain and reinforced concrete.