https://doi.org/10.22214/ijraset.2023.49405

11 III
2023
March
ISSN: 2321-9653; IC Value: 45.98; SJ Impact Factor: 7.538
Volume 11 Issue III Mar 2023- Available at www.ijraset.com

https://doi.org/10.22214/ijraset.2023.49405
ISSN: 2321-9653; IC Value: 45.98; SJ Impact Factor: 7.538
Volume 11 Issue III Mar 2023- Available at www.ijraset.com
1,
2Assistant Professor, Mechanical Engineering Department at Sanmati Engineering College Washim
Abstract: As we know when engine goes to testing department before that we test it through semi-automatic setup which is installed on assembly line converyor to test the oil and fuel leakage of diesel engine.Now different trial were taken on engine by using methodology which includes ATEQ D520 unit and air pressure regulator for detecting the leakage quantity.Actually ATEQ D520 UNIT is a flowmeter which measure a drop in pressure with a differential sensor.Here we supplied pressurized air into the engine through breather plug and overflow pipe.If leakage not found engine will dispatched to testing department and if leakage is found the problem may solve by spraying soap water in leakage area so that in that area bubbles comes out .This work which emphasis on the analysis of problem due to which engine reject from testing department and also time and cost saving analysis for one month.Due to this setup improvement in PQCDSM,PPM and reduction in cost poor quality supplied to customers from 28% to 18% of cost per benefit,better customer satisfaction.
Keywords: ATEQ D520 Sensor, Leakage Detection, Leakage Location, Oil and Fuel connection, PQCDSM, PPM.
Leak detection is the process of finding leakages from oil/gas pipelines or from engines may create environmental hazards. Very small leakages may create a big problem. So, the System where leak may occur should possess following terms-Sensitivity-The system should detect minor leaks within a short period. Precision –The system should be able to locate leakages precisely. Robustness –The leak detection system should have active monitoring in unsteady or non- ideal conditions. Reliability –The system should not generate false alarms, even it is highly sensitive.
The aim of this experimental setup study is 100% leak detection in the system. Leakage may from Oil/gas pipelines, engine oil or fuel leakage to avoid explosions and environmental hazards and safety leak proof system is most important.
To compensate false alarms when there is no leak in the pipeline, to reduce the response time and Increase the accuracy of leakage location. The idea of Semi-Automatic setup used in such a way that the leakage in the engine is tested on assembly line conveyor before engine goes for testing in testing department. Due to this work, Productivity, Quality, Delivery, Safety and Moral of operator is increased. Reduced overall cost of engine considering rejection cost, Labor, transportation, Diesel, oil, Rework cost.
Many researchers work on this area of leakage testing and they found the computational methodology which permits to detect and locate leakage is based on the on-line analysis of signals originated from pressure, flow and temperature acquired by SCADA. Zhao yang, Mingliang Liu, Min ShaoIngjie Ji Computational method is used which permits todetect and locate leakage based on the online analysis ofsignals Acquired by SCADA. It is approximate method for leak detection (1).
Jasper Agbakwuru examines the advances in pipeline third party encroachment alert systems and leak control methods inoil/gas industry. Also highlights extent of spill/pollution issuein Niger Delta region due to intended /unintended damages &suggest possible method of control (2).
Agbakwuru Jasper Paper suggests that use of optical eye (3D camera) as main tool for managing the challenges in underwater pipeline repairs in unclear water conditions (3).
Agbakwuru Ahamefula, Jasper, Gudmestad Tobias Ove, Bilstad Torleiv invented the leak response with time when upstream & downstream valves are operated is taken internal diameter of pipeline considered holding and flowing characteristics are find out. This characteristic has been discussed with oil industryoperations (4).
Ali Nasirian result has shown that novel method is used which is step by step elimination method which hascapability of detecting leakage In terms of its location and quantity (5).
Traditionally, Engine leakage testing was conducted by using pressure gauge, applying compressed air on the engine, chalk powder and use of ultraviolent lamp. So from this testing leakage may occur and it was not possible to get 100% leak detection.

ISSN: 2321-9653; IC Value: 45.98; SJ Impact Factor: 7.538
Volume 11 Issue III Mar 2023- Available at www.ijraset.com
The problem was Engineer will not able to test leakage easily due to overheating of engine joints in fuel line and oil leakage from the engine because these problems are not easily detectable. This method was not 100% leak detectable. So instead of dispatching engine to application department it was rejected from testing to assembly for rework on the leakage. Loss of time & cost of engine for rework reduces companies profit & productivity with no customer satisfaction.
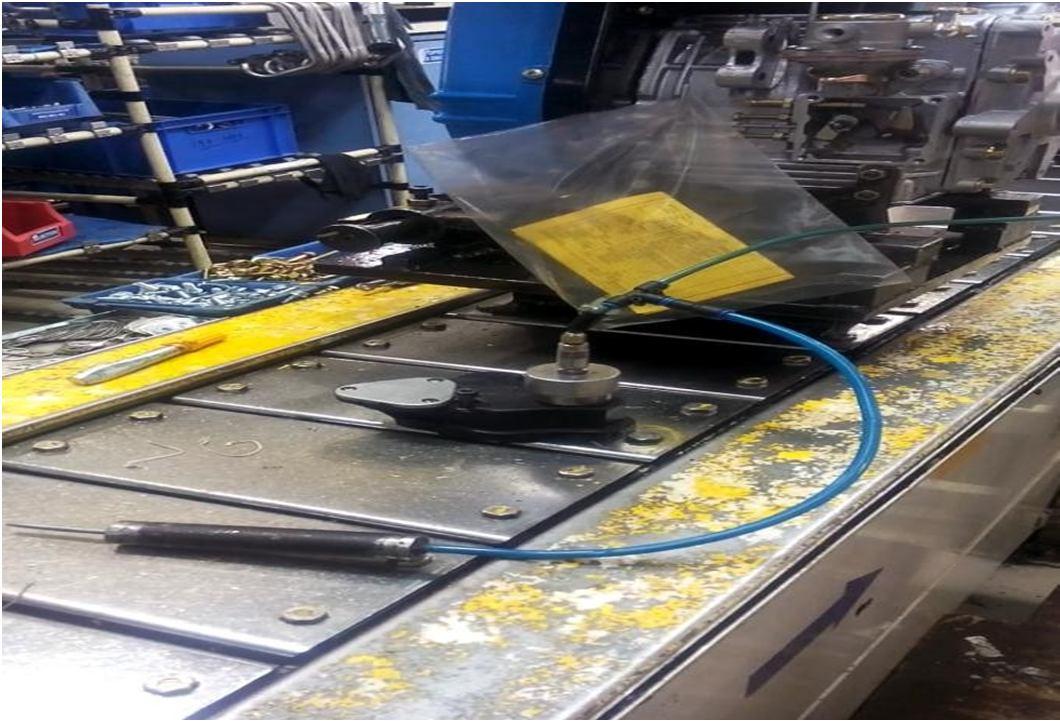
The semi-automatic set up includes ATEQ D520 unit & air pressure regulator for finding out leakage quantity. The ATEQ D520 is a flow meter which measures a drop in pressure with a differential sensor (transducer).

The setup consists of ATEQ D520 sensor, Pressure regulator, Air and Fuel line connections for oil and fuel leakage testing. Pressurized air at 1 bar is supplied into the engine through Breather plug & overflow pipe. Supply of air will be 30 seconds stabilization time. If pressure doesn't drops (within 20 seconds) engine is ok and no leak found indicated by green light. If pressure gets dropped in fuel line, engine will get rejected that means engine is not ok & ATEQ D520 indicates Red light. So engine leakage testing is done by spraying soap water on that leak portion due to which bubbles May come out which will indicate leakage at that point.

ISSN: 2321-9653; IC Value: 45.98; SJ Impact Factor: 7.538
Volume 11 Issue III Mar 2023- Available at www.ijraset.com
The ATEQ D520 is a flow meter which measures a drop in pressure with a differential sensor (transducer) which is placed at the extremities of a calibrated flow tube. When fluid(air) moves through a calibrated flow tube (laminar flow), a drop in pressure occurs, the value of which is proportional to flow.

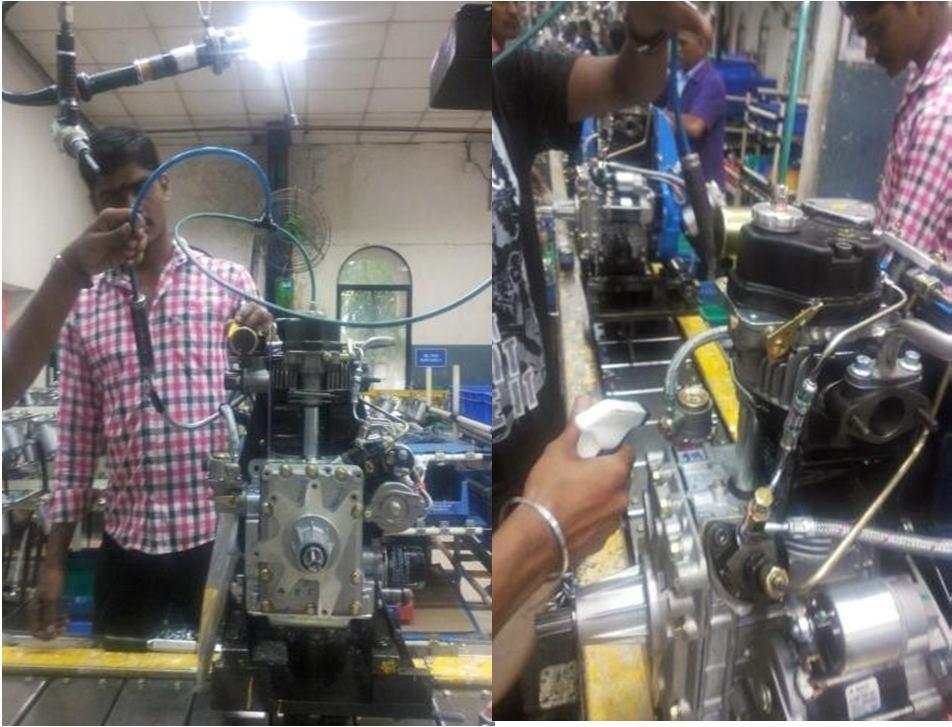
1) Assembled engines from the trolleys of the line conveyor will come for the leak testing on leak test station for every90 seconds
2) Operator has to select air circuit on selector switch provided on set up
3) Operator can see the respective program on ATEQ D520 sensor which is provided by that ATEQ Company
4) Remove the rocker cover with the gasket on which breather hole is there
5) Mount standard rocker cover gauge made to fill air into the engine one supply of airline is given tobreather plug hole & other is given to fuel line through overflow pipe
6) Deep stick is inserted which measures oil level of engine Oil filter bolt is tightened
7) Now there is no any phenomenon from where leakage will occur, start the cycle
8) ATEQ will start Air leak testing cycle- Start, The filltime, the stabilization Time, The test time, Reset, End of Cycle.

9) ATEQ will give results Ok or Not Ok depending on leakage found or not & the indication of this Ok or Not Ok is presented on lamp
10) Green light indicates the engine is Ok i.e.no leakage found in the engine. Red light indicate engine is not ok i.e. leakage phenomenon occurred in the engine. mark Ok or Not Ok on engine
11) Leakage may be from Governor Support O-ring, oil pan, PTO (power take off), push rod tube rubber bush, various Banjo joints of fuel line.
12) Remove all the plugs from the engine & send enginefor next station for next operation i.e. Inspection. Repeat this cycle for next engine
ISSN: 2321-9653; IC Value: 45.98; SJ Impact Factor: 7.538
Volume 11 Issue III Mar 2023- Available at www.ijraset.com
13) If engine is ok no leakage found dispatched for testing department. If not ok leakage is found hold for a while and clear this problem in rectification.
Implementation on problem analysis is done to minimize costof engine, rework time, customer complaints, and no. ofengine rejection from testing. Outcomes to solve the leakagePhenomenon’s problems occurrence is captured and listedbelow for making analysis easier.
ISSN: 2321-9653; IC Value: 45.98; SJ Impact Factor: 7.538


Volume 11 Issue III Mar 2023- Available at www.ijraset.com
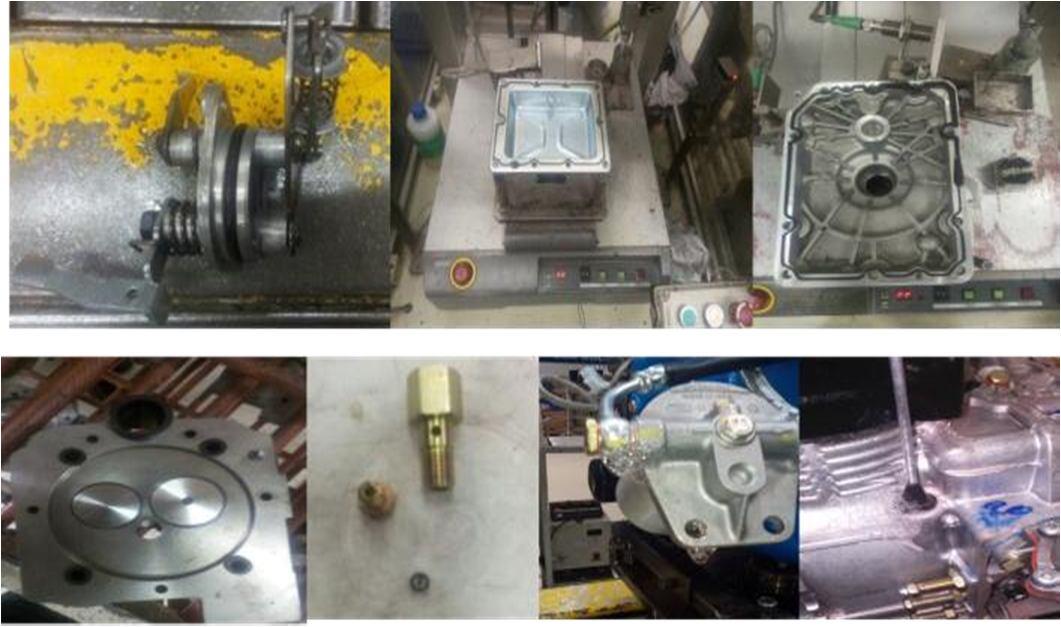
Following are problems while detecting leakage
1) Governor support Stop lever and O-ring leakage
2) Oil pan oil leak due to discontinuous loctite profile
3) Power takes off (PTO) enlarged loctite size
4) 400WG Cylinder head leakage due to water seals.
5) Leakage from FIP (Fuel Injector Pump) NRV (Non ReturnValve) Banjo bolt
6) Leakage from diesel filter
7) Leakage from deep stick
All these problems analysed and tried to improve company’s profit, productivity and 100% customers satisfaction with goods supplied to customers.
The Pareto chart shows that the no. of engines is rejected due to oil or fuel leakage & the Maximum rejection quantity is 30engines from governor support O-ring & stop lever. Governorsupport stop lever leakage is supplier problem because stop lever portion has welded joint over it when it is connected to linkage setting lever for fuel supply. Other problem is ofGovernor Support O-ring which cuts while inserting governorsupport into the assembly fitment.
Cost saving of 435 series Diesel engine is 23, 10, 000/-rupeesbefore and after the setup because earlier 120 rejections per month now this is reduced to 10. Parts per million is calculated for one month and from that respective cost saving.From below chart and table you will get the analysis.
ISSN: 2321-9653; IC Value: 45.98; SJ Impact Factor: 7.538
Volume 11 Issue III Mar 2023- Available at www.ijraset.com
In 110 minutes 3 engines are tested but due to rejection of engine there is loss of time. Operator tests 12 engines daily on each test bed. If engine is rejected due to leakage there is loss of one engine. Operator will not consider this engine as rejected and we have to test again he will test the engine as a new. Instead of testing 13 engines he will test only his target engines so loss is there. Real cycle time for testing of engine in testing department is 40 minutes. But, due to leakage problem it becomes 110 Minutes.
ISSN: 2321-9653; IC Value: 45.98; SJ Impact Factor: 7.538


Volume 11 Issue III Mar 2023- Available at www.ijraset.com
XI. PARTS PER MILLION ANALYSES BEFORE AND AFTER SET UP -DECEMBER
XII. SET UP IMPACT
This criterion describes the main goal of this project that was to reduce the problems at PDI Line due to Engine Quality Issue and to improve the sigma level. After calculation Sigma level was found to be improved considerably and Quality improvement in PPM for Engine Quality Defect = 1351ppm from 16,217ppm in month march 2016. It is clear that the setup is more profitable.
ISSN: 2321-9653; IC Value: 45.98; SJ Impact Factor: 7.538
Volume 11 Issue III Mar 2023- Available at www.ijraset.com

Cost of poor quality (COPQ) has been significantly reduced from 28% to 18% of sale that means if company is supplying 1000 engines to the customer and apart from that 5 engines are rejected due to leakage complaints this loss is reduced by setup which will provide 100% leakage free engines to the customers.
Engine assembly/Testing line Department was able to assemble/test more defect free engines than the earlierperiod. Problem at PDI engine line due to Defects related to Engine quality issues reduce from Avg. 16217 PPM to 1351 PPM per month. The benefit is that there are no single defectsreported at Buy off testing stage after implementation of action plan.
Ho-Defectives proportion before solution implementation =Defectives proportion after solution implementation
Ha-Defectives proportion before solution implementation >Defectives proportion after solution implementation
Table No.5- Overall Analysis
Difference = p (1) - p (2)Estimate for difference: 0.01491, 95% lower bound for difference: 0.00539415
Test for difference = 0 (vs. > 0): Z = 9.77 P-Value = 0.000Result: P value is <0.05, OR (Z at 0=9.77) > (Z at 0.05=1.645)
So, Ho is rejected.
It shows that after implementation of solutions on assembly line conveyor Engine manufacturing there is significant improvement by this set up of Oil & Fuel leakage.
1) Improvements in PQCDSM, 100% leak detection in engines. Due to this The tendency of operator/Engineer to work is increased, Customer satisfaction increased, Cost saving due to in-house manufacturing Rs. 6.5 Lac, Reduction in rework cost by Rs. 21,000/ engine.
2) Cost saving of 23, 10, 000/- rupees in one month as per theengine rejection due to leakage from PPM of March 2016. Time saving upto110 Minutes which was waste for rework ofengine.
3) Before the setup Parts per million was 16,217 and now it is1351 after the setup. Rejection of engines reduced from 120 nos. to 10 nos. and thus ppm is calculated it clears that setupis more profitable.
ISSN: 2321-9653; IC Value: 45.98; SJ Impact Factor: 7.538
Volume 11 Issue III Mar 2023- Available at www.ijraset.com
4) The Fuel & Oil leakage testing improvement methodology project Setup shows that the performance of the company is increased to a better level as regards to enhancement in customers (both internal and external) satisfaction, adherence of delivery schedules, development of specific methods to redesign and reorganize a process with a view to reduce or eliminate errors, defects; development of more efficient, capable, reliable and consistent manufacturing process and more better overall process performance, creation of continuous improvement and “do it right the first time” mind set.
We express our gratitude to DIEMS Aurangabad and Greavescotton ltd. chikalthana, Aurangabad Company which has provided us lot of background information & literature for this study. We are grateful to Mr. Abhijeet Bulge Industry’s Head of the department, all managers & supervisors who helped us for making this work successful.
[1] Zhao yang, Mingliang Liu, Min Shao, Yingjie Ji, “Research on Leakage Detection and Analysis of Leakage Point in the Gas Pipeline System” Open Journal of Safety Science and Technology, 2011, 1, 94- 100 Published Online December 2011.
[2] Jasper Agbakwuru “Pipeline Potential Leak Detection Technologies: Assessment & Perspective in the Nigeria Niger Delta Region” Open Journal of Environmental protection, 2011, 2, 1055-1061 Published Online December 2011.
[3] Agbakwuru Jasper “Oil/Gas Pipeline Leak Inspection & Repair in Underwater Poor Visibility Conditions: Challenges & Perspectives” Journal of Environmental protection, 2012, 3, 394-399 Published Online May2012.
[4] Agbakwuru Ahamefula Jasper, Gudmestad Tobias Ove, Bilstad Torleiv, “Experimental Study Of Oil Pipeline Leak Processes” Journal of Environmental protection, 2012, 3, 597-604 Published Online July 2012.
[5] Ali Nasirian, Mahmoud F. Maghrebi, Siavash Yazdani,“Leakage Detection In Water Distribution Network Based On New Heuristic Genetic Algorithm Model” Journal of Water Resource and protection, 2013, 5, 294-303 Published Online March 2013.
[6] J. M. Muggleton and M. J. Brennan, “Leak Noise Propagation and Attenuation in Submerged Plastic Water Pipes,” Journal Analysis of Leakage Point in the Gas Pipeline System” Open Journal of Safety Science and Technology, 2011, 1, 94-100 Published Online December 2011.
[7] J. Agbakwuru, “A Review of Pipeline Leaks and Inspection Technologies in the Oil and Gas Industry,” Pipeline Course of the University of Stavanger, Unpublished, 2011.
[8] J. A. Agbakwuru, O. T. Gudmestad, J. Groenli and H. Sjaelland, “Development of Method/Apparatus for Close-Visual Inspection of under-Water Structures (Especially Pipelines) in Muddy and Unclear Water Condition,” Proceedings of the 30th International Conference on Ocean, Offshore and Arctic Engineering, OMAE, Rotterdam, 19-24 June2011.
[9] J. P. Vitovsky, R. S. Angus and F. L. Martin, “Leak Detection and Calibration Using Transients and Genetic Algorithms,” Journal of Water Resources Planning and Management, Vol. 126, No. 4, 2000, pp.262-265.
[10] Z. Poulakis, D. Valougeorgis and C. Papadimitriou, “Leakage Detection in Water Pipe Networks Using a Bayesian Probabilistic Framework,” Probabilistic Engineering Mechanics, Vol. 18, No. 4, 2003, pp. 315-327.
[11] A. L. Ekuakille, G. Vendramin and A. Trotta, “Spectral Analysis of Leak Detection in a Zigzag Pipeline: A Filter Diagonalization Method- Based Algorithm Application,” Measurement, Vol. 42, No. 3, 2009, pp.358-367.
[12] O. Hunaidi, W. Chu, A. Wang and W. Guan, “Leakage Detection Methods for Plastic Water Distribution Pipes,” AWWA Research Foundation Technology Transfer Conference, Denver, 1999.
[13] O. Hunaidi, W. Chu, A. Wang and W. Guan, “Effectiveness of Leak Detection Methods for Plastic Water Distribution Pipes,” Workshop on Advancing the State of our Distribution Systems, Denver, 1998.
[14] Z. Yang, M. Liu, M. Shao and Y. Ji, "Research on Leakage Detection and Analysis of Leakage Point in the Gas Pipeline System," Open Journal of Safety Science and Technology, Vol. 1 No. 3, 2011, pp. 94- 100.
[15] C. Sandberg, J. Holmes, K. McCoy and H. Koppitsch, “The Application of a Continuous Leak Detection System to Pipelines and Associated Equipment,” IEEE Transactions on Industries Application, Vol. 25, No. 5, 1989, pp. 906-909.
[16] F. Kenya, M. Reiko, K. Akira, S. Hitoshi and K. Ichiro, “Gas Pipeline Leak Detection System Using the Online Simulation Method,” Computers and Chemical Engineering, Vol. 24, No. 2-7, 2000, pp. 453-456.
[17] RELI, “A Review of Pipeline Leak Detection Methods,” REL Instrumentation Project Report, Shell International Exploration and Production Limited, London, 1997.