11 I January 2023 https://doi.org/10.22214/ijraset.2023.48546
ISSN: 2321-9653; IC Value: 45.98; SJ Impact Factor: 7.538
Volume 11 Issue I Jan 2023- Available at www.ijraset.com

ISSN: 2321-9653; IC Value: 45.98; SJ Impact Factor: 7.538
Volume 11 Issue I Jan 2023- Available at www.ijraset.com
Tushar R. Yadav1 , Pradeep J. Patil2
1, 2Department of chemical engineering, Tatyasaheb kore institute of engineering and technology, Warananagar, 416113 INDIA

Abstract: Textile industry uses reactive dyes for dyeing. These textile effluents rigorously affect environment and living organisms. The study investigates use of “pressmud” a sugar industry waste, for preparation of biosorbent and its efficient use for removal of reactive dyes. In process, dried pressmud was pulverized and sieved (200-250 µm) followed by chemical activation by 5% HNO3 solution. Carbonization of pressmud was done at 400℃ for 3h. pressmud was characterized for XRD, FTIR. Factors affecting Biosorption process like pH, contact time, dye concentration, biosorbent dose were studied. Textile wastewater was analyzed before and after Biosorption for parameters like COD, BOD, TDS, turbidity etc. Adsorption isotherms like Langmuir and Freundlich isotherm were studied along with Temkin isotherm. The results showed removal of Orange dye followed Freundlich model (R2=0.982) for Blue dye removal and treating textile wastewater, Langmuir model was best fitted (R2=0.939, R2=0.993). Maximum adsorption capacity of pressmud obtained was 151.51 mg / g. Reaction kinetics for Biosorption process was found to be Pseudo second order (R2=0.984, 0.992, 0.999). The results indicated pressmud as promising material for preparation of low cost biosorbent and showed good dye removal efficiency.
Keywords: Pressmud, Reactive dyes, Biosorption, Dye removal, Textile wastewater.
Textile industries worldwide uses dyes to impart color to fabrics. Dyeing and Finishing processes in textile industry requires a large quantity of water. Thus generating a large total of toxic and unsafe wastewater [4]. A typical dye molecule comprises of two main components, chromophore and auxochrome. Chromophore responsible for imparting color and auxochrome for solubility in water and attaching to fiber [19]. Depending on solubility, dyes are classified into two types, soluble and insoluble. Acidic, basic, reactive, direct dyes are soluble dyes, while azoic dyes, vat and disperse etc. are insoluble dyes [17] Reactive dyes are most frequently used in textile industries. Reactive dyes are greatly soluble in water and contains chemical groups that forms covalent bonds amongst dye and fiber [4]. These highly toxic chemical substances are discharged into water bodies, thus upsetting the balance of environment and possess a severe threat for all living organisms. Ichalkaranji City in Kolhapur district (Maharashtra, India) is very well known for its textile industries and fabric markets. These large number of industries also cause vast production of wastewater containing dyes and other harmful chemicals. Generally different ways to treat this dye wastewater is classified into 4 categories, physical processes, chemical treatment, biological processes and radiation or electrical or acoustic processes [2]. Physical treatment of wastewater includes processes like filtration, sedimentation, adsorption, flocculation etc. In this Adsorption process is considered as remarkable, because of efficiency, flexibility and simplicity of application. In variety of adsorbents used for treatment of wastewater, Activated carbon is best known for its adsorption abilities. Still, commercial activated carbons are costly and have complex production process. So preparation of low cost adsorbents is intensely researched topic worldwide. Sugar Industry is an important agro based industries in the world. Brazil, China, India, Thailand are top sugarcane producers in the world, dominating 55% of total production of world [7]. Kolhapur district in Maharashtra state, India is also well known for its large production of sugarcane and numerous sugarcane processing industries. Sugar industry produces different types of wastes like bagasse, flyash, pressmud, distillery spent wash etc.
Pressmud is a by-product produced during filtration of sugarcane juice. It is spongy, amorphous and dark brown in color. Pressmud is generally used as fertilizers to enhance plant nutrients of soil. However, production of pressmud is way higher than its use in fertilizers.
Thus pressmud is found in abundant quantity and contains organic matter and can be used as great option for low cost bio based adsorbents [21]. In this study reactive dyes namely Remazol Brilliant Orange 3R-ID and Jakazol Blue BB along with real textile wastewater are used to study dye removal efficiency of pressmud biosorbent. Various factors affecting Biosorption process are studied along with adsorption isotherms and reaction kinetics.
ISSN: 2321-9653; IC Value: 45.98; SJ Impact Factor: 7.538 Volume 11 Issue I Jan 2023- Available at www.ijraset.com


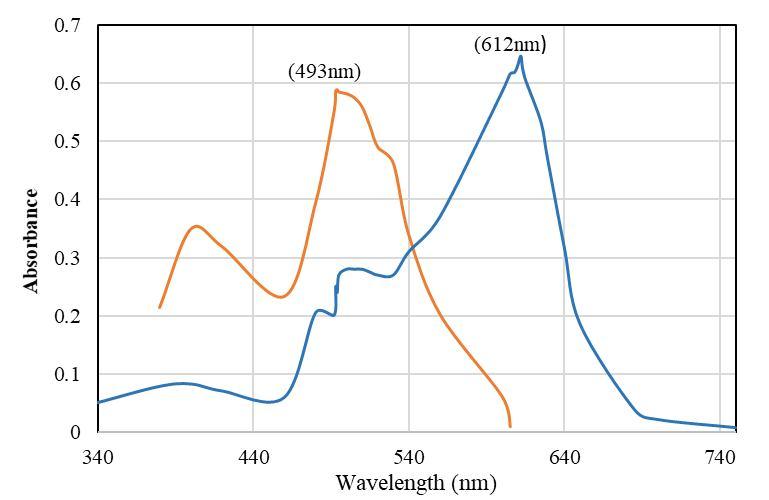
For experimental study, Reactive dyes namely Remazol Brilliant Orange 3R-ID and Jakazol Blue BB were used. 1000 ppm dye stock solutions were prepared. 1 gm of reactive dye was dissolved in distilled water to make up volume of 1000 ml. Further dilution of dye solutions with distilled water is done achieve desired concentration of dye solution. The SYSTRONICS UV-Vis spectrophotometer 118 was used to measure absorbance of dye solution. Maximum wavelengths calculated for dyes were 493 nm and 612 nm for orange and blue dye Respectively. A calibration curve of absorbance vs concentration is evaluated. Pressmud sample was collected from Local sugar factory in Warananagar, Kolhapur. Textile wastewater sample was collected from Common Effluent Treatment Plant, Ichalkaranji.


Fig.1. Formation of Pressmud in sugar factory
500 gm of pressmud sample was dried in hot air oven for 24 hr at 110℃. After complete removal of moisture pressmud was powdered and sieved through sieve shaker. Sieve shaker was used for separation of particles depending on particle size. Particle size of 200-250 µm was selected for further process. Chemical activation of Pressmud was done using 5% HNO3 solution. Pressmud was soaked in 5% HNO3 Solution for 24 h. Excess HNO3 was filtered out using filtration paper. Soaked press mud was dried at 105℃ for 2 h using hot air oven. Pressmud was carbonized using in muffle furnace at 400℃ for 3 h. Distilled water was used to wash carbonized pressmud for multiple times for removal of any trace impurity. Pressmud is then dried for 105℃ using hot air oven until it is completely dry. Prepared biosorbent is stored in air tight container until further use.
Dye removal efficiency of Pressmud Biosorbent was studied in batch Biosorption experiments. For expt., known volume of Dye solution (25-50 ml) was mixed with fixed amount of Biosorbent dose (0.1-2 gm) for varied Contact time (10-200 min). Initial dye concentrations were varied from 5 to 100 ppm. 1M HCl and 1M NaOH solutions were used to adjust pH of solutions. Mixed solution was stirred on Rotary shaker at 100 RPM.

ISSN: 2321-9653; IC Value: 45.98; SJ Impact Factor: 7.538 Volume 11 Issue I Jan 2023- Available at www.ijraset.com
After fixed Contact time, Mixed solution was filtered with filter paper and centrifuged at 600 RPM in REMI Laboratory centrifuge for 15 min. The Initial and final readings of solution concentration was measured using UV-Vis spectrophotometer SYSTRONICS 118. % Dye removal calculations were done using following formula, % Dye Removal =(Ci-Ce / Ce)*100, Where, Ci = dye concentration (Initial) (mg/L), Ce = dye concentration (final or equilibrium) (mg/L).
Fig.2. maximum wavelength of dye solutions (Orange dye= 493 nm, Blue dye= 612 nm)
Prepared pressmud biosorbent is characterized by various instrumental analysis tests like XRD, FTIR. Characterization tests helps to understand nature of biosorbent and its possible behavior.
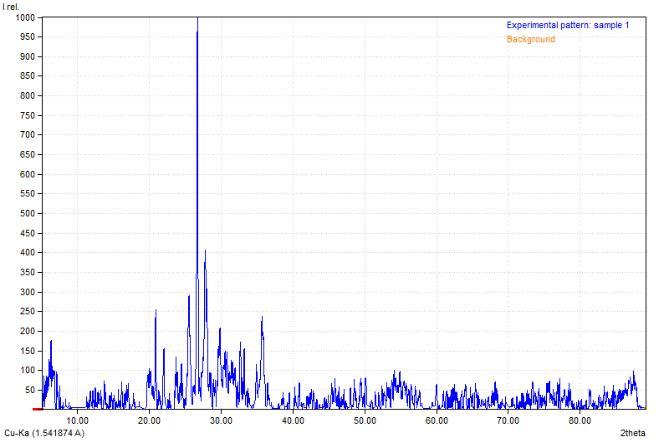
X-Ray Diffraction (XRD) analysis determines crystalline structure of material. Based on diffraction patterns chemical composition of material can be found out. XRD analysis was done at Common facilitation center, Shivaji University Kolhapur. (X-Ray Diffractometer by Bruker Ltd. Germany, scanning range of 3° to 160°, target Copper (Cu) λ=1.54 Å).
Fig.3. XRD pattern of pressmud biosorbent
XRD Analysis was done using Match! © Phase analysis software (v3.0) used for powder diffraction data. Software compares standard diffraction data of compounds with sample diffraction and suggests most suitable compounds that can exist in studied sample.
ISSN: 2321-9653; IC Value: 45.98; SJ Impact Factor: 7.538 Volume 11 Issue I Jan 2023- Available at www.ijraset.com
From data range obtained, it was seen for peaks ranging from 12 to 85 on 2 theta scale indicated similar peaks like Magnesium thiosulfate hexahydrate (H12MgO9S2), Silicon oxide (SiO2), Nitrogen and Calcium derivatives. Peaks also showed similarities to minerals like Magnussonite (As4Cl0.534Cu0.34H0.134Mg0.37Mn5.922O12.134) Stenhuggarite (As2CaFeO7Sb).
TableI. Overall XRD Peak Data
XRD Peak data
Peak Counts % Amount
Total peak intensity 1437 100 % Peak intensity of selected phases 1291 89.83% Peak intensity Unidentified 146 10.17%
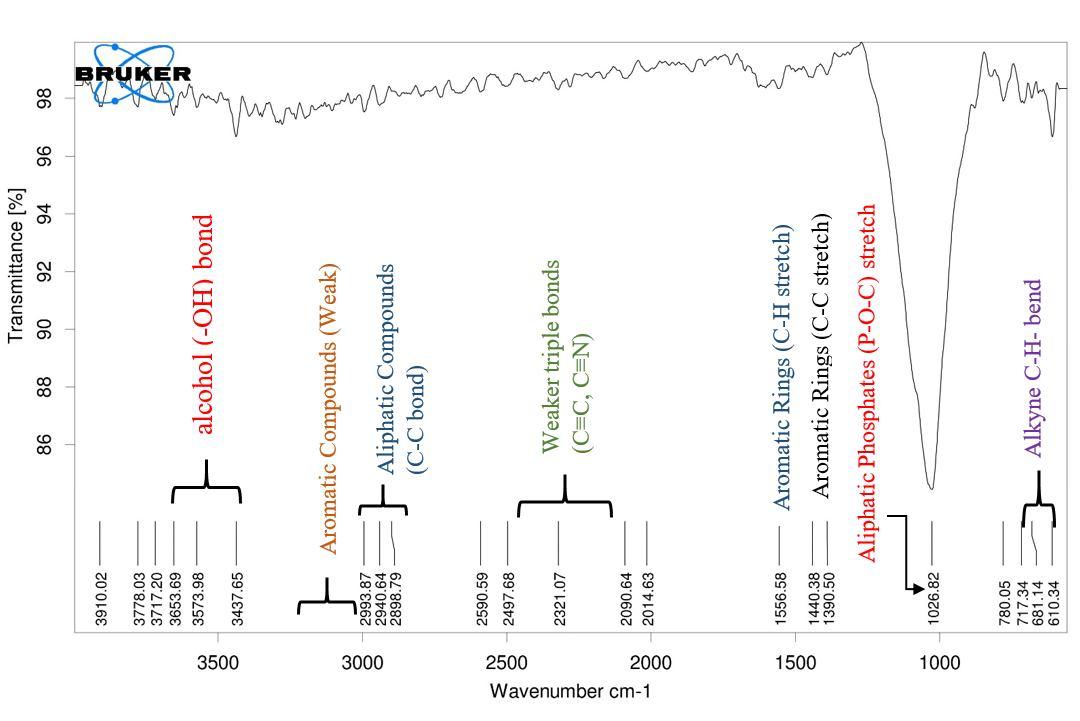
Fourier Transform Infrared Spectroscopy analysis (FTIR) uses infrared light for sample scanning and evaluate chemical properties. FTIR is most likely used for determination of organic compound, chemical bonds, functional groups etc. FTIR analysis was done at Common facilitation center, Shivaji University Kolhapur. (Model: ALPHA 100508, Maker: Bruker, Germany). IR Spectrum of FTIR plot is distributed into 3 wavenumber region namely, Far Infrared, Mid Infrared and Near Infrared spectrum with Wavenumber ranging (<400 cm-1), (400-4000 cm-1) and (4000-13000 cm-1) respectively. However Mid Infrared spectrum is broadly used for analysis. Sharp intensity absorption peaks at 3653.69, 3573.89 and 3437.65 cm-1 shows presence of Alcohol (-OH) group. No broad absorption band shows nonexistence of hydro bond or hydrates. Thin band in 3200-3000 cm-1 region shows presence of Aliphatic compounds (C-C bond). Above 3000 cm-1 spectrum shows weak presence of aromatic compounds. Spectrum shows weaker peak intensities at triple bond region that specifies weak triple bonds (C≡C, C≡N). Peak at 1556.58 shows presence of aromatic rings in compound. Presence of aromatic rings can be confirmed by weak peak intensities above 3000 cm-1 (For C-H stretching). In fingerprint region, stretch of aromatic ring is shown by peak at 1440.38 (C=C-C). Peak at 1440.38 shows stretch of (P-O-C) aliphatic phosphates. Peaks at 680-610 cm -1 shows alkyne C-H bend.
Fig.4. FTIR Spectra of Pressmud
ISSN: 2321-9653; IC Value: 45.98; SJ Impact Factor: 7.538 Volume 11 Issue I Jan 2023- Available at www.ijraset.com
Biosorption process is affected by many factors like pH of solution, Concentration of solution (Initial), biosorbent dosage and duration of process or Contact time.
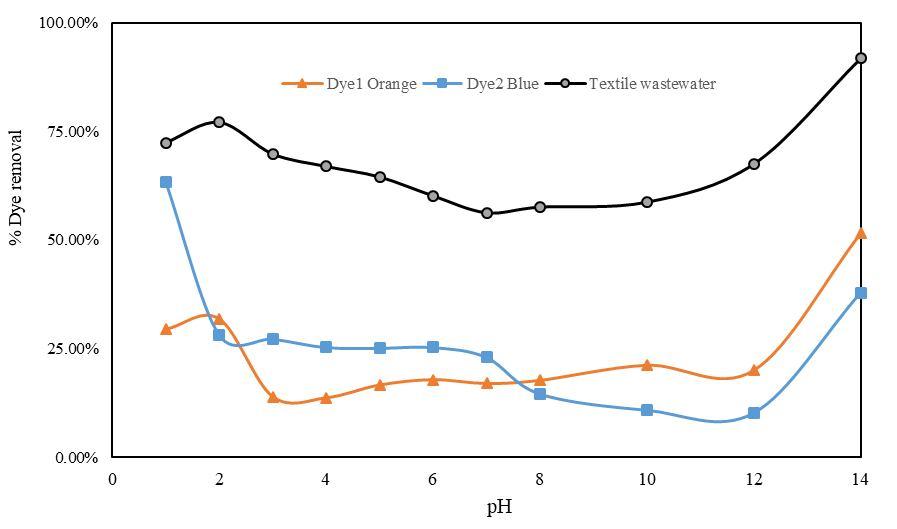
Influence of pH on process was studied through batch biosorption experiments. pH range (1-14) of Dye solutions and textile wastewater was controlled by dropwise adding 1M Hydrochloric acid (HCl) for acidity and 1M Sodium hydroxide (NaOH) solution for basicity. Time of contact, biosorbent dosage, initial concentration of dye solutions was fixed. Dye solution volume was kept constant (25 ml) for all three solutions. Dye removal efficiency of biosorbent was observed high at lower pH or highly acidic conditions. % dye removal was gradually decreased as pH was increased. However, at highly alkaline conditions (pH 13-14) % dye removal was highest for all three solutions. Optimum pH was found to be for pH 1-2.
Fig.5. Effect of pH
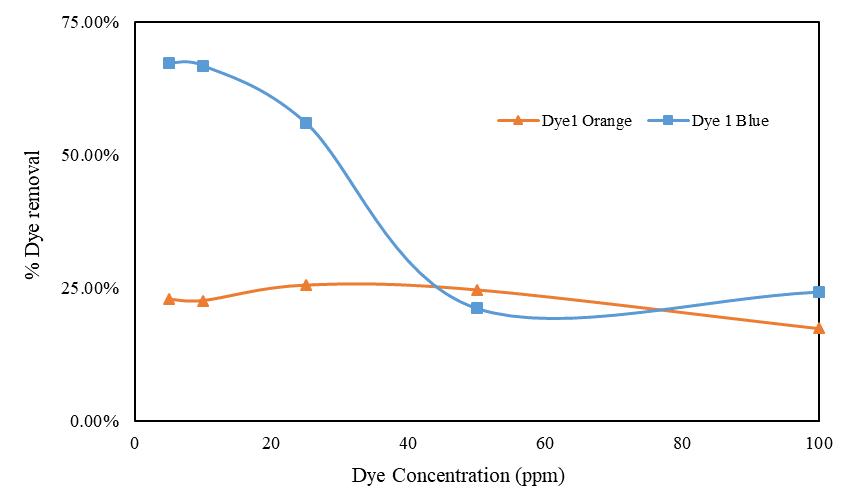
Concentration of dye solutions were varied from 5-100 ppm. Contact time, biosorbent dose and pH of solutions were kept constant. For blue dye solution, % dye removal was decreased as initial concentration of solution was increased. For Orange dye solutions, % dye removal was low for low and high concentrations, however it was good for moderate concentrations (25-50 ppm).
Fig.6 Effect of Dye conc
ISSN: 2321-9653; IC Value: 45.98; SJ Impact Factor: 7.538 Volume 11 Issue I Jan 2023- Available at www.ijraset.com
Biosorbent dose for a fixed volume of solution was varied from 0.1-2 gm. Contact time, pH and dye concentration was kept constant. For dye solutions and textile wastewater solution, it is observed that % dye removal is low for low dose but increases gradually with increase in dose. High removal % is observed for high dose of biosorbent. However, adsorption capacity of pressmud decreases with increase in amount of dose.
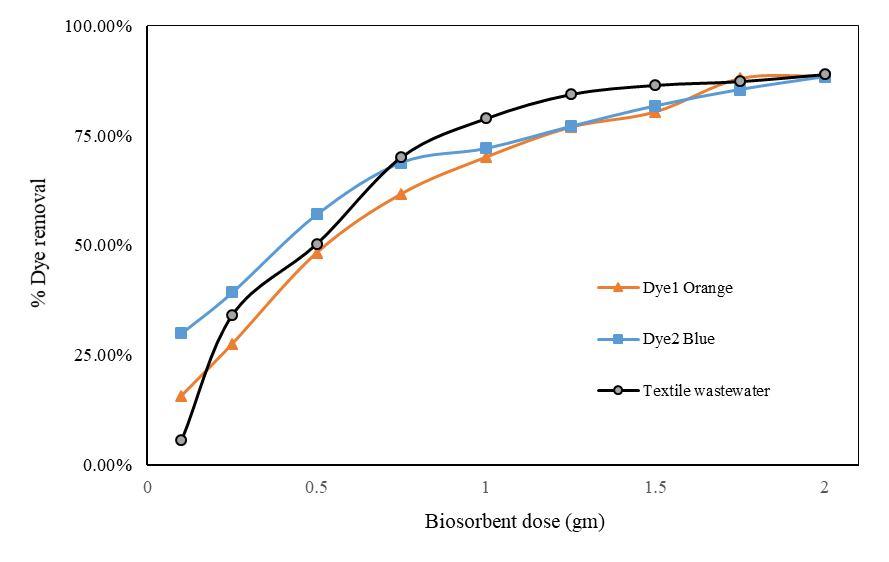
Fig.7 Effect of Biosorbent dose
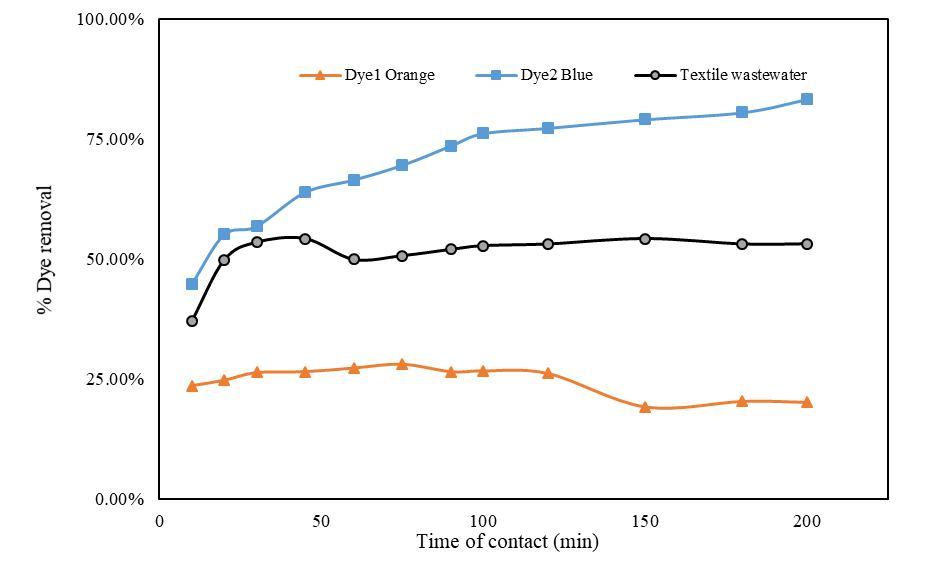
Time of contact significantly influence the Biosorption process. Time was varied from 10-200 min keeping pH, concentration and biosorbent dose constant. In case of Orange dye, % removal of gradually increases and does not show any significant increase and is maximum at 60-100 min time interval. For Blue dye, % removal increases significantly and achieves stability at 120-180 min time interval. For Textile wastewater maximum dye removal is achieved at 45-60 min time period and gradually decrease over period of time.
Fig.8. Effect of Time of contact
ISSN: 2321-9653; IC Value: 45.98; SJ Impact Factor: 7.538 Volume 11 Issue I Jan 2023- Available at www.ijraset.com
Textile wastewater is attributed with one of the most toxic and dangerous industry effluent. Biosorption experiment on textile wastewater focuses on removal of reactive dyes by adsorbing onto pressmud biosorbent. Batch Biosorption experiment involved dilution of textile wastewater with distilled water to decrease the high concentration of wastewater (10% dilution). Optimum values of contact time, pH and biosorbent dose were fixed. Textile wastewater was analyzed for different parameters before and after experiment.
Parameters Initial Final
1) pH 6-9.5 7.9
2) COD (mg/L) 1840 128
3) BOD (mg/L) 492 39
4) TDS (ppm) 2830 2710
5) EC (µS/cm) 5670 5670
6) Hardness (ppm) 1625 1300
7) Turbidity (NTU) 48.8 5.6
Biosorption isotherms describes interaction between biosorbent surface and adsorbate molecules. Three adsorptions isotherms namely Langmuir, Freundlich and Temkin were taken into consideration for biosorption process. Performance of these three isotherm models were compared using value of correlation coefficient (R2).
Isotherms
Langmuir
Dye1 Orange Dye2 Blue Textile Wastewater
qmax(mg/g) 151.51 4.52 0.481 KL 0.0006 0.144 1.44 RL 0.970 0.121 0.115 R2 0.955 0.939 0.993
Freundlich n 0.821 2.387 3.395 KF 0.056 0.865 0.274 R2 0.982 0.813 0.943
Temkin
BT 830.48 2276.3 26887.04 Ln AT -0.006 0.0001 0 R2 0.795 0.741 0.956
It predicts monolayer behavior of adsorption process. The linearized Langmuir isotherm equation is, (1/ qe) = [(1/ KL* qmax)*(1/ Ce)]+(1/ qmax)
Where, qe = Biosorption capacity of biosorbent (mg per g), qmax= Max. Biosorption capacity of biosorbent (mg per g), Ci= Conc. of Dye solution Initial (mg / L), Ce= Conc. of Dye solution after Biosorption (at equilibrium) (mg / L), KL= Langmuir adsorption constant (L/mg). Plotting a graph between 1/Ce vs 1/qe. From which we get, Slope= 1/ KL*qmax, Intercept= 1/qmax, and value of correlation coefficient (R2).
ISSN: 2321-9653; IC Value: 45.98; SJ Impact Factor: 7.538 Volume 11 Issue I Jan 2023- Available at www.ijraset.com
Here, RL (Dimensionless constant or separation factor) =1/1+Ci*KL, If Separation factor (RL) has following values, i.RL > 1, Expt. Shows Negative biosorption (also known as desorption.)
ii.RL = 1, Expt. shows Linear Biosorption. iii.RL = 0, Expt. shows non-reversible biosorption 0 < RL < 1, Positive biosorption process
The Freundlich isotherm equation in linearized form is given by, Log (qe) =Log (kf )+ Log (ce)*(1/ n)
Where, qe = Adsorption capacity of adsorbent (mg/g), kf = Freundlich adsorption constant, n = Degree of linearity between adsorbate and adsorption process.
Plotting a graph between Log ce vs Log qe. From graph we get Slope = 1 / n, Intercept = Log kf, kf = AL(Intercept). If Value of n is, i. n = 1, Linear adsorption. ii. n < 1, Adsorption process with chemical interaction. iii. n > 1, Adsorption process with physical interaction. iv. 0 < 1/n < 1, Favorable adsorption process, v. 1/n > 1 cooperative adsorption process
Temkin isotherm postulates that heat of adsorption decrease linearly with the increase of adsorbent coverage. qe = BT*lnAT + BT*lnCe Where, BT = Adsorption heat constant, AT = Binding equilibrium const. Plotting a graph between lnCe vs qe. From graph we get, B= Slope, ln AT = Intercept / BT, BT = R.T/ B Here, T = Abs. Temperature (room temp. 26℃), R = Gas Constant. From the comparison of value of correlation coefficient (R2), it is clear that Biosorption of Orange dye follows freundlich isotherm effectively, while Biosorption of Blue Dye and Textile wastewater follows Langmuir model. None of the process follows Temkin isotherm model. For Langmuir Model Value of RL, 0 < RL < 1 which describes Favorable adsorption process. For Freundlich model, value of n (Degree of linearity), n < 1 which describes adsorption process with chemical interaction
Adsorption kinetics is evaluated for determining rate constants and rate determining steps of the process. Pseudo First order or Lagergren first order model equation gives, ln(qe-qt) = ln(qe)-K1t Where, qe = adsorption capacity of adsorbent (mg/g), qt = adsorption capacity at time t, K1= First order reaction constant, t = Contact time (min). plotting graph between t vs ln(qe-qt), from graph we get, Slope= K1t, Intercept= ln qe Equation of Pseudo second order reaction kinetics is given by,
Where, K2 = Second order reaction constant, qe = adsorption capacity of adsorbent (mg/g). Plotting graph between t vs t/qt, we get slope=1/qe, From graphs comparing values of correlation coefficients. Best fitted values are considered for reaction kinetics. For Biosorption process, correlation coefficient of pseudo second order reaction perfectly followed process.
ISSN: 2321-9653; IC Value: 45.98; SJ Impact Factor: 7.538 Volume 11 Issue I Jan 2023- Available at www.ijraset.com
Reaction kinetics Dye1 Orange Dye2 Blue Textile wastewater
Pseudo First order K1 0 0 0
qe 0.8579 0.1701 0.0927
R2 0.4781 0.0561 0.3421
Pseudo Second order qe 0.7541 2.445 0.3549
K2 -0.1349 -0.1943 1.1398
R2 0.9847 0.9924 0.9992
In this study, Sugar industry waste Pressmud was used to prepare biosorbent. The effectiveness of pressmud for removal of reactive dyes was studied thoroughly. Prepared biosorbent was investigated with instrumental analysis tests like XRD, FTIR. Reactive dyes namely Remazol Brilliant Orange 3R-ID and Jakazol Blue BB were used for experimentation. Batch Biosorption tests involved treatment of dye solution and real textile wastewater with pressmud along with fixed process parameters. Various parameters affecting Biosorption process like pH, dye concentration, biosorbent dose, contact time were studied. Textile wastewater was analyzed before and after experiment for parameters like COD, BOD, TDS, turbidity etc. Biosorption isotherms Langmuir, Freundlich and Temkin were taken into consideration. Removal of Orange dye followed Freundlich isotherm model while removal of Blue Dye and Textile wastewater followed Langmuir isotherm model. For reaction kinetics, results proved that pseudo second order kinetics were best fitted for Biosorption process. Thus preparation of low cost agricultural waste biosorbent and its efficiency to remove reactive dyes was studied and proved with necessary experiments.
[1] Benkhaya S, El harfi Sara, El harfi Ahmed, 2007. Classification, properties and applications of textile dyes: A review, Benkhaya and al./Appl.J.Envir.Eng.Sci 3N(2017)311-320.
[2] Bellir K, Bouziane IS, Boutamine Z, Lehocine MB and Meniai AH. Sorption study of a basic “Gentian Violet” from aqueous solutions using activated bentonite ENERG Proced. 2012; 18:924-933.
[3] Chavan R.B, 2001. Indian textile industry – Environmental issues, Indian Journal of Fibre and Textile Research, Vol.26, March-June 2001, p.p,11-21.
[4] Drumod chequer F.M, Rodrigues de oliveira G.A, et al. 2013, Textile dyes: Dyeing process and Environmental impact. doi.org/10.5772/53659.
[5] Franciscon E, Grossman M.J, Paschoal J.A.R, Reyes F.G, Durrant L.R, 2012. Decolorization and biodegradation of reactive sulphonated azo dyes by newly isolated Brevibacterium sp. Strain VN-15, Franciscon et.al springerplus 2012, 1:37.
[6] Fatma Cicek et al. (2006) Low cost removal of reactive dyes using wheat bran. Journal of Hazardous Materials 146 (2007) 408–416
[7] FAO- Food and agriculture organization of United Nations (2019)
[8] Gosavi V. D, Sharma S, 2013. A General review on various treatment methods for textile wastewater. JECET, December 2013-February 2014; vol.3, no.1, 029039.
[9] Giannakoudakis D.A, Hosseini-Bandegharaei A, Tsafrakidou P, et.al 2018. Aloe Vera waste biomass based adsorbents for removal of aquatic pollutants: A Review, Journal of environmental management, 227(2018) 354-364.
[10] Gupta N, Tripathi S, Balomajumder C, 2010. Characterization of pressmud: A sugar industry waste. Fuel 90 (2011) 389-394.
[11] Kadam A.A, Lade H.S, Patil S.M, Govindwar S.P, 2013. Low cost CaCl2 pretreatment of sugarcane bagasse for enhancement of textile dyes adsorption and subsequent biodegradation of adsorbed dyes under solid state fermentation. Bioresource technology 132(2013) 276-284.
[12] Katubi K.M, Amari A, Harharah H.N, et.al 2021. Aloe Vera as promising material for water treatment : A review, Processes 2021,9,782.
[13] Khaniabadi Y.O, Mohammadi M.J, Shegerd M, Sadeghi S., Saeedi S, Basiri H, 2017. Removal of congo red dye from aqueous solutions by low cost adsorbent, Activated carbon prepared from Aloe Vera leaves shell. Environmental health engineering and management journal. 2017,4(1),29-35.
[14] Martin M.J, Balaguer M.D, Rigola M. (1996) Feasibility of activated carbon production from biological sludge by chemical activation with ZnCl2 and H2SO4, Environmental technology, 17:6, 667-671.
[15] Malik R, Lata S, Singhal S. 2015, Removal of heavy metal from wastewater by use of modified Aloe Vera leaf powder. ISSN: 2277-2073.
[16] Mohan D., Singh K.P, et al., (2002); Removal of dyes from wastewater using fly ash -a low cost adsorbent, Ind. Eng. Chem. Res. 2002,41,3688-3695.
[17] Malakootian M, Mansoorian H.J, Yari A, 2014. Removal of reactive dyes from aqueous solutions by non-conventional and low cost agricultural waste; adsorption on ash of Aloe Vera plant, Iranian journal of health, safety and environment, vol.1. no.3, p.p, 117-125
ISSN: 2321-9653; IC Value: 45.98; SJ Impact Factor: 7.538 Volume 11 Issue I Jan 2023- Available at www.ijraset.com
[18] Nandiyanto A.B.D, Okitani R, Ragadhita R (2019). How to read and interpret FTIR spectroscope of Organic material, Indonesian journal of Science and Technology 4(1)2019 97-118.
[19] Nevine Kamal Amin (2007) Removal of Reactive dyes from aqueous solutions by Adsorption onto activated carbons prepared from sugarcane bagasse pith. Desalination 223 (2008) 152–161
[20] Osman Gulnaz et al. (2005) The reuse of dried activated sludge for adsorption of reactive dye. Journal of Hazardous Materials B134 (2006) 190–196
[21] Rondina D.J.G, Ymbong D.V, Nalasa J.R.S, et.al 2019. Utilization of novel activated carbon adsorbent from press mud of sugarcane industry for optimized
[22] removal of of methyl orange in aqueous solution, Applied water science (2019) 9:181.
[23] Srivastava V, Sheth K.N, (2018); Characterization of press mud and rice husk combination for adsorption of heavy metals from waste acid generated from processing of E-waste by informal sector, Eco. Env. and Cons. 24(2):2018, p.p. (990-992), ISSN 0971-765X.
[24] Wang S, et al., (2004); A comparative study of dye removal using fly ash treated by different methods, Chemosphere 60 (2005) 1401-1407
[25] Yu Liu, Ya-Juan Liu Biosorption isotherms, kinetics and thermodynamics. Separation and Purification Technology 61 (2008) 229–242.