
ISSN: 2321-9653; IC Value: 45.98; SJ Impact Factor: 7.538 Volume 10 Issue XII Dec 2022- Available at www.ijraset.com


ISSN: 2321-9653; IC Value: 45.98; SJ Impact Factor: 7.538 Volume 10 Issue XII Dec 2022- Available at www.ijraset.com
Atharva Sarde1 , Mayur Badgujar2, Gargee Athalye3 , Prof. Shilpa Sondkar4 1, 2, 3, 4Department of Instrumentation and Control Engineering, Vishwakarma Institute of Technology, Pune

Abstract: The objective of this work is to develop machine learning (ML) methods that can accurately predict adverse drug reactions (ADRs) using databases like SIDER (Side Effect Research) and OFFSIDES (Government medical records). In this paper, three Machine Learning algorithms SVM (Support Vector Machine), Random Forest, and Gradient boosted trees are implemented on the datasets to predict various disorders caused due to adverse effects, and the performance is evaluated based on performance metrics such as average precision, recall, accuracy, f1 binary, f1 macro, and f1 micro. Finally, the two datasets were merged to understand and compare the performance of a combined dataset to a single dataset.
Keywords: SVM, Random Forest, XGboost, Machine Learning, Adverse drug reactions
An adverse drug reaction (ADR) can be defined as an unharmful, unintended, unexpected reaction to medication or treatment by an individual. Nearly all drugs have the potential to cause adverse effects which may result in various disorders such as immune system disorders, endocrine disorders, eye disorders, blood disorders, vascular disorders, etc. Therefore, it is very important to understand a particular drug’s side effects in order to prevent such disorders, risk-benefit analysis (analysing the benefit of the drug over the risk of its side effects) plays a very important role when a drug is prescribed
Nearly 3-7% of all the total cases enrolled in hospitals in the United States in a year are due to adverse drug effects and it is estimated nearly 10-20% of all these cases are severe. The data mentioned before does not include data from small clinics, nursing homes, and other healthcare-providing institutes. Although the exact number is unknown, ADR represents a crucial problem in today's world [1]. As per the research done it is evident that ADR has a common occurrence in clinical practice, during hospital admission, and also after discharge. It is estimated that between 5-10% of hospitalized patients suffer from ADR during admission or discharge, despite taking preventive measures

The most important reasons for ADR are dose-related complications followed by allergy and idiosyncratic respectively. Doserelated ADRs are particularly a concern when drugs have a narrow therapeutic index. Allergic ADRs are developed when a drug acts as an antigen Clinical history and appropriate pre-emptive tests could help predict allergic adverse drug reactions. ADRs are usually classified based on their severity as mild, moderate, severe, and lethal. These classifications help understand the health status of the diagnosed individual. Adverse drug effects can be prevented by getting familiar with the drug and understanding potential reactions to it. Machine learning-based analysis could be used to check for probable drug interactions and analysis of different drugs should be repeated whenever their components are changed or added. Our proposed model helps solve this problem by using machine learning to predict 24 different disorders such as blood and lymphatic disorders, cardiac disorders, immune system disorders, endocrine disorders, eye disorders, blood disorders, vascular disorders, etc. caused by ADR with great accuracy. This would vastly help in the prevention of adverse drug effects.
Drugs affect the life of a patient if health is concerned. One of the paper researched was based on the extraction of adverse drug effects using mining and discovering potential adverse drug reactions from many unstructured text plays and clinical records. The same played an important role in drug research and pharmacovigilance Recently, it is a vital research issue in the field of biomedical engineering. The other paper discussed pattern mining of mentions of adverse drug effects from user comments for extraction. Such a system automatically extracts mentions of the ADRs from social media networks by mining a set of language patterns. To identify drug reactions and drugs correlated with high rates of serious adverse events, data mining has been performed over the FDA’s Adverse Event Reporting System (AERS) to get the appropriate results. However, safety problems have resulted from the lack of post-marketing surveillance information about drugs, with underreporting rates of up to 98% within such systems.

ISSN: 2321-9653; IC Value: 45.98; SJ Impact Factor: 7.538 Volume 10 Issue XII Dec 2022- Available at www.ijraset.com
In one social media mining, the proposed system uses association mining and Proportional Reporting Ratios to mine the associations between drugs and adverse reactions from the user-contributed content on social media for drug safety signal detection. The different approach was to use FDA alerts as the gold standard to test the performance of the proposed techniques. In this paper, large-scale Twitter mining describes an approach to finding drug users and potential adverse drug-related events by utilizing Natural Language Processing (NLP) and building Support Vector Machine (SVM) classifiers. Automatic adverse drug events detection is presented and tested using off-the-shelf machine learning tools from letters to the editor in journals that carry early signals of adverse drug events (ADEs). Another proposed generative modelling method for Exploiting online discussions is shown to be more effective than the discriminative method for discovering unrecognized drug side effects Large databases of electronic patient records (EPRs) are potentially valuable sources of information to support the identification of ADEs. The study of Predicting adverse drug events investigates the use of machine learning for predicting one specific ADE based on information extracted from EPRs, including age, gender, diagnoses, and drugs by analysing electronic patient records

One of the most important factors when using ML methods is the datasets used to train, test, balance, and cross-validate the model. In this work, 3 different ones will be used at different stages (SIDER, OFFSIDES, and a combination of these two), shown in the table below: (Table 1). The reason to used 3 different databases was to check the accuracy of the machine-learning algorithms in different conditions
SIDER 4 1427 Approved drugs with ADRs text-mined from drug package inserts grouped into 27 system organ classes. MedDRA classification and 25 diseases are included
OFFSIDES Over 3,300 drugs and 63,000 combinations connected to millions of potential adverse reactions. Database of off-label side effects and over 25 diseases are included
While pre-processing OFFSIDES, ADRs were grouped by system organ classes by MedDRA classification and SMILES strings were obtained from PubChem using the REST API.
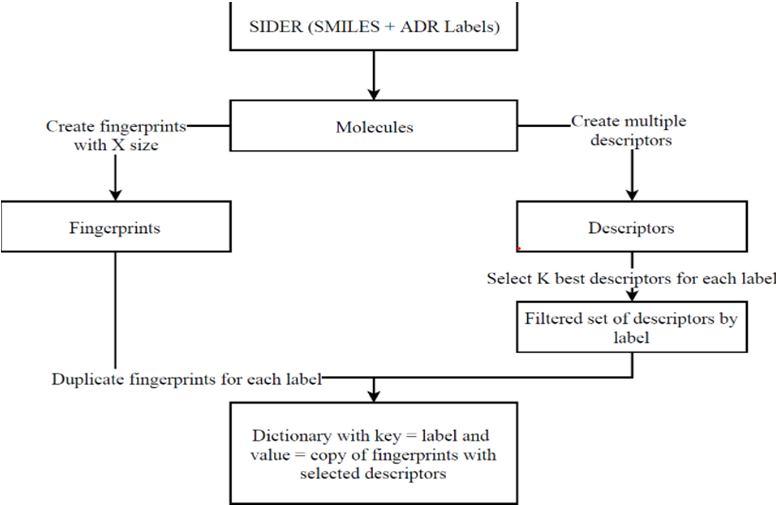
Features are the set of attributes associated with the example that try to represent the dataset. SMILES strings are commonly used to represent molecules, as is used in SIDER, as there is basic work. But even though they are a unique representation of molecules, they are not enough to use as a feature in ML. Because of this, they will be used as a way to generate other features like fingerprints and molecular descriptors using tools like RDKit in Python. The general workflow for the datasets when in SIDER format is displayed in Fig 1.
Fig 1: Work flow for SIDER dataset
ISSN: 2321-9653; IC Value: 45.98; SJ Impact Factor: 7.538 Volume 10 Issue XII Dec 2022- Available at www.ijraset.com

The SIDER dataset consists of a first column with the molecules' SMILES representation and twenty-seven other columns with the different SOCs. Three of these SOCs were not used since they had no real connection with the molecule and, as such, the development of ML models to predict these labels was not useful; these were 'Product Issues', 'Investigations', and 'Social circumstances'.
With the SMILES representation, it was possible to create multiple different features using RDKit, mainly fingerprints and other descriptors, for example, molecular weight, number of radical electrons, and number of valence electrons. We used these to add relevant information that complements the fingerprint. In total, 27 descriptors were calculated for each molecule; not every descriptor was useful and, as such, some selection was required. But, since there were 24 different classification tasks, each with an independent model, and different descriptors had different importance for each of them, this selection was done independently for each task, which resulted in 24 different Data Frames consisting in the fingerprint representation plus the 3 (after testing different values) descriptors selected for each task This selection was done using the SelectKBest function from scikit-learn with ANOVA as the statistical test. When transforming OFFSIDES and after getting the SMILES from the STITCH IDs, the process is the same as described before.
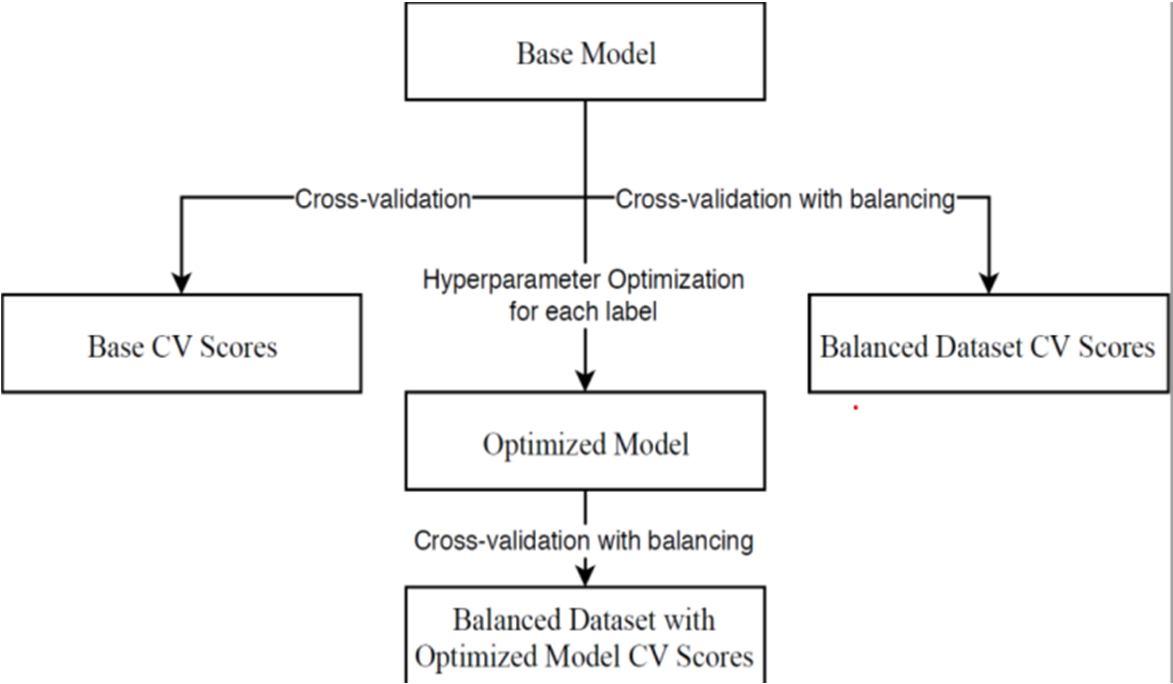
Supervised learning is the most common ML scenario in chemo-informatics, and can be subdivided into classification and regression problems. In this type of learning, the training data has the outcome variable to guide the learning process. The objective of this type of learning is to predict the value of an outcome or to classify it. The tested models are shown in Fig. 2.
After replicating this process for the 3 models, the best one for each label was selected and tested with the test dataset.
1) Support Vector Machine (SVM): It is one of the most popular ML methods. It maps the data into a high-dimensional space, using a non-linear kernel function, to optimally separate the classes. This separation is done by maximizing the margin between the closest points of the classes, support vectors, to the decision boundary, a hyperplane.

2) Random Forest (RF): Tries to give a classification based on an ensemble of decision trees built based on the training data. It is an ensemble of tree predictors where each tree is independently constructed by using bootstrap samples of the training data and random feature selection. After the RF is built, a prediction is made by a majority vote or averaging the predictions of all the trees.
3) Gradient Boosted Trees (GBT): Similar to RF, as it is also an ensemble prediction method but the trees are not independent. This comes from the fact that, in GBT, at each iteration, the respective tree is constructed by fitting a simple function to current residuals. The models tested and optimized were SVC (classification implementation of SVM) and Random Forest using scikit-learn, and Gradient Boosted Trees with XGboost.
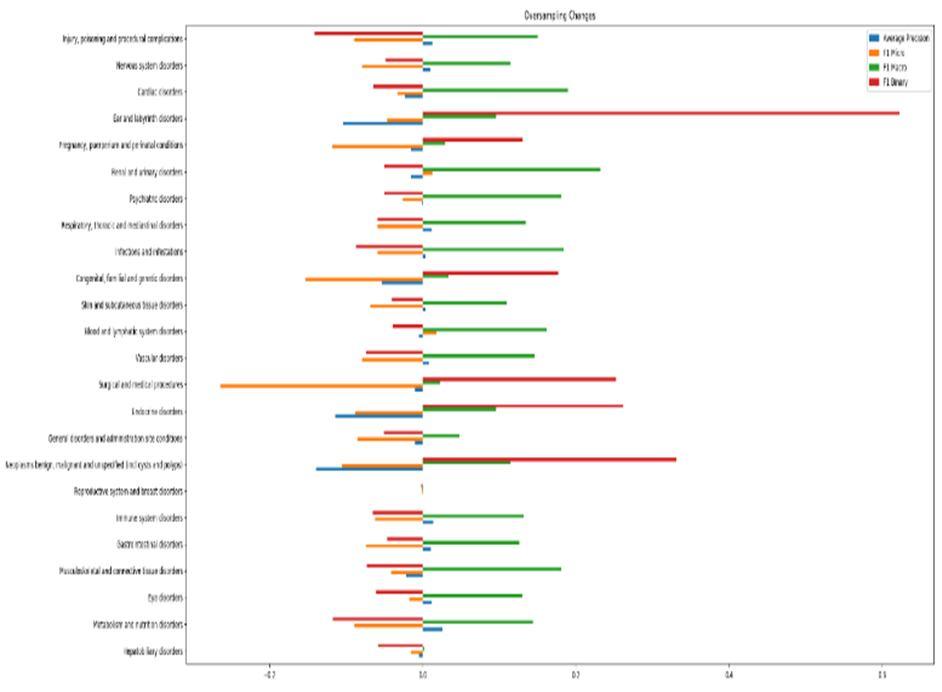
4) Model Development: As per the results, the percentage of positives is very different from label to label. Because of this, the workflow for each model was the base evaluation of the base model trained on the original dataset using cross-validation, followed by cross-validation with oversampling of the minority class, followed by hyperparameter optimization using random and grid search, followed by a final validation with the optimized parameters and oversampling.
ISSN: 2321-9653; IC Value: 45.98; SJ Impact Factor: 7.538 Volume 10 Issue XII Dec 2022- Available at www.ijraset.com

5) Cross-Validation (cv): This process was done using a stratified k-fold so that each set contains approximately the same percentage of a sample of each target class as the complete set.
6) Class Balancing: One of the most important steps when developing Machine Learning models is balancing the dataset. This can be necessary when the classification categories are not approximately equally represented. Class imbalance can, usually, be dealt with by re-sampling the dataset, either by oversampling the minority class and/or under-sampling the majority class. In this work, over-sampling was used, specifically the extension of the Synthetic Minority Over-Sampling Technique (SMOTE) with the imbalanced-learn package, SMOTE-NC. With SMOTE, the minority class is over-sampled by introducing synthetic examples along the line segments joining k minority neighbors neighbours. SMOTE-NC adapts this strategy by doing something specifically for the categorical features. When generating a new sample, it picks the most frequent category of the nearest neighbours present for these features.
Performance measures for classification are typically based on the confusion matrix. (Table 2) Predicted Negative Predicted Positive Actual Negative TN FP Actual positive FN TP Table 2. Confusion Matrix
In this confusion matrix, TN, TP, FP, FN are true negative, true positive, false positive, and false negative respectively. Using this format, it is possible to calculate other metrics in order to evaluate the quality of a model's predictions. In order to have a better idea of how well a model works, different metrics should be used. In this work, it was used: Recall, Precision, Area Under the Receiver Operating Characteristic (AUROC), and different variations of the F1 score.
Precision is the value depicting the quality positives from the model and is formulated as; = Recall is the ability of the classifier to label as positive a sample that is positive and is defined by: =
ROC is Receiver Operating Characteristic such that the curve is a 2-D where it’s x-axis and y-axis are representing Specificity and sensitivity, respectively

F1 Score is a weighted average of the precision and recall and is defined by 1 = ∗( ∗ )
In this work, three types of F1-scores were used. F1 binary, also represented as F1, is the F1 Score with respect only to the positive label. F1 Macro Score is the unweighted mean between both positive and negative labels. F1 Micro Score uses global TP, FN, and FP and is equivalent to the accuracy metric in a binary classification task. During this work, Average Precision, Recall, and the different F1 Scores will be the main metrics used to evaluate and develop the model.
In this work 24 models were studied, one for each SOC. Before any testing, the dataset was split in train and test and all validation and optimization tasks were done using the first, in order to prevent any type of test overfitting. Something to have in mind when evaluating these results is the imbalance of the test dataset which is a consequence of the same imbalance of the original dataset. This greatly affects the metrics, mainly the precision and all metrics that derive from it since having a big majority of positive tests will always result in high precision scores
ISSN: 2321-9653; IC Value: 45.98; SJ Impact Factor: 7.538 Volume 10 Issue XII Dec 2022- Available at www.ijraset.com

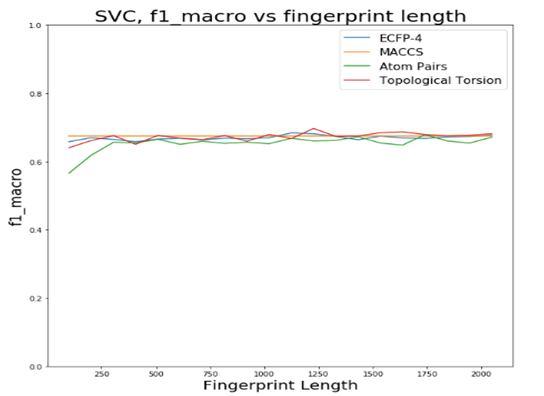
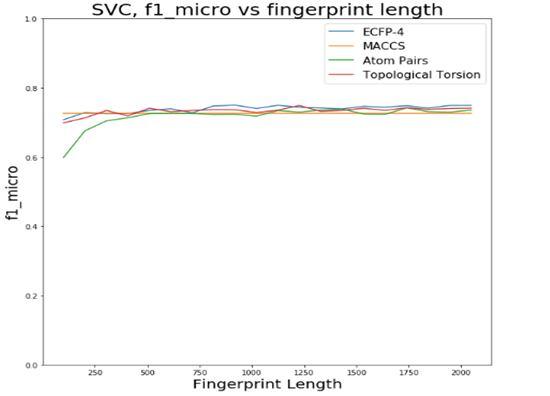
The first step was to choose a fingerprint type and its length. The tested possibilities were ECFP-4, MACCS key, Atom Pairs and Topological Torsion. For each of these types, different lengths between 100 and 2048 were tested and the different metrics were calculated in order to pick the best combination. In order to simplify this process, the different combinations were tested using 10fold cross-validation with SVC (Fig.4).
After obtaining the balanced dataset 3 ML algorithms were implemented which were Support Vector Machine, Gradient Boost and Random Forest to obtain the results 1) Considering SIDER 4 dataset and performing analysis over it considering performance metrics such as precision, F1 Macro, Recall and ROC by applying 3 algorithms which are random forest, support vector machine and gradient boosted tree (Fig 5).
0 0.2 0.4 0.6 0.8 1 1.2
Hepatobiliary disorders
Metabolism and nutrition disorders Eye disorders Musculoskeletal and connective tissue… Gastrointestinal disorders Immune system disorders
Reproductive system and breast disorders Neoplasms benign, malignant and… General disorders and administration site… Endocrine disorders Surgical and medical procedures Vascular disorders Blood and lymphatic system disorders Skin and subcutaneous tissue disorders Congenital, familial and genetic disorders Infections and infestations
Random Forest F1 Macro
Random Forest Recall
Suppoet Vector F1 Macro
Suppoet Vector Recall
Gradient Boosted Tree F1 Macro
Gradient Boosted Tree Recall
Respiratory, thoracic and mediastinal… Psychiatric disorders Renal and urinary disorders Pregnancy, puerperium and perinatal… Ear and labyrinth disorders Cardiac disorders Nervous system disorders Injury, poisoning and procedural…
Random Forest ROC_AUC
Random Forest Precision
Suppoet Vector ROC_AUC
Suppoet Vector Precision

Gradient Boosted Tree ROC_AUC
Gradient Boosted Tree Precision
Fig 5. Evaluation of performance of Machine learning algorithms on the SIDER dataset
ISSN: 2321-9653; IC Value: 45.98; SJ Impact Factor: 7.538 Volume 10 Issue XII Dec 2022- Available at www.ijraset.com


ISSN: 2321-9653; IC Value: 45.98; SJ Impact Factor: 7.538 Volume 10 Issue XII Dec 2022- Available at www.ijraset.com

Hepatobiliary disorders
Metabolism and nutrition disorders

Eye disorders
Musculoskeletal and connective tissue disorders Gastrointestinal disorders
Immune system disorders
Reproductive system and breast disorders
Neoplasms benign, malignant and unspecified (incl cysts and polyps) General disorders and administration site conditions Endocrine disorders
Surgical and medical procedures
Vascular disorders
Blood and lymphatic system disorders
Skin and subcutaneous tissue disorders
Congenital, familial and genetic disorders Infections and infestations
Respiratory, thoracic and mediastinal disorders Psychiatric disorders
Renal and urinary disorders
Pregnancy, puerperium and perinatal conditions Ear and labyrinth disorders
Cardiac disorders
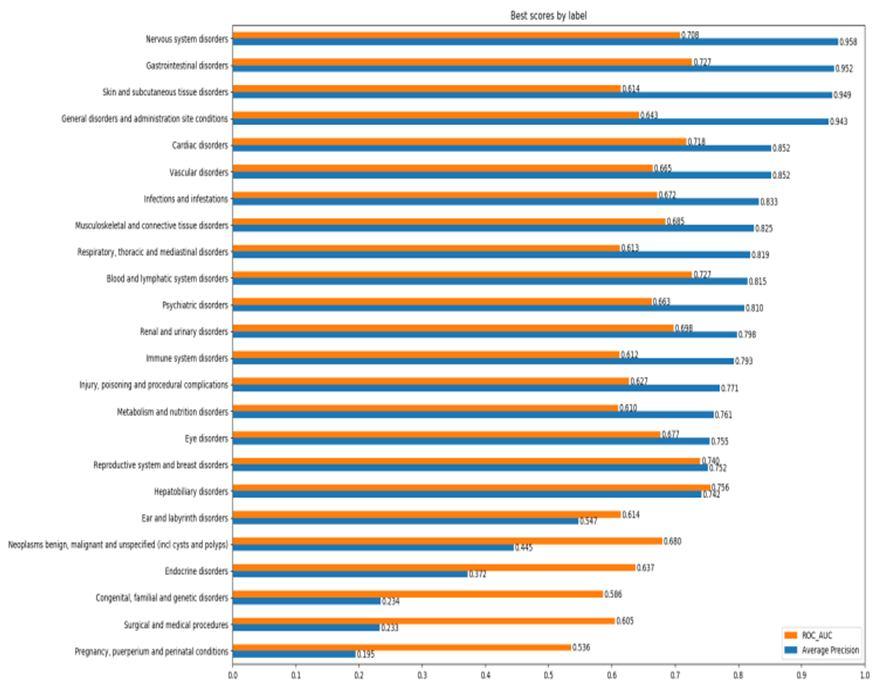
Now for comparison, if we consider both datasets and perform analysis over it considering ROC by applying 3 algorithms namely random forest, support vector (Fig 7). The combination of datasets resulted in the loss of accuracy and other evaluation parameters. The main reason for this result is the addition of excess false positives after combination of datasets. If we consider two parameters like precision and ROC for both datasets, then we get the results shown in the graph in an optimized manner by bar graph (Fig 8).
ISSN: 2321-9653; IC Value: 45.98; SJ Impact Factor: 7.538 Volume 10 Issue XII Dec 2022- Available at www.ijraset.com
As we can see from the previous results, the biggest and only improvements when combining SIDER and OFFSIDES were in classes that had very low recall since the addition of the OFFSIDES dataset greatly increased the number of positive examples, thus balancing the dataset. But, even with these improvements, the overall performance of the models was worse after the merge of the datasets.

This project used 3 algorithms namely Support Vector Machine, Random Forest, and Gradient Boosted Tree on OFFSIDES and SIDER datasets giving graphical output. Our proposed system evaluates the best Machine Learning algorithm from the above 3 algorithms. It also provides appropriate output depicting the comparison graphically. The results also suggest that after combining SIDER and OFFSIDES datasets the results obtained were less accurate compared to when the databases were evaluated individually. As can be seen in this paper, the main problem faced during this work was the imbalance of the datasets, so this could be the focus of improvement in future related work. The other possibility could be in the model development by trying other types of models such as deep learning or methods of over or under-sampling, for example using the "class weights" in some of the scikitlearn models.
[1] Classen DC, Pestotnik SL, Evans RS, Lloyd JF, Burke JP. Adverse drug events in hospitalized patients. Excess length of stay, extra costs, and attributable mortality. JAMA. 1997;277:301–306.
[2] Szarfman A, Tonning JM, Doraiswamy PM. Pharmacovigilance in the 21st century: New systematic tools for an old problem. Pharmacotherapy. 2004;24:1099–1104.
[3] Bate A, Evans SJ. Quantitative signal detection using spontaneous ADR reporting. Pharmacoepidemiol. Drug Saf. 2009;18:427–436.
[4] Szarfman A, Machado SG, O’Neill RT. Use of screening algorithms and computer systems to efficiently signal higher-than-expected combinations of drugs and events in the US FDA’s spontaneous reports database. Drug Saf. 2002;25:381–392.
[5] DuMouchel W. Bayesian data mining in large frequency tables, with an application to the FDA spontaneous reporting system. Am. Stat. 1999;53:177–190.
[6] Norén GN, Bate A, Orre R, Edwards IR. Extending the methods used to screen the WHO drug safety database towards analysis of complex associations and improved accuracy for rare events. Stat. Med. 2006;25:3740–3757.
[7] Hopstadius J, Norén GN, Bate A, Edwards IR. Impact of stratification on adverse drug reaction surveillance. Drug Saf. 2008;31:1035–1048.
[8] Cook EF, Goldman L. Performance of tests of significance based on stratification by a multivariate confounder score or by a propensity score. J. Clin. Epidemiol. 1989;42:317–324.
[9] Cepeda MS, Boston R, Farrar JT, Strom BL. Comparison of logistic regression versus propensity score when the number of events is low and there are multiple confounders. Am. J. Epidemiol. 2003;158:280–287.
[10] Kuss O, Legler T, Börgermann J. Treatments effects from randomized trials and propensity score analyses were similar in similar populations in an example from cardiac surgery. J. Clin. Epidemiol. 2011;64:1076–1084.
[11] Kuhn M, Campillos M, Letunic I, Jensen LJ, Bork P. A side effect resource to capture phenotypic effects of drugs. Mol. Syst. Biol. 2010;6:343.
[12] Campillos M, Kuhn M, Gavin A-C, Jensen LJ, Bork P. Drug target identification using side-effect similarity. Science. 2008;321:263–266.
[13] Yang L, Agarwal P. Systematic drug repositioning based on clinical side-effects. PLoS One. 2011;6: e28025.
[14] Hopstadius J, Norén GN, Bate A, Edwards IR. Stratification for spontaneous report databases. Drug Saf. 2008;31:1145–1147.
[15] Scheiber J, Jenkins JL, Sukuru SC, Bender A, Mikhailov D, Milik M, Azzaoui K, Whitebread S, Hamon J, Urban L, Glick M, Davies JW. Mapping adverse drug reactions in chemical space. J. Med. Chem. 2009;52:3103–3107.

