
10 VIII August 2022 https://doi.org/10.22214/ijraset.2022.46486

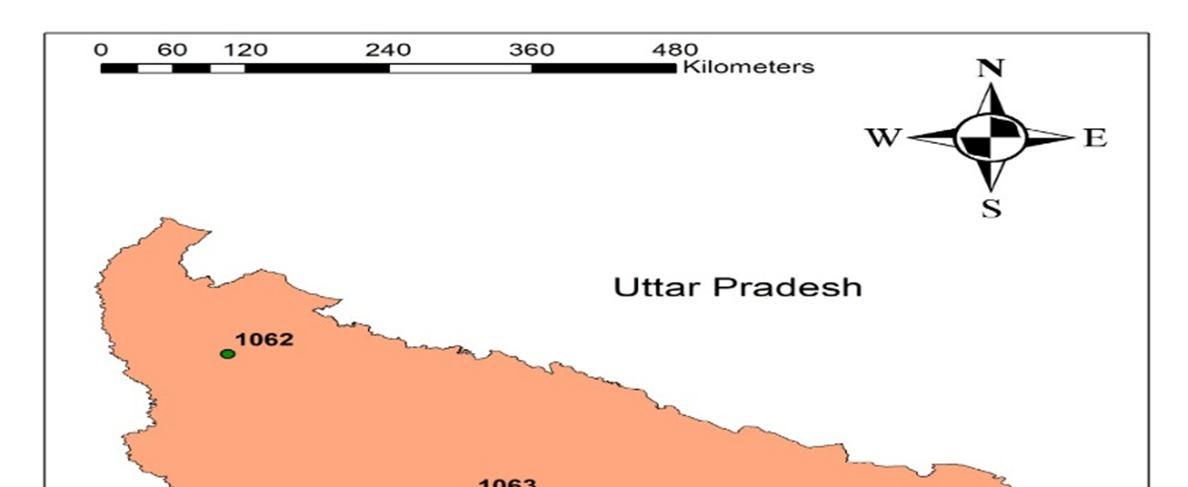
In this paper we have selected four locations in the upper Ganga stretch in the Uttar Pradesh. These locations are given below:
2
2
Abstract: With an increase in population and accelerated pace of industrialization, water quality is going to degrade day-by-day.
Ambuj Verma1, Dr. Anirudh Gupta
Prediction of Surface Water Quality of Upper Ganga in Uttar Pradesh
Keywords: ARIMA model, surface water quality prediction, Ganga River I. INTRODUCTION
1M Tech Scholar, CED, Institute of Engineering and Technology, Lucknow, India Assistant Professor, CED, Institute of Engineering and Technology, Lucknow, India
International Journal for Research in Applied Science & Engineering Technology (IJRASET) ISSN: 2321 9653; IC Value: 45.98; SJ Impact Factor: 7.538 Volume 10 Issue VIII Aug 2022 Available at www.ijraset.com 1720©IJRASET: All Rights are Reserved | SJ Impact Factor 7.538 | ISRA Journal Impact Factor 7.894 |
The main source of water in India is from rivers. The Ganga River Basin is the world’s most populated and is home to half of India’s population, including two thirds of the nation’s poor. This paper highlights the utility of statistical techniques for evaluating, interpreting complex data sets and recognizing spatial differences in water quality for effective management of river water quality. The Autoregressive Integrated Moving Average (ARIMA) model uses time series data and statistical analysis to interpret the data and make future predictions. 6 water quality parameters Dissolved Oxygen, BOD, pH, Temperature, Electrical Conductivity and Total Coliform are analysed and predicted. In this work 4 monitoring station is taken for the prediction analysis and data is taken from the CPCB. In this work ARIMA model is giving the better prediction of temperature, total coliform and conductivity in compare of other water quality parameter pH, BOD and DO. The max value for correlation coefficient for Dissolved Oxygen, BOD, pH, Temperature, Electrical Conductivity and Total Coliform are respectively 0.73, 0.76, 0.79, 0.83, 0.84 and 0.85.
Water is indispensable for the basic subsistence of human beings. No wonder, most of the civilisations have come upon the banks of rivers or in the river valleys as elsewhere in the world. India is a blessed country in terms of having numerous rivers in this regard. Unfortunately, in 2017, the Ganga River, the National Legacy and the life support of millions of people was classified as the world’s highly polluted river. The Ganga, with over 2,525 km long main stem along with her tributaries has constantly provided material, spiritual and cultural sustenance to millions of people living in and around its basin. The riverine water resources provide irrigation, drinking water, economical transportation, electricity, recreation and religious fulfilment, support to the aquatic ecosystem as well as livelihoods for many stakeholders. Natural water resources have been exposed to an exponentially growing population, rising standards. Ganga is a major an important river of India which originates from Gadgetry, Uttarakhand in the Himalayas and runs through almost 52 densely populated cities and 48 towns to meet the Bay of Bengal. This river has both emotional and spiritual value among Indians. The water of Ganga carries religious sentiments and is considered as the purest water which can wash off all the sins of the human being. However, present study is carried out with an objective to assess the water quality of the Ganga water at its descendent point on the plains where it is supposed to be least polluted. The river Ganges in India is regarded as the most holy and sacred rivers of the world by Hindus from time immemorial. Bhagirathi is the source stream of Ganga. The river has been the focus of national and international intervention and study for past several decades to identify and establish causes and impact of anthropogenic activities on river water quality. Ganga river basin, which was comparatively free from anthropocentric activities until the 1940s, became a disposal site for agricultural, industrial and sewage wastes after independence of India in 1947.
A. Study Area Ganges River, Great River of the plains of the northern Indian subcontinent. Although officially as well as popularly called the Ganga in Hindi and in other Indian languages, internationally it is known by its conventional name, the Ganges. Ganga is rising in the Himalayas and emptying into the Bay of Bengal, it drains one fourth of the territory of India. Its five headstreams the Bhagirathi, the Alaknanda, the Mandakini, the Dhauliganga, and the Pindar, all rise in the mountainous region of northern Uttarakhand state.


Time series forecasting techniques are a type of data analysis that is frequently employed in a variety of fields. The autoregressive integrated moving average (ARIMA) model is one of the most important and commonly used time series models. ARIMA models can also implement a variety of exponential smoothing techniques. It is also referred as the Box Jenkins methodology, which consists of a series of steps for identifying, estimating and diagnosing ARIMA models with time series data. ARIMA models have demonstrated their capacity to deliver accurate short term projections. In terms of short term prediction, it consistently beat complicated structural models. In an ARIMA model, a variable's predicted value is a linear mixture of prior values and past errors. This acronym entails the key aspects of the model itself. Briefly, they are Autoregression (AR) a model that makes advantage of a contingent relationship between a single observation and a set of lagged observations. Integrated (I) to make a time series stationary by differencing raw observations (e.g., we can subtract an observation from the previous observation in a time series). Moving Average (MA) it refers to the dependency between an observation and a residual error. Moving average applied to lagged observations is used in this model. Every component achieved are provided as a parameter in this model. ARIMA (p, d, q) is a standard notation in which the parameters are replaced by integer values to immediately indicate the ARIMA model being utilized. The ARIMA model's parameters are (p) it defines the number of lagged observations in the model, also referred as the lag order, (d) it can be understood as number of raw observations differenced, also referred as the degree of differencing, and (q) it is referred as the moving average order or the size of window in moving average. In this work ARIMA (1, 1, 1) is used for the prediction of the surface water quality.
Figure 1; location of station in Uttar Pradesh II. MATERIALS AND METHODS
Mathematically, Yt = α + β1Yt 1 + β2Yt 2 + + βpYt p + ϵt + ∅1ϵt 1 + ∅2ϵt 2 + + ∅qϵt q
Where, Yt is the predicted value, Yt 1 is the lag 1 of the series, β1 is the coefficient of lag 1, α is the constant or the intercept term, ϵt is the random error at t, ϵt 1 is the lagged error term at t 1, ∅ is the coefficient of lagged error at t 1.
International Journal for Research in Applied Science & Engineering Technology (IJRASET) ISSN: 2321 9653; IC Value: 45.98; SJ Impact Factor: 7.538 Volume 10 Issue VIII Aug 2022 Available at www.ijraset.com 1721©IJRASET: All Rights are Reserved | SJ Impact Factor 7.538 | ISRA Journal Impact Factor 7.894 | 1. GANGA AT GARHMUKTESHWAR, U.P 1062 (S1) 2. GANGA AT KANNAUJ 1063 (S2) 3. GANGA AT KANPUR U/S (RANIGHAT) 1067 (S3) 4. GANGA AT KANPUR D/S 1068 (S4)
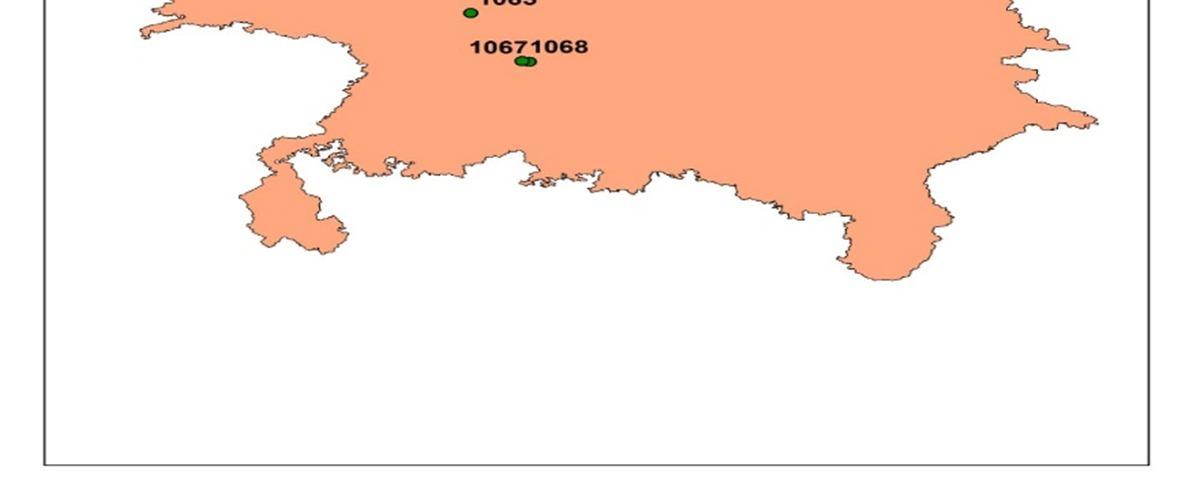
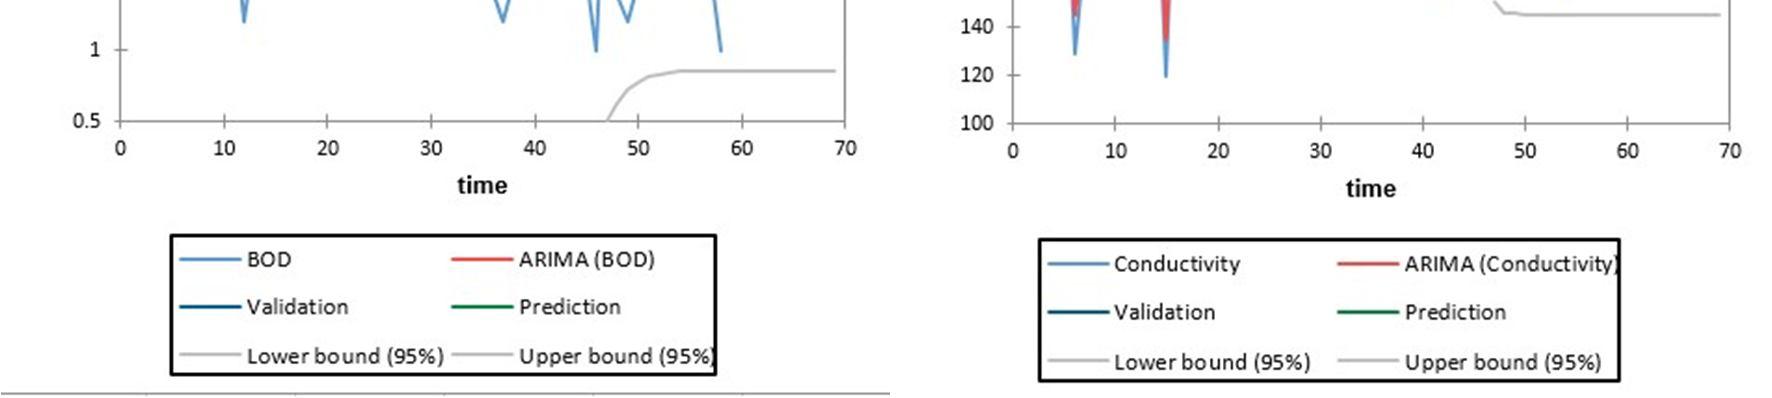
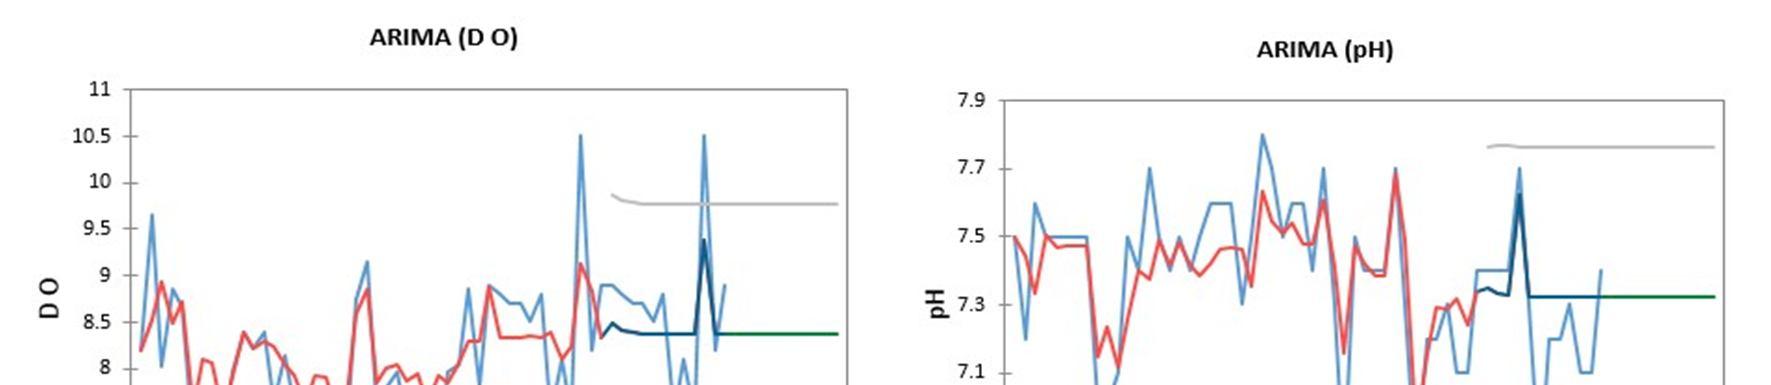
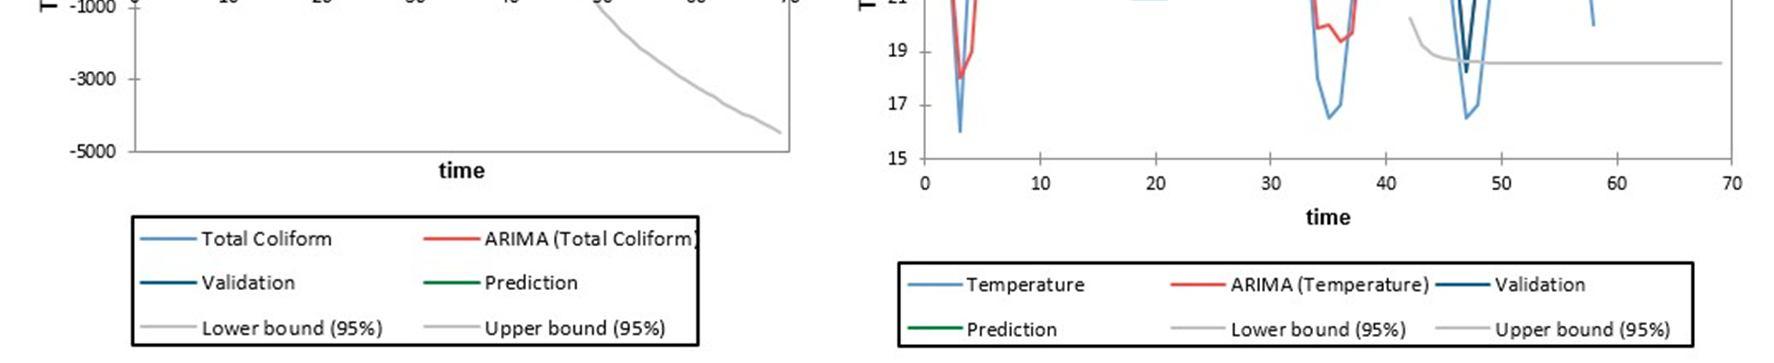
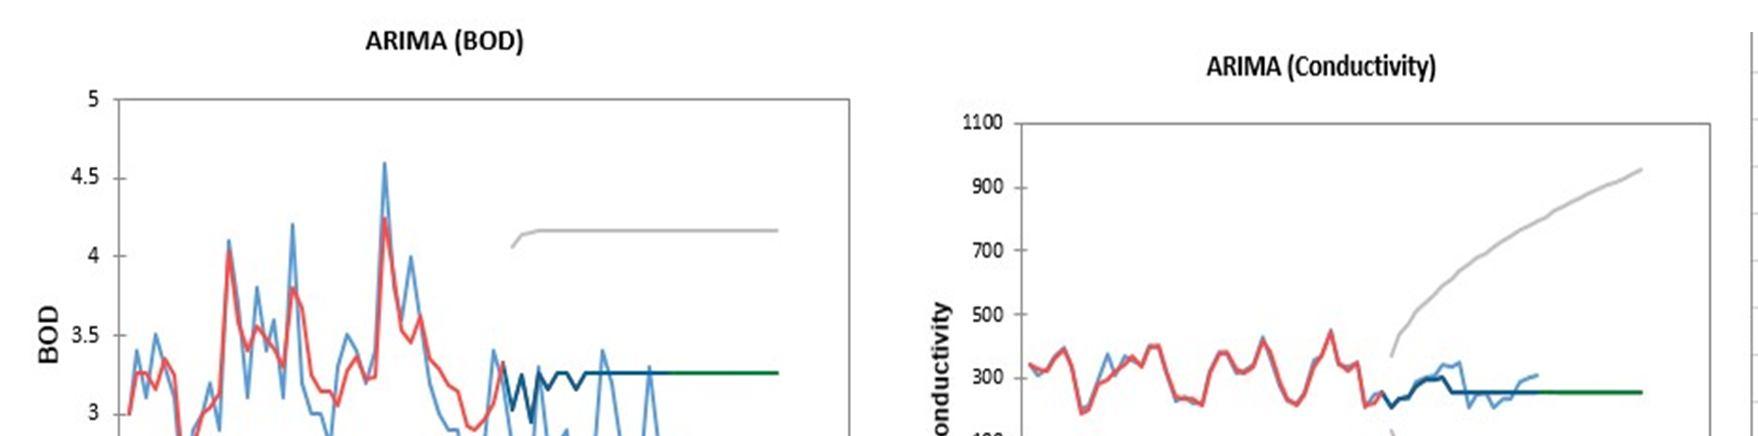
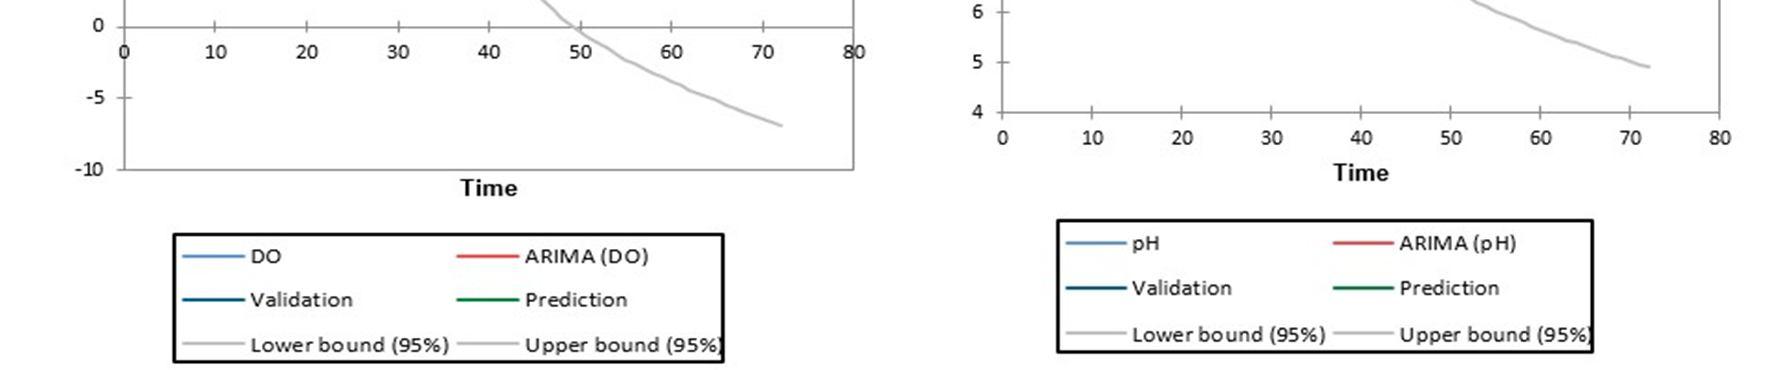
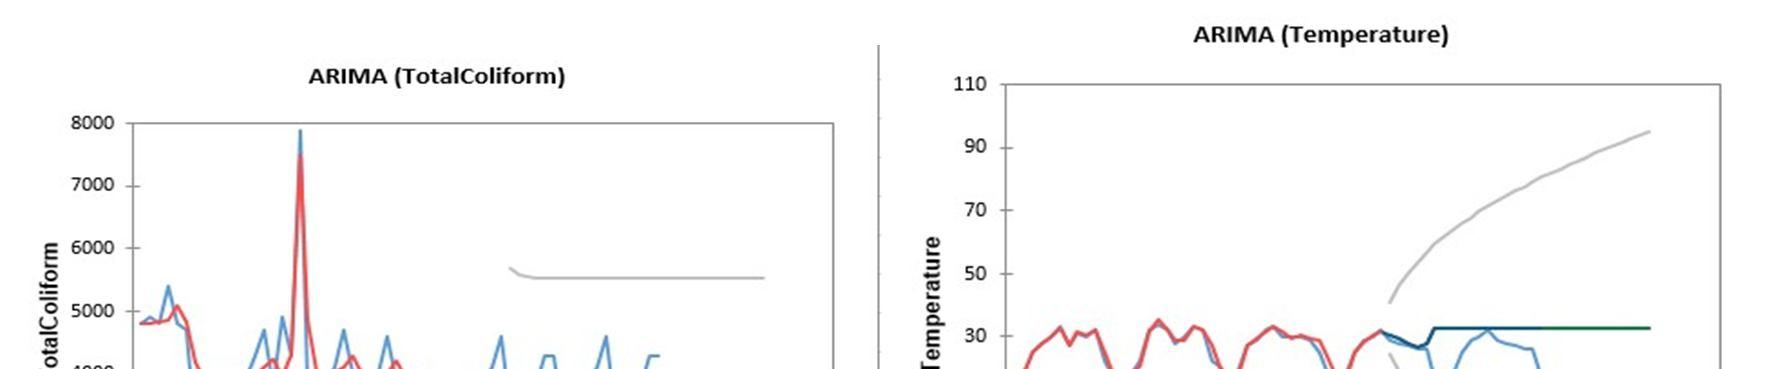
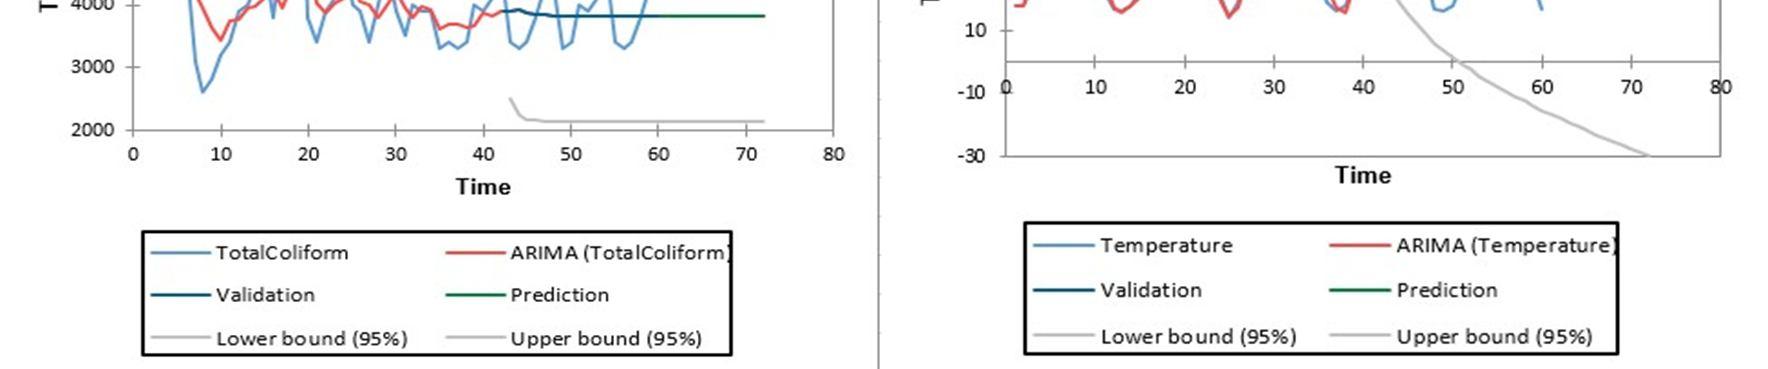
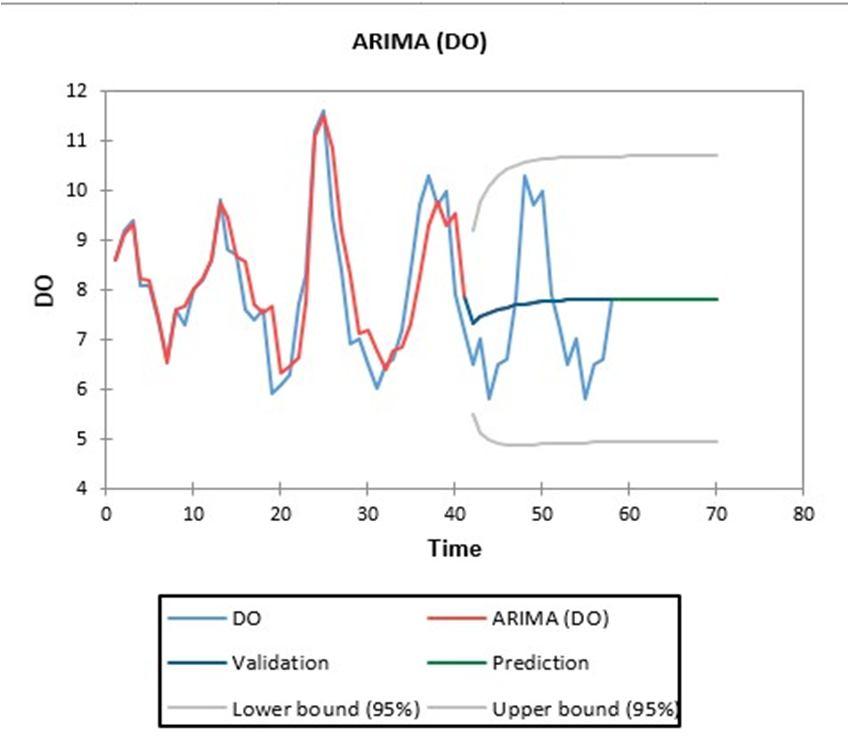
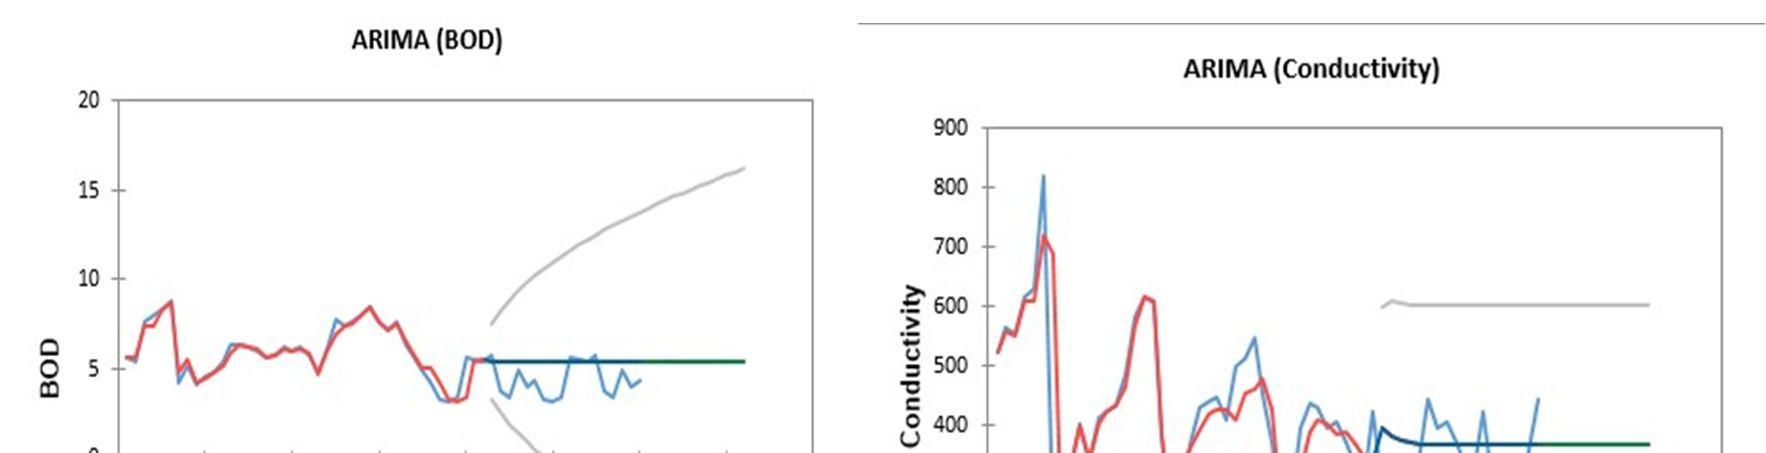
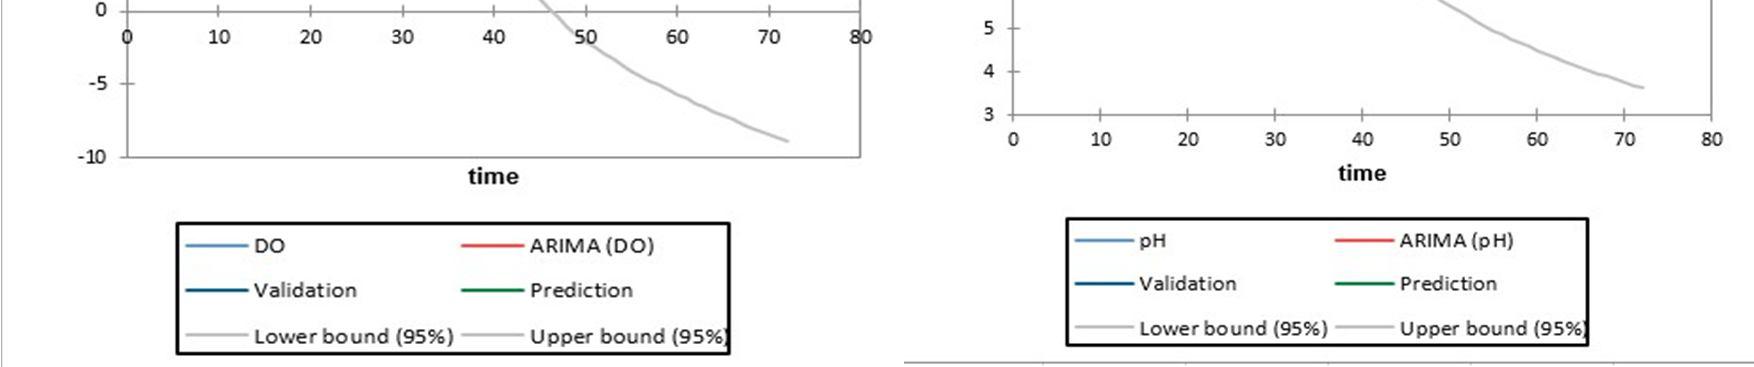
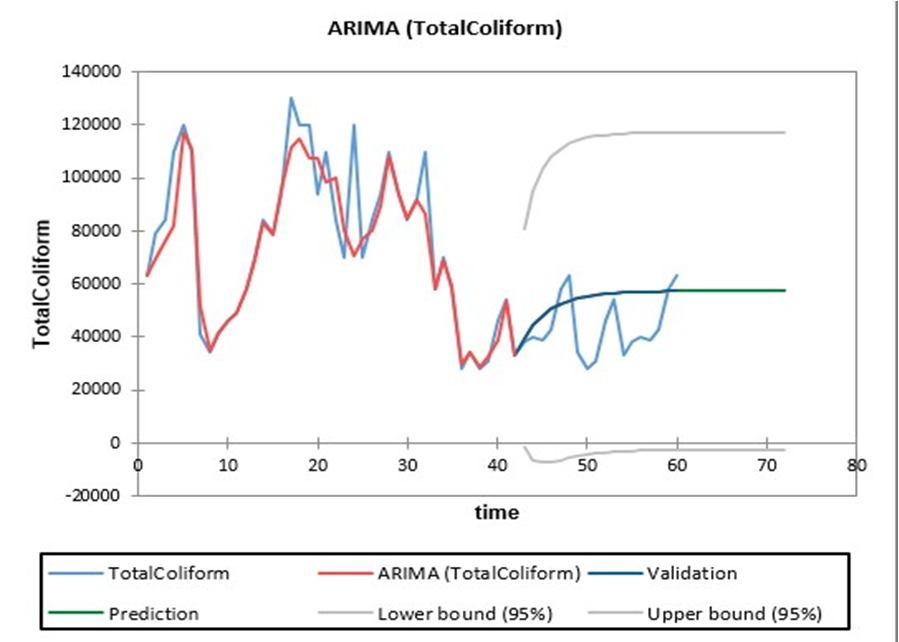
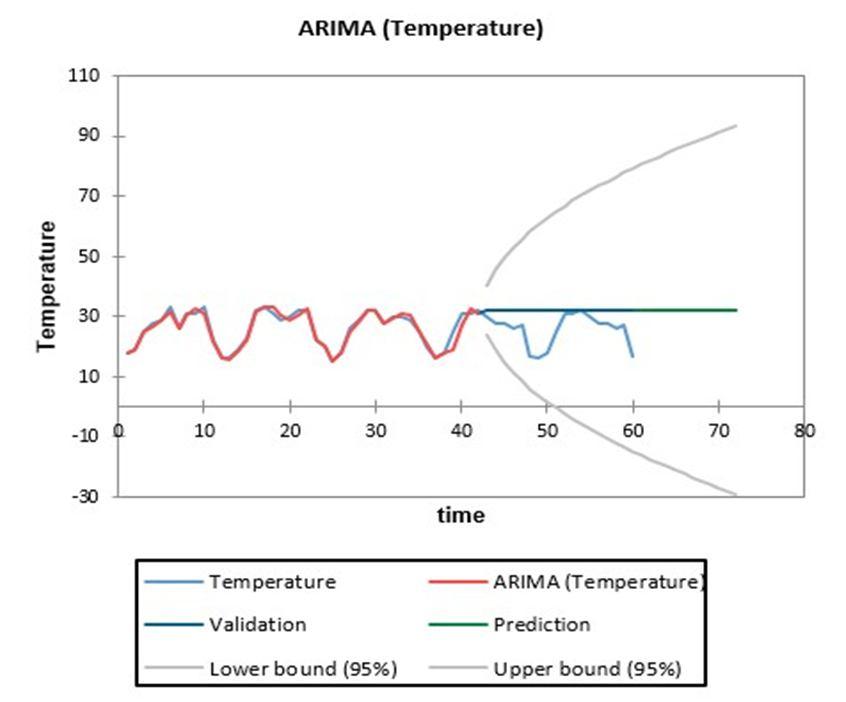
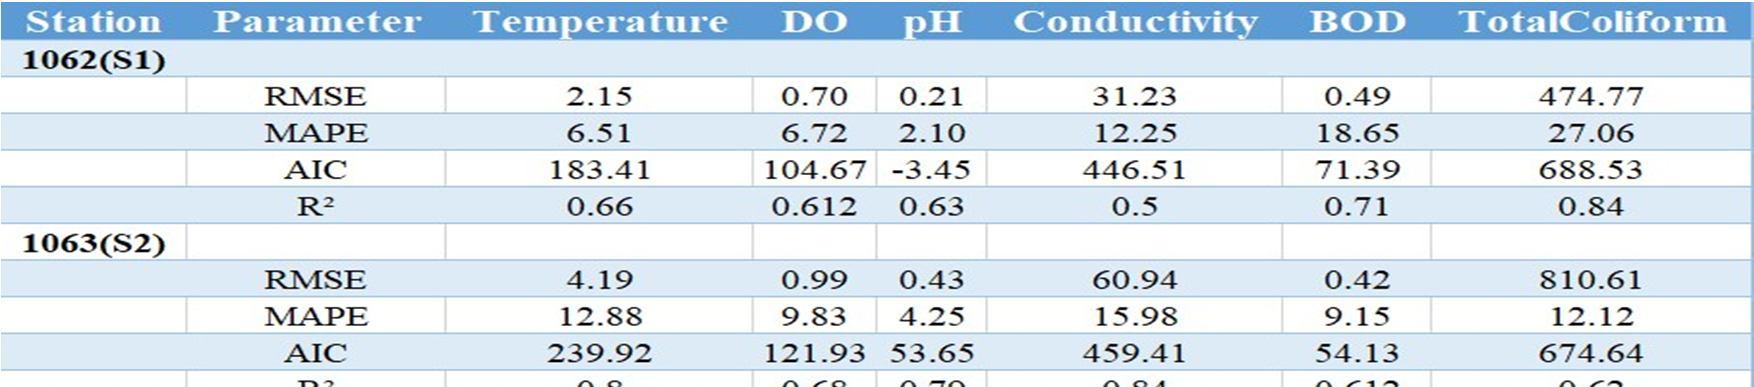
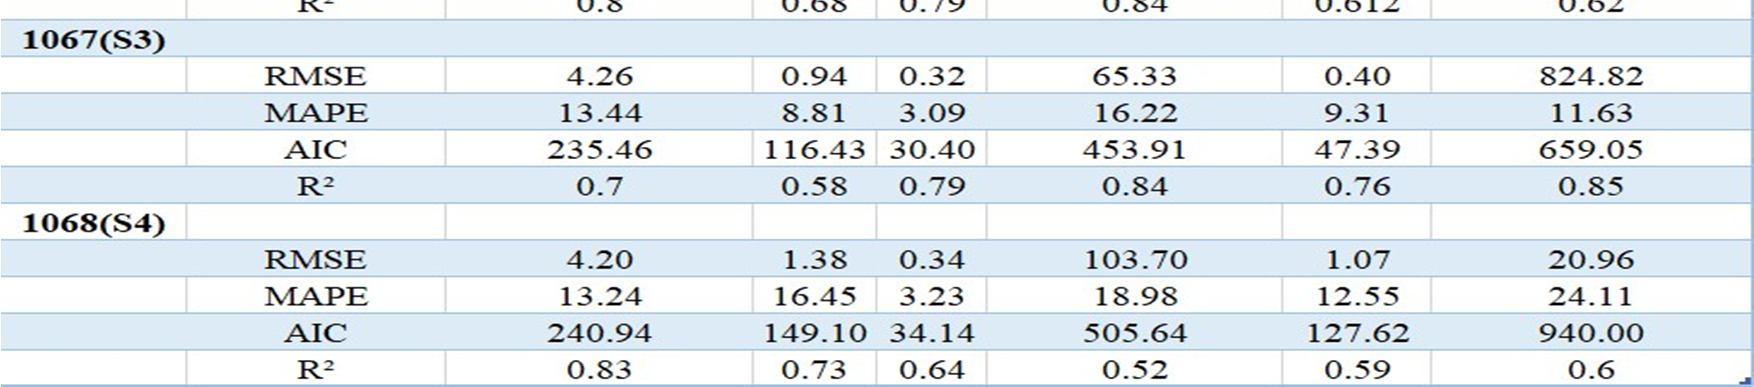
The following data is observed on the stations : Figure 2; Stastical analysis of station S1, S2, S3 and S4 III. RESULT AND DISCUSSION Model performance was estimated by RMSE, MAPE, AIC and R2 for the water quality parameters Dissolved Oxygen, BOD, pH, Temperature, Electrical Conductivity and Total Coliform. In summary, the ARIMA model performed significantly better prediction of temperature, total coliform and conductivity in compare of other water quality parameter pH, BOD and DO. Furthermore, different prediction performance can be found for the four sites The results for monthly surface water quality are shown in Figure 3, 4, 5 and 6. The prediction of station S1 are
International Journal for Research in Applied Science & Engineering Technology (IJRASET) ISSN: 2321 9653; IC Value: 45.98; SJ Impact Factor: 7.538 Volume 10 Issue VIII Aug 2022 Available at www.ijraset.com 1722©IJRASET: All Rights are Reserved | SJ Impact Factor 7.538 | ISRA Journal Impact Factor 7.894 | A. Data Source For this analysis and prediction the data is taken from the Central Pollution Control Board (CPCB). Monthly data is taken from the 2016 to 2020 for the 6 surface water quality parameter and it is arranged in the MS Excel for the further calculation and the analysis. The following parameter which is taking in this study is Dissolved Oxygen, BOD, pH, Temperature, Electrical Conductivity and Total Coliform. B. Data Statistics

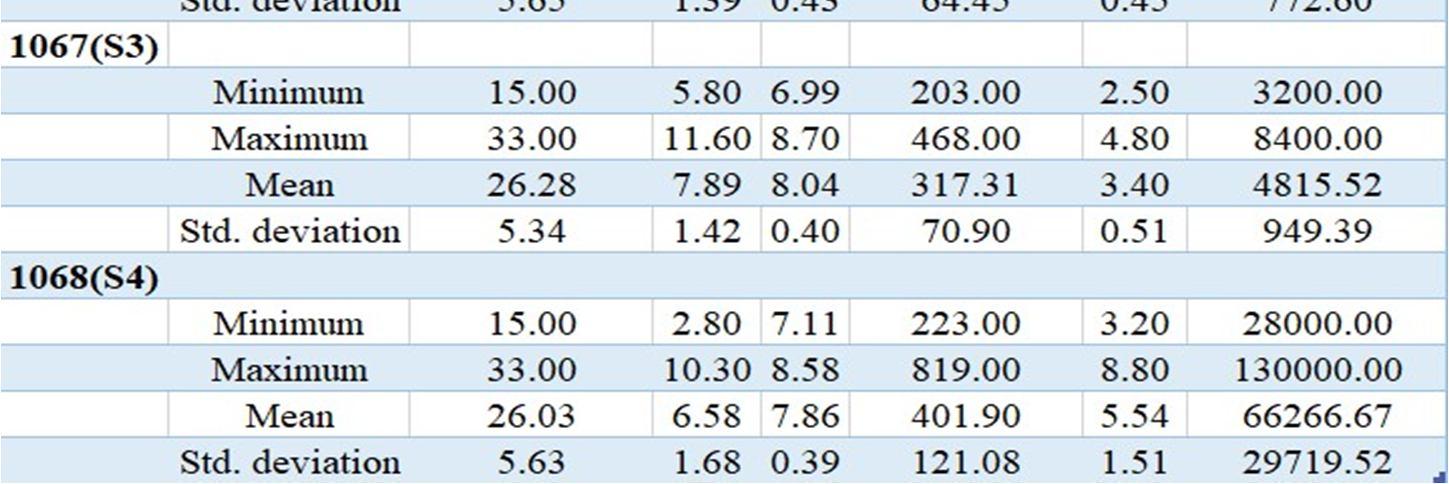
International Journal for Research in Applied Science & Engineering Technology (IJRASET) ISSN: 2321 9653; IC Value: 45.98; SJ Impact Factor: 7.538 Volume 10 Issue VIII Aug 2022 Available at www.ijraset.com 1723©IJRASET: All Rights are Reserved | SJ Impact Factor 7.538 | ISRA Journal Impact Factor 7.894 | Figure 3; Performence of ARIMA model for station S1 The prediction of station S2 are


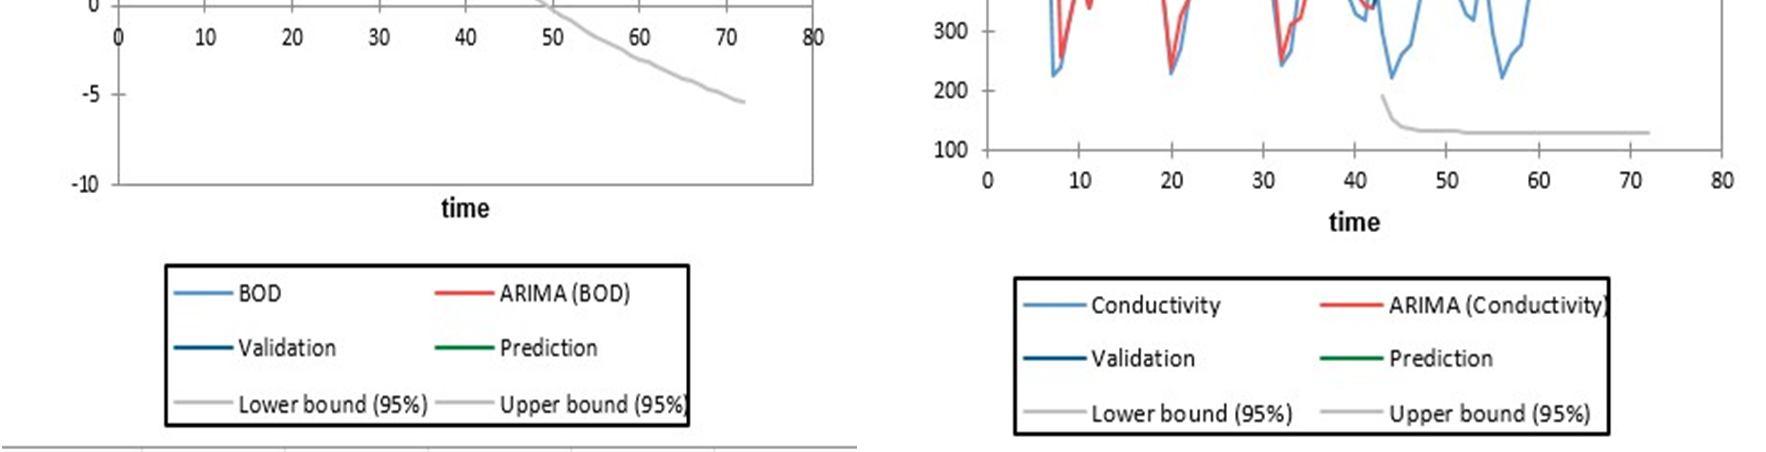
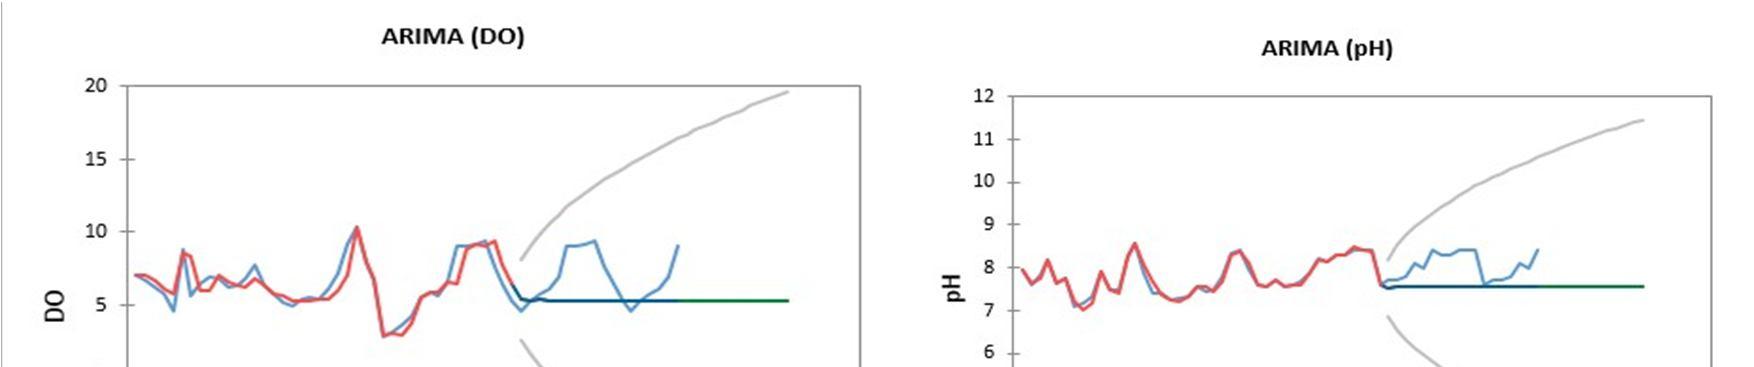
International Journal for Research in Applied Science & Engineering Technology (IJRASET) ISSN: 2321 9653; IC Value: 45.98; SJ Impact Factor: 7.538 Volume 10 Issue VIII Aug 2022 Available at www.ijraset.com 1724©IJRASET: All Rights are Reserved | SJ Impact Factor 7.538 | ISRA Journal Impact Factor 7.894 | Figure 4; Performence of ARIMA model for station S2 The prediction of station S3 are


International Journal for Research in Applied Science & Engineering Technology (IJRASET) ISSN: 2321 9653; IC Value: 45.98; SJ Impact Factor: 7.538 Volume 10 Issue VIII Aug 2022 Available at www.ijraset.com 1725©IJRASET: All Rights are Reserved | SJ Impact Factor 7.538 | ISRA Journal Impact Factor 7.894 | Figure 5; Performence of ARIMA model for station S3 The prediction of station S4 are


International Journal for Research in Applied Science & Engineering Technology (IJRASET) ISSN: 2321 9653; IC Value: 45.98; SJ Impact Factor: 7.538 Volume 10 Issue VIII Aug 2022 Available at www.ijraset.com 1726©IJRASET: All Rights are Reserved | SJ Impact Factor 7.538 | ISRA Journal Impact Factor 7.894 | Figure 6; Performence of ARIMA model for station S4 IV. CONCLUSIONS The paper shows the prediction efficiency and error on the all selected locations for which analysis is done. The results shows for S1 station that this model is able to predict the best value for the total coliform with 0.84 R2 value and conductivity has lower value 0.5 R2 . However, station S2 has highest efficiency 0.8 for the temperature and min value 0.612 for the BOD. station S3 has highest efficiency .85 for the total coliform and min value 0.58 for the DO. station S4 has highest efficiency .83 for the temperature and min value 0.52 for the conductivity.Figure 7; Performence of ARIMA model for different water quality parameter
[7] Matta, G., Kumar, A., Nayak, A., Kumar, P., Kumar, A., & Tiwari, A. K. (2020). Determination of water quality of Ganga River System in Himalayan region, referencing indexing techniques. Arabian Journal of Geosciences, 13(19), 1 11. [8] Hassan, M. M., Hassan, M. M., Akter, L., Rahman, M. M., Zaman, S., Hasib, K. M & Mollick, S. (2021). Efficient Prediction of Water Quality Index (WQI) Using Machine Learning Algorithms. Human Centric Intelligent Systems, 1(3 4), 86 97. [9] Abdelmalik, K.W. (2016). Role of statistical remote sensing for Inland water quality parameters prediction. Egypt. J. Remote Sensing Space Sci. 21, 154. [10] Avila, R., Horn, B., Moriarty, E., Hodson, R., and Moltchanova, E. (2018). Evaluating statistical model performance in water quality prediction. J. Environ. Manage. 206, 910. [11] Bedri, Z., Corkery, A., O’Sullivan, J.J., Deering, L.A., and Demeter, K. (2016). Evaluating a microbial water quality prediction model for beach management under the revised EU Bathing Water Directive. J. Environ. Manage. 167, 49. [12] Chou, J.S., Ho, C.C., and Hoang, H.S. (2018). Determining quality of water in reservoir using machine learning. Ecol. Inform. 44, 57. [13] Malek, N. H. A., Yaacob, W. F. W., Nasir, S. A. M., & Shaadan, N. (2021, November). The Effect of Chemical Parameters on Water Quality Index in Machine Learning Studies: A Meta Analysis. In Journal of Physics: Conference Series (Vol. 2084, No. 1, p. 012007). IOP Publishing. [14] Paliwal, R., Sharma, P., & Kansal, A. (2007). Water quality modelling of the river Yamuna (India) using QUAL2E UNCAS. Journal of Environmental Management, 83(2), 131 144.
International Journal for Research in Applied Science & Engineering Technology (IJRASET) ISSN: 2321 9653; IC Value: 45.98; SJ Impact Factor: 7.538 Volume 10 Issue VIII Aug 2022 Available at www.ijraset.com 1727©IJRASET: All Rights are Reserved | SJ Impact Factor 7.538 | ISRA Journal Impact Factor 7.894 | In summary, we can see that ARIMA model is giving the better prediction of temperature, total coliform and conductivity in compare of other water quality parameter pH, BOD and DO. This complete analysis provides an information base to be used by regulators and policymakers for reconciling the competing interests in the Ganga river through delivering solutions to improve, monitor clean up, maintain water quality and restore its ecosystem. V. ACKNOWLEDGEMENTS
[1] Wang, J., Zhang, L., Zhang, W., & Wang, X. (2019). Reliable model of reservoir water quality prediction based on improved ARIMA method. Environmental Engineering Science, 36(9), 1041 1048. [2] Bagla, P., Kumar, K., Sharma, N., & Sharma, R. (2021). Multivariate Analysis of Water Quality of Ganga River. Journal of The Institution of Engineers (India): Series B, 102(3), 539 549. [3] Bhutiani, R., Khanna, D. R., Kulkarni, D. B., & Ruhela, M. (2016). Assessment of Ganga river ecosystem at Haridwar, Uttarakhand, India with reference to Water Quality Indices. Applied Water Science, 6(2), 107 113. [4] Ighalo, J. O., Adeniyi, A. G., & Marques, G. (2021). Artificial intelligence for surface water quality monitoring and assessment: a systematic literature analysis. Modeling Earth Systems and Environment, 7(2), 669 681. [5] Zhang, Y. F., Thorburn, P. J., Xiang, W., & Fitch, P. (2019). SSIM A deep learning approach for recovering missing time series sensor data. IEEE Internet of Things Journal, 6(4), 6618 6628. [6] Ahmed, U., Mumtaz, R., Anwar, H., Shah, A. A., Irfan, R., & García Nieto, J. (2019). Efficient water quality prediction using supervised machine learning. Water, 11(11), 2210.
The author wishes to express his paramount gratitude to Asst. Prof. Dr. Anirudh Gupta CED, IET Lucknow, their scholarly guidance and constructive feedback have been a source of inspiration and motivation to complete this paper and the Central Pollution Control Board (CPCB) for providing the essential data for conducting this paper
REFERENCES