10 X October 2022 https://doi.org/10.22214/ijraset.2022.47181
ISSN: 2321 9653; IC Value: 45.98; SJ Impact Factor: 7.538 Volume 10 Issue X Oct 2022 Available at www.ijraset.com

ISSN: 2321 9653; IC Value: 45.98; SJ Impact Factor: 7.538 Volume 10 Issue X Oct 2022 Available at www.ijraset.com
K. V. Siva Prasad Reddy1 , G.Yamini2 , T. Nandini3 , V. Thanuja4
1Assistant Professor, 2, 3, 4Student, Department Of Computer Science and Engineering, JNTUA College Of Engineering, (AUTONOMOUS) Pulivendula, Andhra Pradesh, India

Abstract: In this research paper, we have carried out a Logistic regression Model utilizing a heart dataset. First We utilized Linear Regression however it didn't give exact results.So we utilized Logistic Regression which at long last aided in foreseeing regardless of whether a specific individual gets a respiratory failure. A heart attack, likewise called a myocardial localized necrosis, happens when a piece of the heart muscle doesn't get sufficient blood. The additional time that elapses without treatment to re-establish blood stream, the more noteworthy the harm to the heart muscle. Coronary vein illness (CAD) is the primary driver of heart attack. We attempted to foresee whether an individual gets respiratory failure via preparing a model with some heart related features.
Keywords: Cholesterol, Heart attack, Logistic Regression, Linear Regression
Here we applied machine learning techniques. It consists, three types of problems namely: classification, regression, and clustering. Based on the availability of types and divisions of learning set one may need to select from the available techniques of “supervised learning”, “unsupervised learning”, “semi supervised learning” and “reinforcement learning” to apply the suitable algorithm. Here we have the problem that comes under classification algorithms. Here we compare Logistic Regression and Linear Regression. We compare these two algorithms and to get to know, which algorithm is having more accuracy and we apply that machine learning algorithm on our problem.
Linear regression analysis is used to predict variable value based on the value of another variable as shown in Figure 1. The variable you want to predict is called the dependent variable. The variable you use to predict the value of the other variable is called the independent variable.
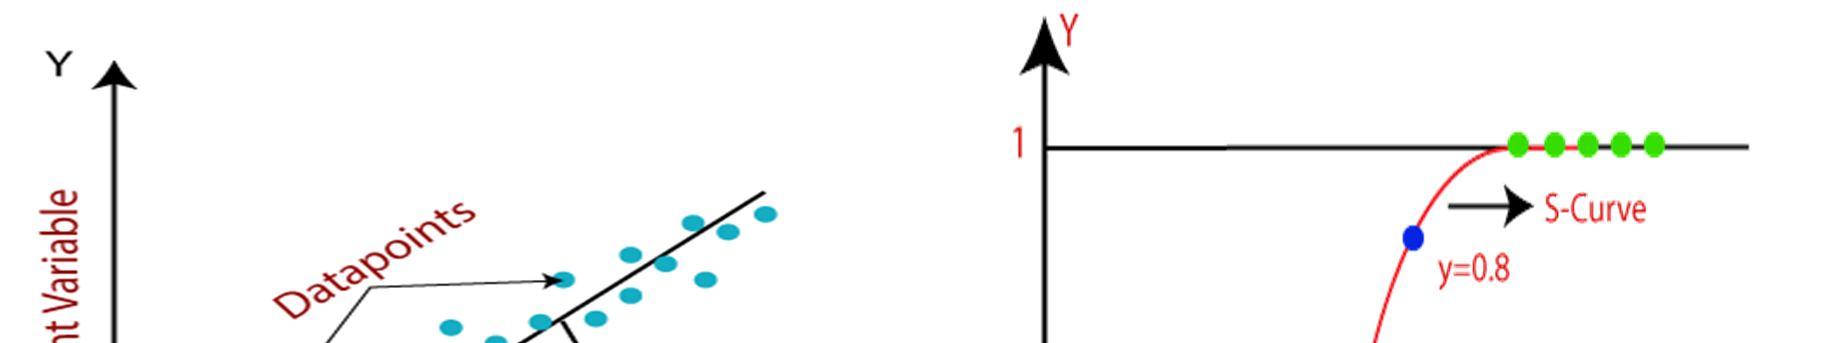

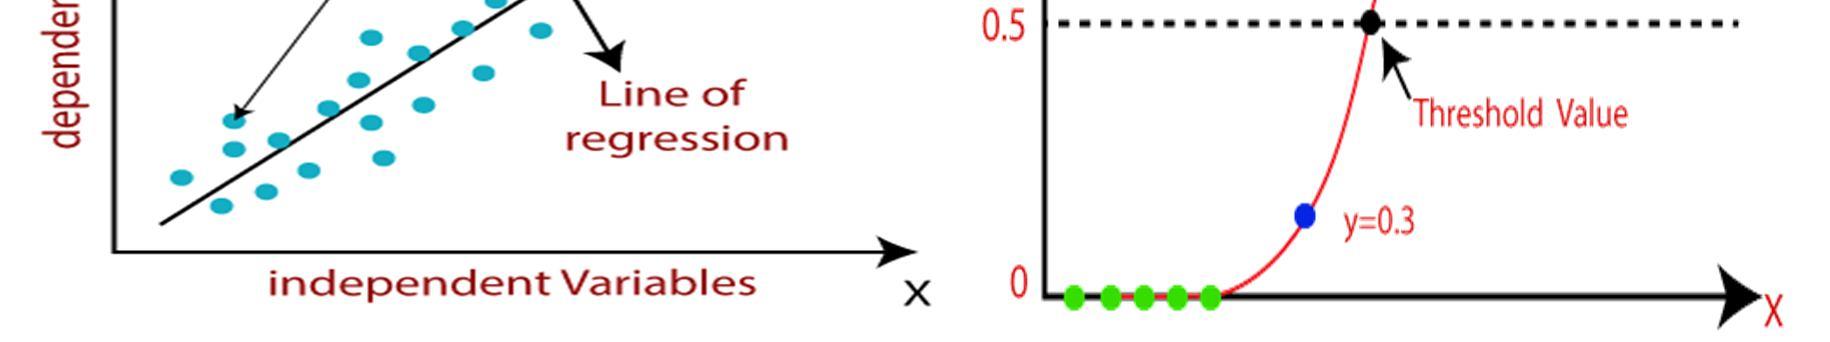
Logistic regression is a process of modelling the probability of a discrete outcome given an input variable as shown in Figure 2. The most common logistic regression models a binary outcome; something that can take two values such as true/false, yes/no, and so on. Fig 1 Linear Regression Fig 2 Logistic Regression
ISSN: 2321 9653; IC Value: 45.98; SJ Impact Factor: 7.538 Volume 10 Issue X Oct 2022 Available at www.ijraset.com
There are many similarities for reduced dose and full dose using two strategies they are, Image similarity based strategy and perfusion based strategy. After performing these strategies there will be immerse effect on image constructions used, in order to overcome that we use Reconstruction methods and to validate the personalized dose, which can be identified from the mentioned strategies we perform ROC(receiver operating characteristics), We call this study as Validation of personalized doses using ROC study as given in [1].
We can predict personalized doses using machine learning models. Here we will be using three specific models . From [2],The models are Personalized Dose prediction model, Patient attribute model and Personalized Dose models performs on basis of Reconstructions methods and then we do model training and testing .
It should be noted that the first two models seek to attain the same performance for each reconstruction algorithm with tailored dose as with full clinical dose. The third model seeks to increase dose reduction while preserving the full dose FBP's diagnostic efficacy, which is still frequently utilised in the clinic
Furthermore, we calculated the typical tailored dose levels using the various models and compared them to the whole dose. In order to evaluate the effectiveness of the personalized dose models for perfusion defect detection tests, we also carried out a ROC research, which was taken From[4].
The dataset used in this research is taken from Kaggle.com. The dataset is chosen because it contains all the necessary information that is required for our research paper. Here we have taken heart dataset. There are 76 properties in this database, but all published studies only mention using a subset of 14, as seen in Table 1. The "target" column relates to the patient's existence of heart disease, and the The only database that ML researchers have utilised so far is the Cleveland database in particular. Its value is an integer of 0 for no/less chance of having a heart attack and 1 for increased chance.
TABLE 1 Attributes of the heart dataset Id Sequence Age Patient age Sex Gender
chest pain type (4 values)( Cp) Chest pain type(3 types) Resting blood pressure (Trestbps) Resting blood pressure serum cholesterol in mg/dl (Chol) serum cholesterol in mg/dl fasting blood sugar > 120 mg/dl(Fbs) fasting blood sugar > 120 mg/dl resting electrocardiographic results (values 0,1,2)(Restecg)
resting electrocardiographic results (values 0,1,2)
maximum heart rate achieved exercise induced angina (Exang) exercise induced angina Oldpeak= ST depression induced by exercise relative to rest ST depression induced by exercise relative to rest the slope of the peak exercise ST segment the slope of the peak exercise ST segment number of major vessels (0 3) colored by flourosopy (Ca) number of major vessels (0 3) colored by flouroscopy thal: 0 = normal; 1 = fixed defect; 2 = reversable defect(Thal) 0 = normal; 1 = fixed defect; 2 = reversable defect target 0= low chance for heart attack 1= high chance for heart attack
maximum heart rate achieved (Thalach)
The tool used for the classification of data is Jupyter Notebook in Anaconda Navigator(Version 3).
ISSN: 2321 9653; IC Value: 45.98; SJ Impact Factor: 7.538
Volume 10 Issue X Oct 2022 Available at www.ijraset.com
The following are the classification Algorithms used: 1) Linear Regression 2) Logistic Regression.
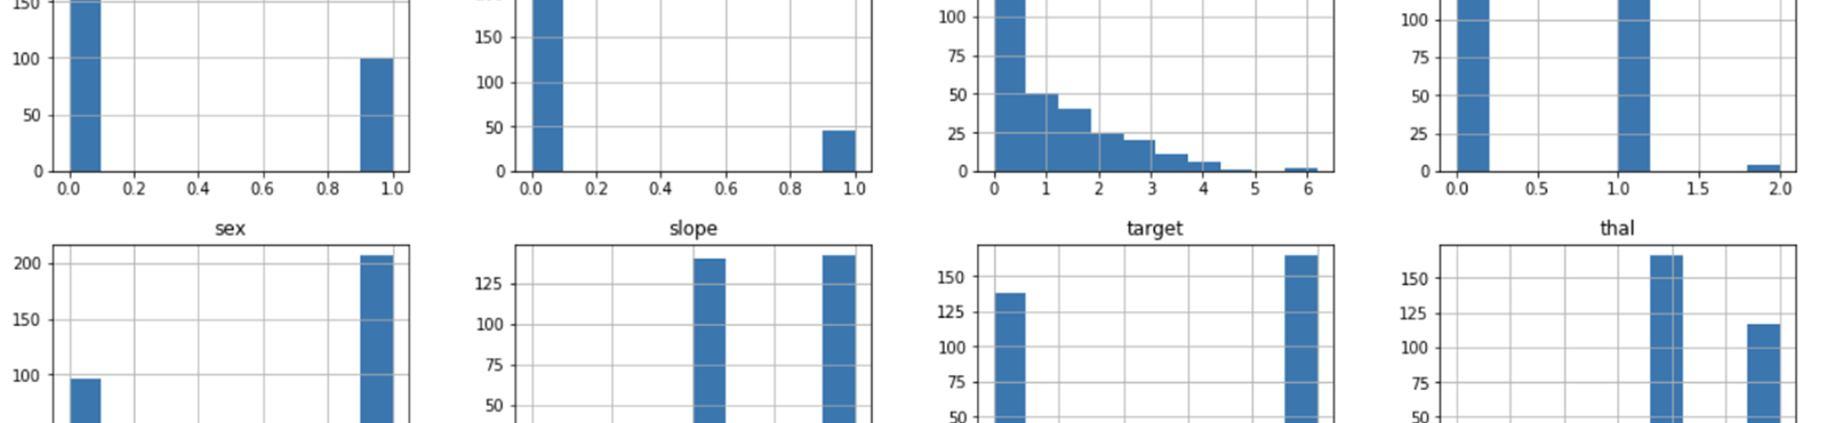
The dataset contains the following information: The analysis of the given dataset is visualized in form of the graphs.The data is collected among the persons of age between 30 80 as shown in Figure 3.
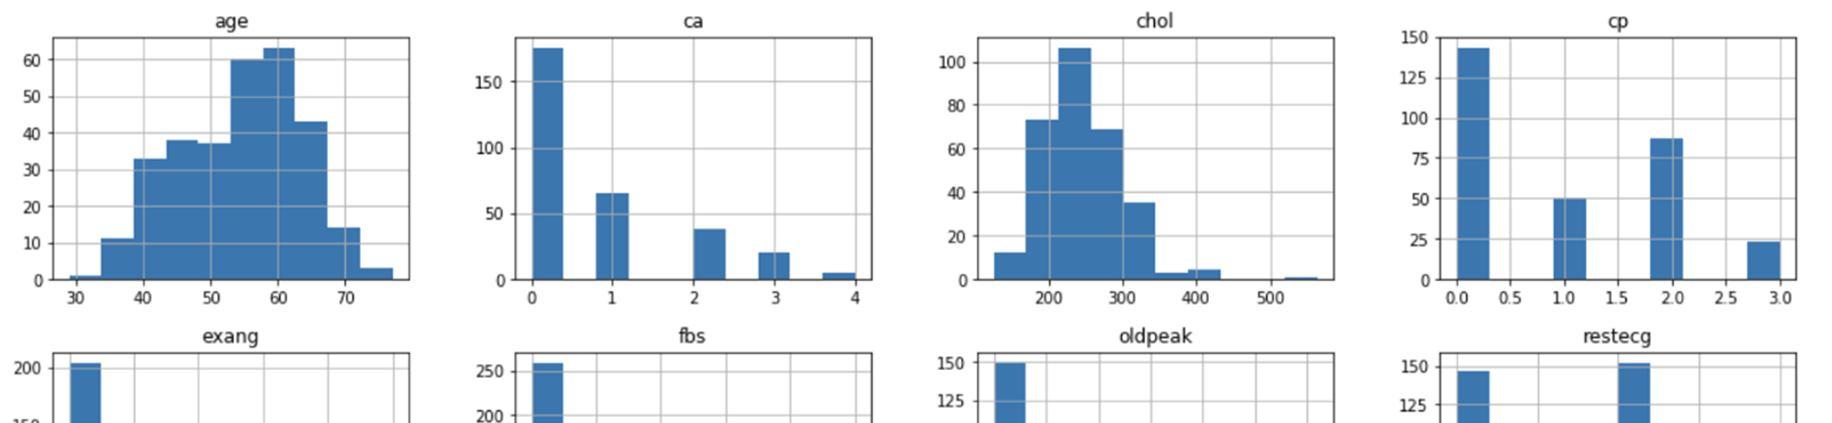
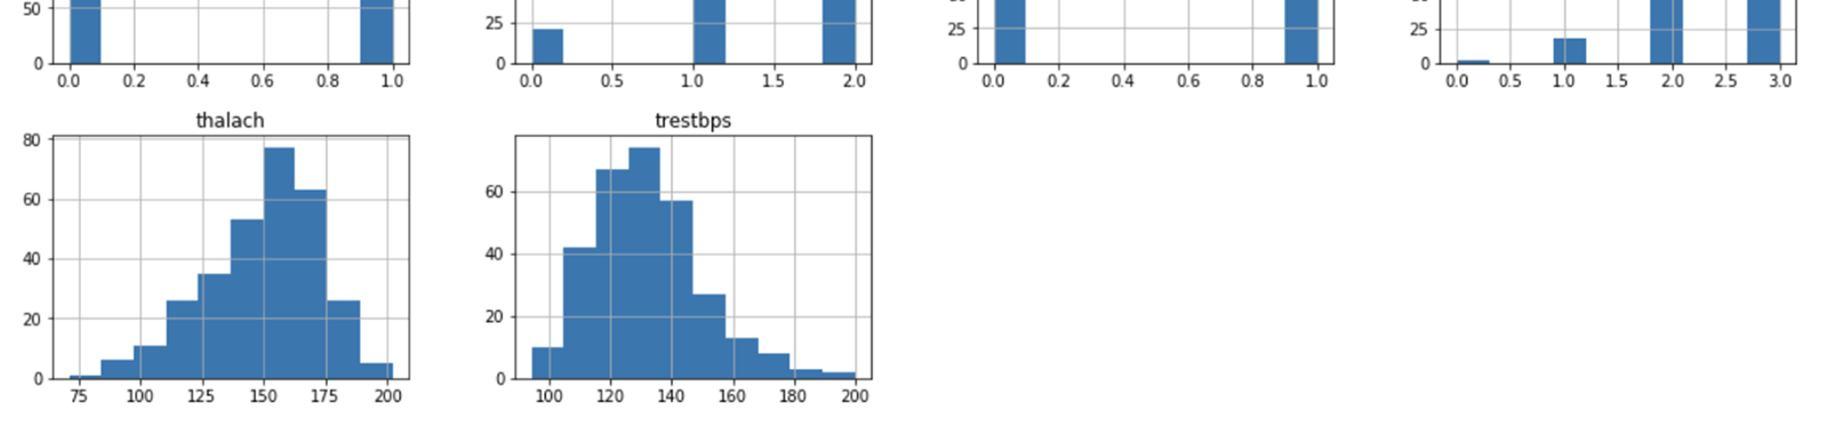
Fig 3 Analysis of the heart dataset done among persons of age between 30 80
The following results and discussions are obtained: The accuracy results obtained using Logistic Regression is: 0.8131868131868132
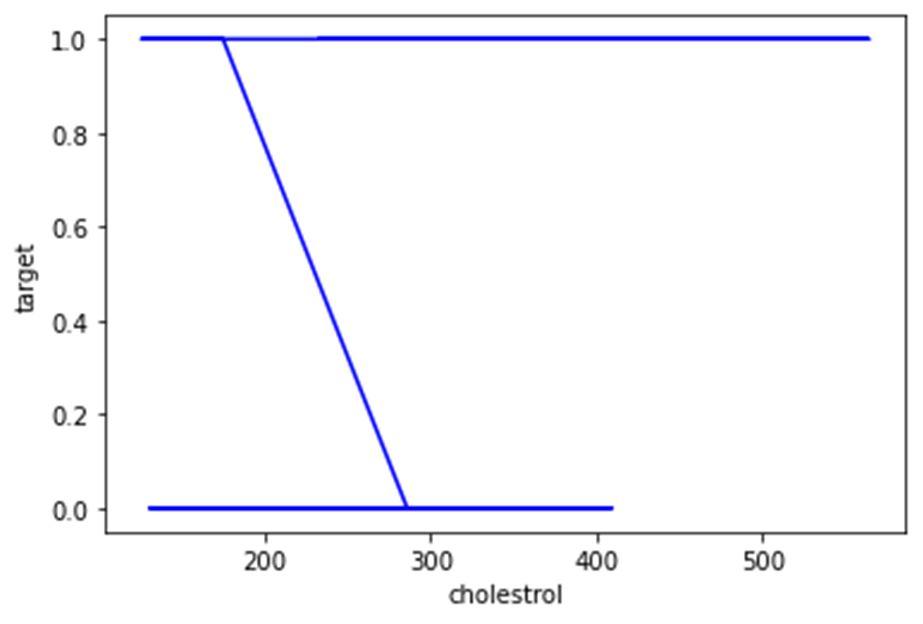
Figure 4 is the graph drawn between Cholestrol and target.
Fig 4 Graph obtained for cholesterol and target
ISSN: 2321 9653; IC Value: 45.98; SJ Impact Factor: 7.538
Volume 10 Issue X Oct 2022 Available at www.ijraset.com
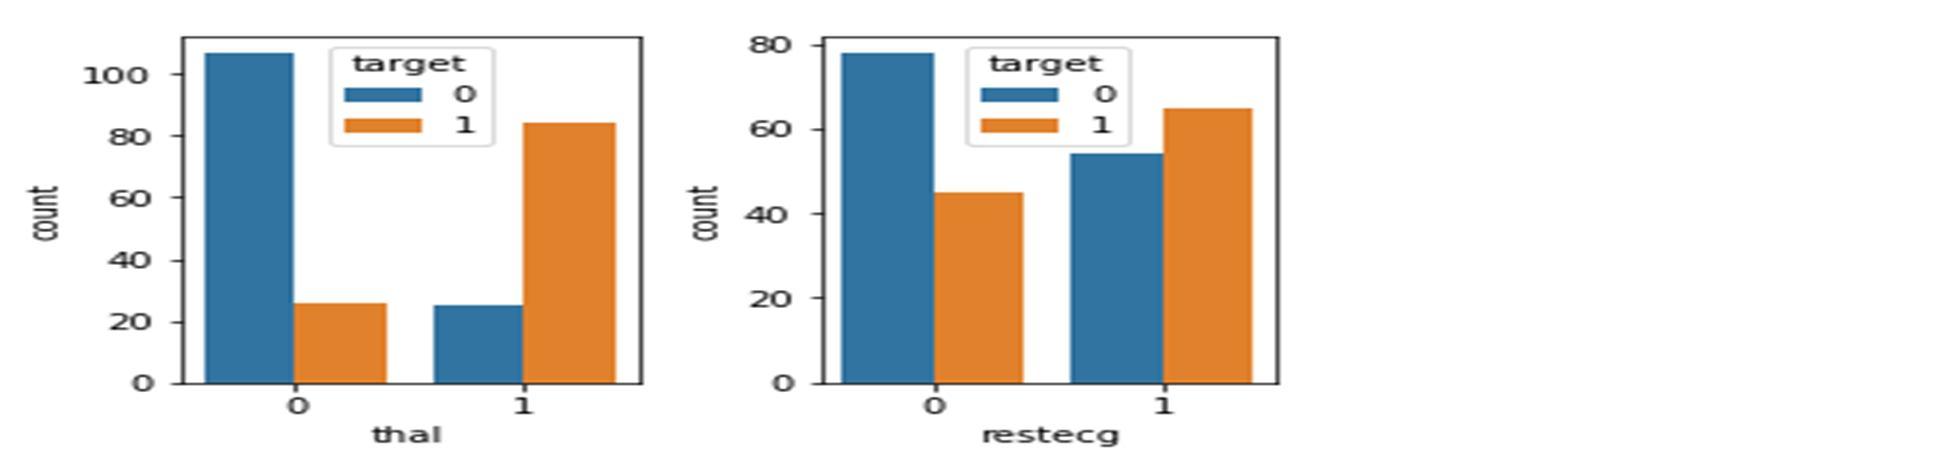
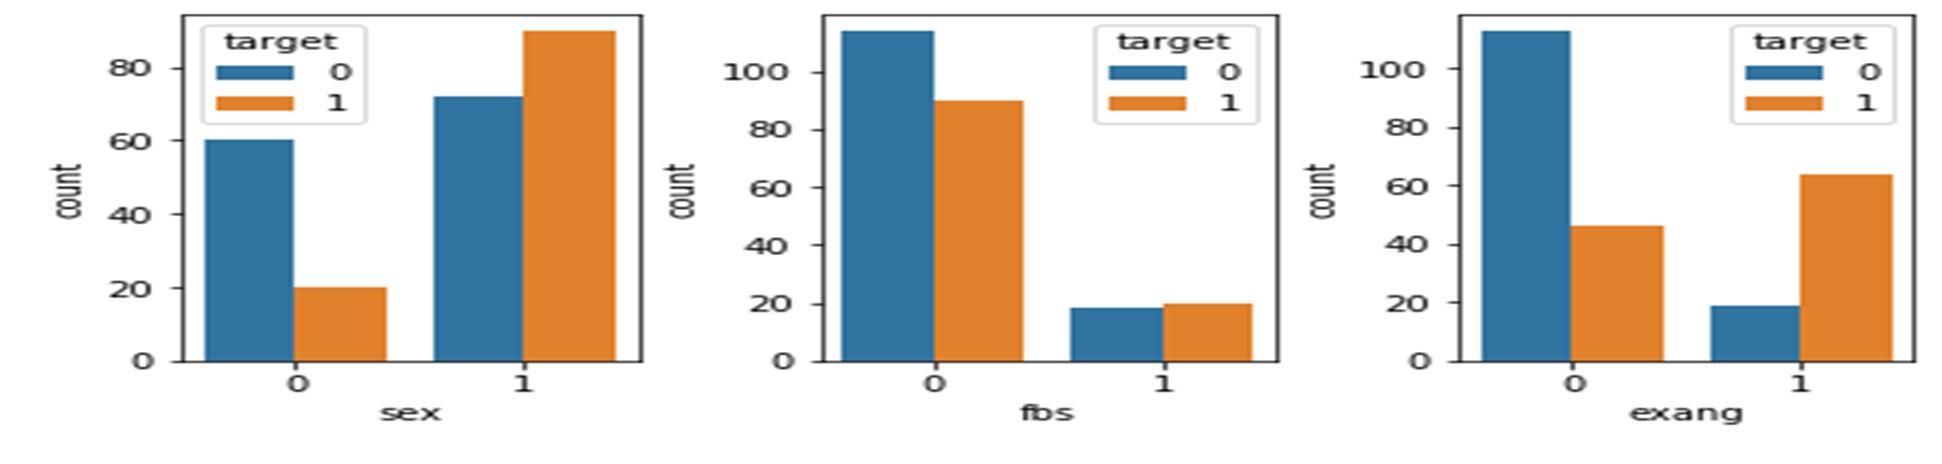
The above figure shows the count of persons getting heart attack based on level of attribute.
Logistic regression has predicted the correct results .These personalized dose models' machine learned elements included body dimensions ,physiological factors and medical problems (such as diabetes, heart disorders, etc.)..). We believe that the results can help choose the best approach for a certain research goal in a health study by elucidating the most prevalent factors that influence machine learning performance. In this work, the impact of machine learning techniques and their parameters was examined and addressed.
[1] Albert Juan Ramon, Student Member, IEEE, Yongyi Yang,* Senior Member, IEEE, P. Hendrik Pretorius, Senior Member, IEEE, IEEE, Karen L. Johnson, Michael A. King, Senior Member, IEEE, Miles N. Wernick, Senior Member, “IEEE Personalized Models for Injected Activity Levels in SPECT Myocardial Perfusion Imaging” TMI 2018 1003.R1
[2] D. J. Brenner, and E. J. Hall, “Computed Tomography An Increasing Source of Radiation Exposure,” N. Engl. J. Med., vol. 357, pp. 2277 84, 2007.
[3] “Initiative to reduce unnecessary radiation exposure from medical imaging,” US Food and Drug Administration, vol. 9, no. 2, 2010.
[4] S. D. Jerome, P. L. Tilkemeier, M. B. Farrell et al., “Nationwide laboratory adherence to myocardial perfusion imaging radiation dose reduction practices,” JACC: Cardiovascular Imaging, vol. 8, no. 10, pp. 1170 1176, 2015.
[5] A. J. Einstein, T. N. Pascual, M. Mercuri et al., “Current worldwide nuclear cardiology practices and radiation exposure: results from the 65 country IAEA Nuclear Cardiology Protocols Cross Sectional Study (INCAPS),” Eur. Heart J., vol. 36, no. 26, pp. 1689 1696, 2015.
[6] H. G. Stratmann, G. A. Williams, M. D. Wittry et al., “Exercise technetium 99m sestamibi tomography for cardiac risk stratification of patients with stable chest pain,” Circulation, vol. 89, no. 2, pp. 615 622, 1994.
[7] M. V. Narayanan, M. A. King, P. H. Pretorius et al., “Human observer receiver operating characteristic evaluation of attenuation, scatter, and resolution compensation strategies for 99mTc myocardial perfusion imaging,” J. Nucl. Med., vol. 44, no. 11, pp. 1725 1734, 2003.
[8] H. M. Hudson and R. S. Larkin, "Accelerated image reconstruction using ordered subsets of projection data," IEEE Trans. Med. Imag., vol. 13, pp. 601 609, 1994
[9] M. A. King, S. J. Glick, P. H. Pretorius, G. Wells, H. C. Gifford, M. V. Narayanan, and T. H. Farncombe, "Attenuation, Scatter, and Spatial Resolution Compensation in SPECT," in Emission Tomography: The Fundamentals of PET and SPECT, M. N. Wernick and J. N. Aarsvold, Eds., ed San Diego: Academic Press, 2004.
[10] D. J. Kadrmas, M. E. Casey, N. F. Black, J. J. Hamill, V. Y. Panin, and M. Conti, "Experimental comparison of lesion detectability for four 0278 0062 (c) 2018 IEEE. Personal use is permitted, but republication/redistribution requires IEEE permission. See http://www.ieee.org/publications_standards/publications/rights/index.html for more information. This article has been accepted for publication in a future issue of this journal, but has not been fully edited. Content may change prior to final publication. Citation information: DOI 10.1109/TMI.2018.2885319, IEEE Transactions on Medical Imaging TMI 2018 1003.R1 11 fully 3D PET reconstruction schemes," IEEE Trans. Med. Imag., vol. 28, no. 4, pp. 523 534, 2009.
[11] Q. Huang, J. You, G. L. Zeng, and G. T. Gullberg, "Reconstruction from uniformly attenuated SPECT projection data using the DBH method," IEEE Trans. Med. Imag., vol. 28, no. 1, pp. 17 29, 2009.