10 XI November 2022 https://doi.org/10.22214/ijraset.2022.47739
ISSN: 2321 9653; IC Value: 45.98; SJ Impact Factor: 7.538
Volume 10 Issue XI Nov 2022 Available at www.ijraset.com

ISSN: 2321 9653; IC Value: 45.98; SJ Impact Factor: 7.538
Volume 10 Issue XI Nov 2022 Available at www.ijraset.com


Abstract: Photovoltaic or PV for brief, may be a strategy that's interesting and particular in saddling the sun's energy. One of the comes about that ought to be taken into consideration within the utilize of solar panel is the effectiveness of the sun-based board itself, since productivity alludes to the sum of light of the full module that turns it into power. The proficiency of the solar panel will be lower on the off chance that there's a remove between the cells conjointly since the glass cover and reflect the light from the sun is retained into the cells. Thus, it ought to be given specific consideration since of the effectiveness appear precisely how much power will be produced from the sun oriented board. Gained control from the photovoltaic sun powered board may be a primary calculate reflects the board execution. This factor is influenced by numerous parameters. Dust thickness, light escalated as well as surrounding temperature have coordinated impact on the board execution. The framework offers ceaseless checking and measuring to the specified parameters in expansion to the yield control of the sun based board. The collected records are reflecting and affirming the coordinating of the changing within the natural parameters with regard to the collected control.
Keywords: Photovoltaic solar panel, gained control, data analytics
Over the past few decades, solar panels have gotten to be an exceptional venture for numerous individuals. They offer a flatboat of benefits to both commercial properties and private homes. And since they depend on the sun rather than the grid, they offer assistance protect normal assets and the environment. Solar panels are pretty low maintenance, so in the event that you choose to go with a solar based control framework, you ought to be able to harvest the benefits without much upkeep. That said, be that as it may, nothing is secure. Issues can create, so on the off chance that you ever take note anything wrong with the way your framework is working, you ought to act promptly some time recently issues decline. Efficiency of solar panels is very low currently, below 20%. Despite the efficiency being low we harness a significant amount of energy and to maximize this we majorly face 9 problems: Delamination and internal corrosion, Electrical issues, Micro cracks, Hot spots, PID effect, Birds, Snail trails, Roof issues, Inverter problems. Effective utilization of solar energy and solar panels has been a major challenge to our society. So, our goal is to monitor solar panels and provide a safety feature to address the majority of the issues.
The paper [1] is about implementation of solar power system for suitable supply of solar power through photovoltaic cell. In this LDR sensor is used for harnessing the occurrence of sunlight. It also uses the concepts of IOT for incorporating features like solar power monitoring by measuring the sun radiation ranging from high to low. C programming has been using for coding the working of the model. The paper [2] is about introducing a way to measure the characteristics of solar panels in real time and send the data in real time to android based smartphone. The method followed in this paper is to first measure the changes of values of current and temperature of PV cells. The results were recorded on day wise basis for seven days from 8 am to 4 pm. The designed monitoring system proposed in this paper has a good degree of accuracy with an average error rate of monitoring results of solar panel output value below 10%. The Arduino AT Mega 2560 also connects with the Wi Fi module as a connection to the smartphone to display the measurements of current, voltage and power of solar panel and ambient temperatures. In this paper [3] , LabVIEW software was used to simulate the monitoring of solar panel. It presents conditioning monitoring of virtual solar panels. In this type of monitoring whenever the modified parameters like maximum power, current, voltage and efficiency reach a threshold value it gives an alert which is received on a webpage that shows in which particular panel necessary action has to be taken to avoid any damage of the solar panels. The monitored parameters from the LabVIEW are uploaded to cloud using a gateway called Raspberry pi.
ISSN: 2321 9653; IC Value: 45.98; SJ Impact Factor: 7.538 Volume 10 Issue XI Nov 2022 Available at www.ijraset.com
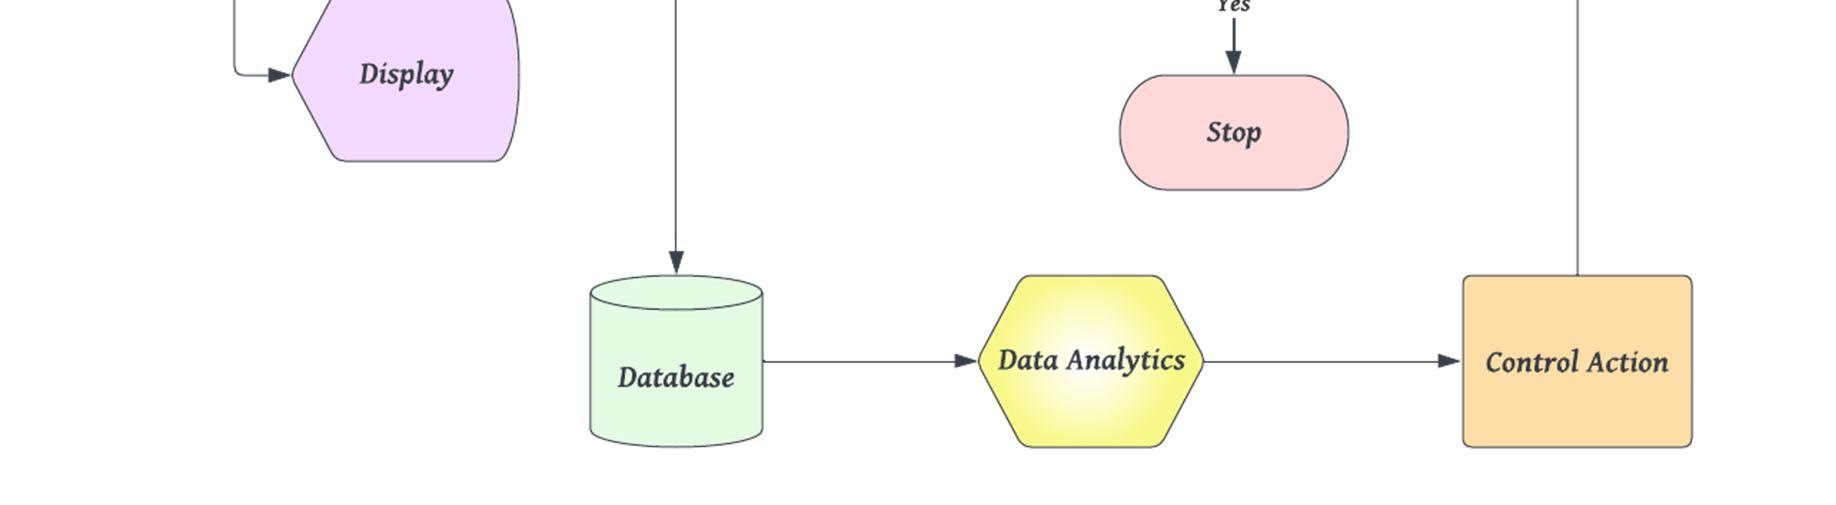
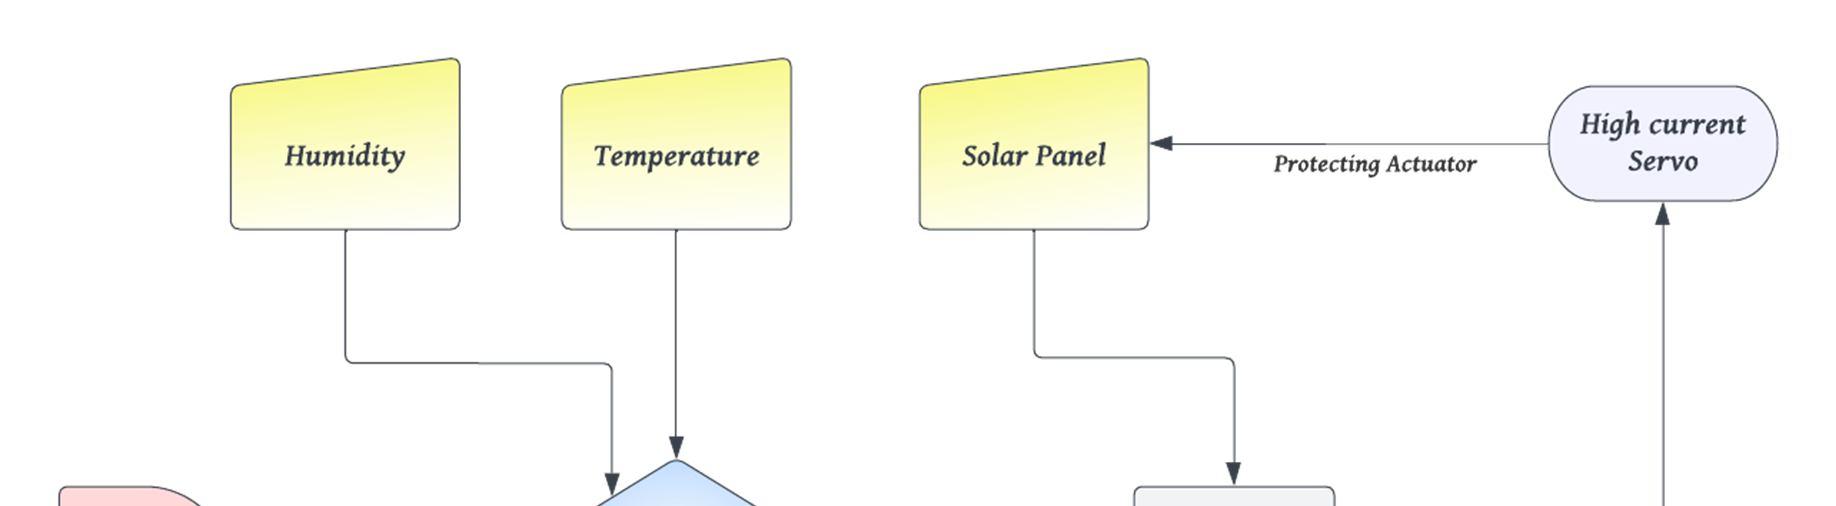
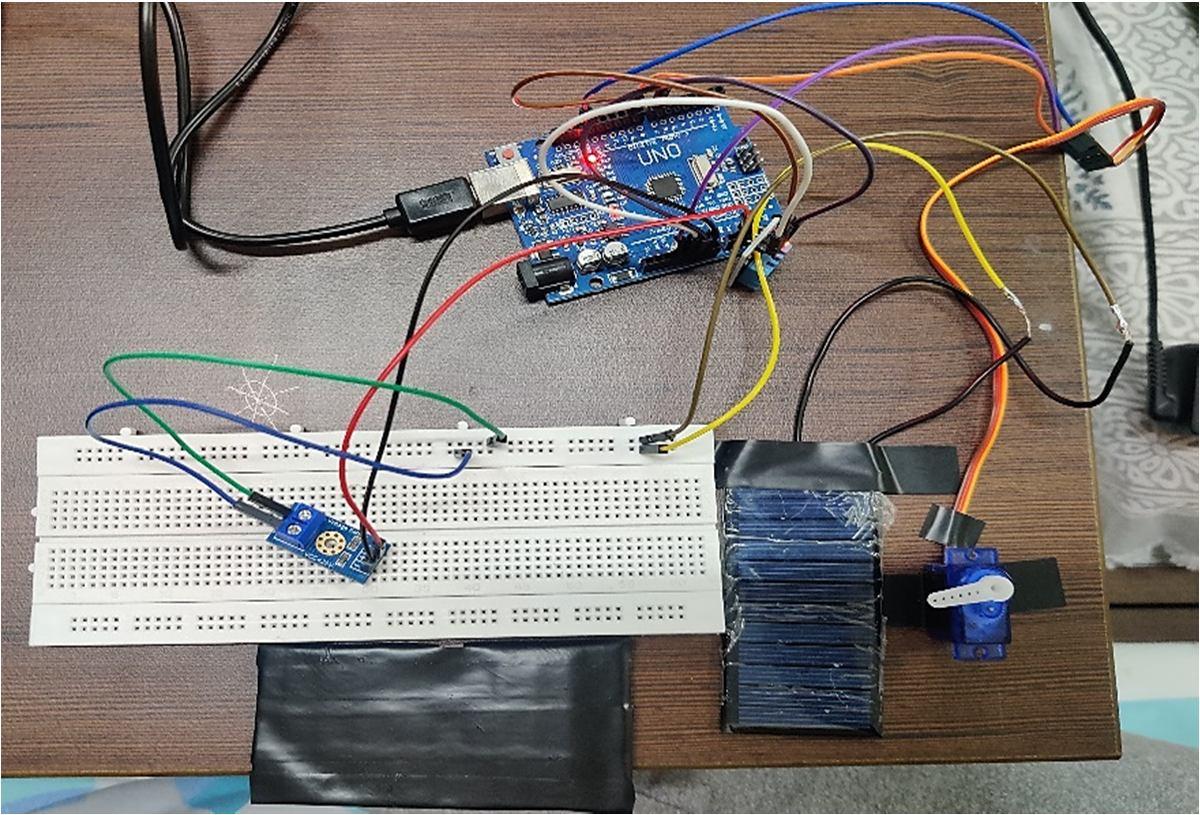
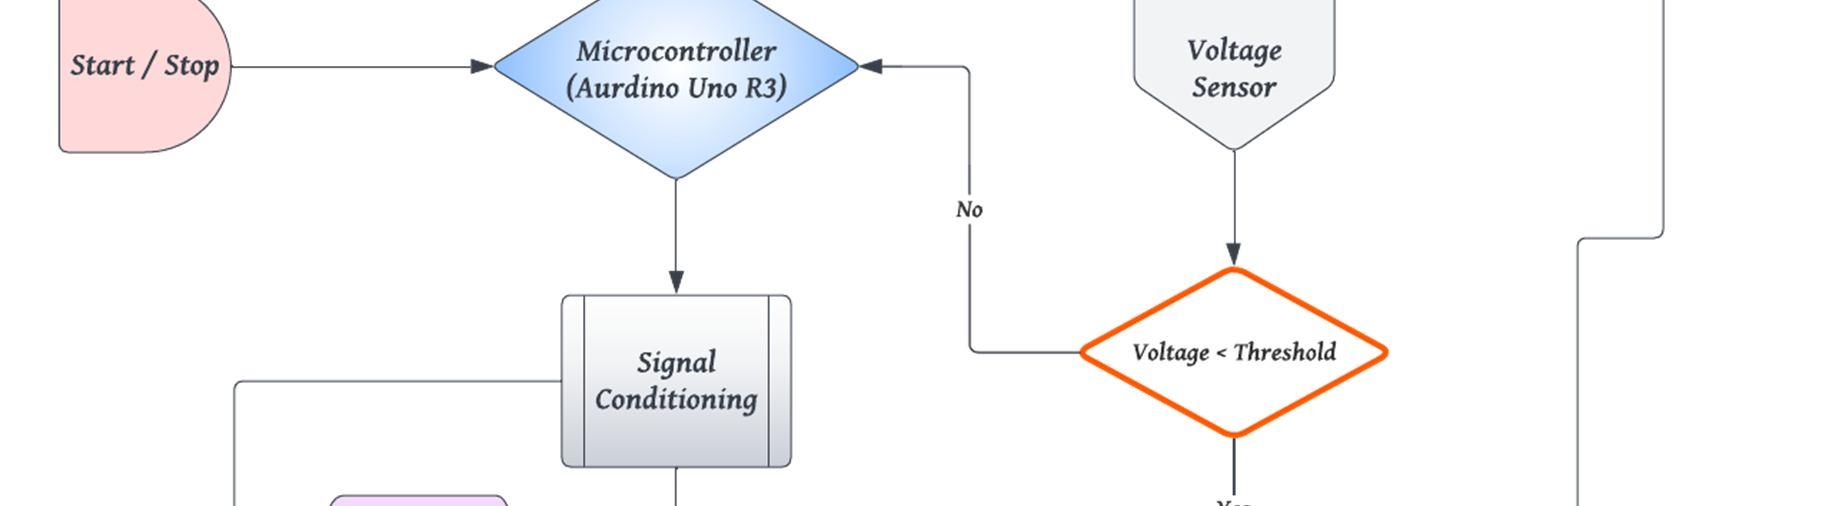
Fig.1 Implemented Block Diagram
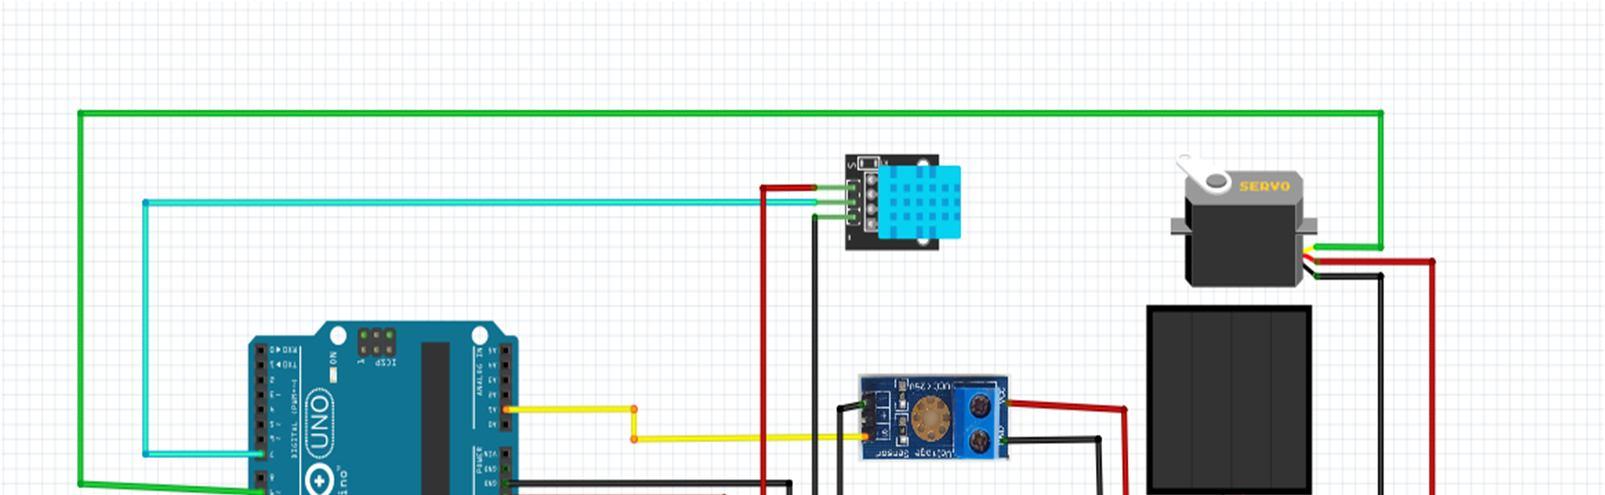
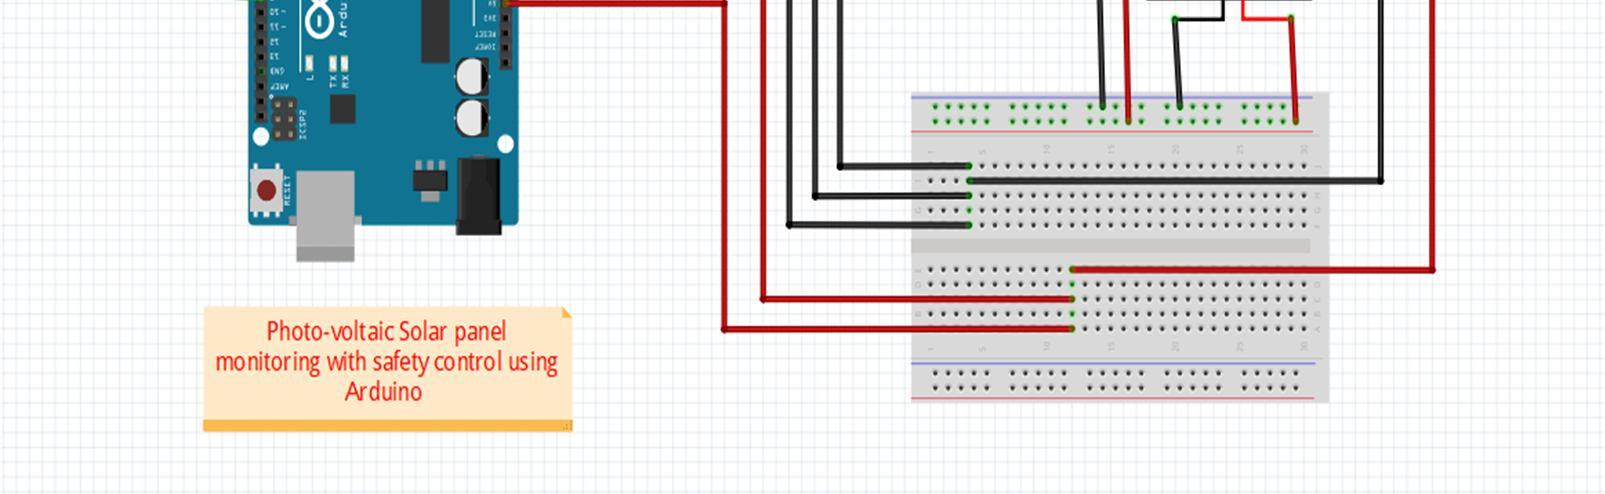
Fig. 2 Hardware setup of prototype
ISSN: 2321 9653; IC Value: 45.98; SJ Impact Factor: 7.538 Volume 10 Issue XI Nov 2022 Available at www.ijraset.com
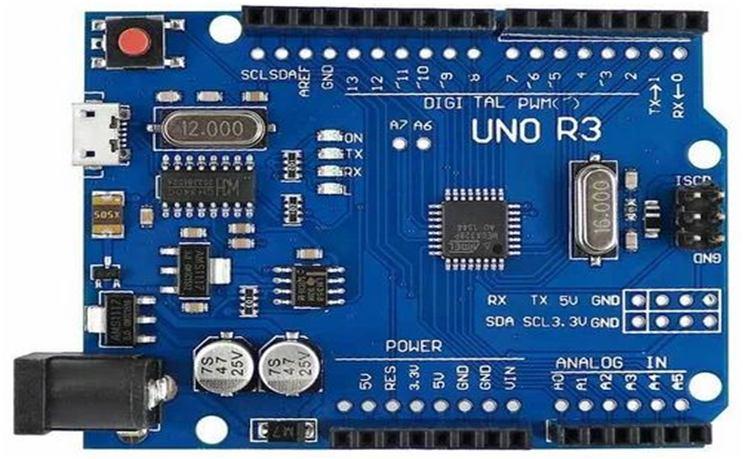
The photovoltaic solar panel is placed in such a manner that it is in direct contact with incoming sunlight. The DHT11 sensor is placed vertically beside the solar panel so as to monitor the surface of the solar panel for relative water accumulation or change in temperature gradient over the surface of the solar panel. It gives a digital output which is fed to Arduino via a digital GPIO pin. The obtained data is then displayed using DHT libraries and other formatting options into a csv format. The generated/obtained potential difference is fed to a lossless voltage sensor to measure the voltage using voltage divider circuit. The corresponding analog value is fed to Arduino UNO and is manipulated using the appropriate resistor values to get the exact voltage and then the same is appended in a csv format. The obtained CSV file is uploaded to google collab in real time and the data is analyzed to take a control action. Prior to this we already made a data set for a complete clock cycle so as to compare it with the data obtained in real time from the prototype. Based on the correlation and other factors we can take the necessary control action and send the signal to Arduino Uno which will move the actuating arm of the servo to cover the photovoltaic solar panel to provide safety.
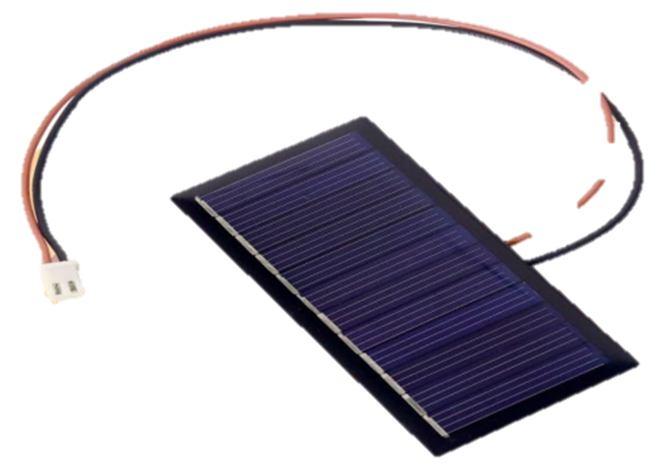
It is a 70 x 35 x 3mm rectangular shape solar panel which generates maximum output of 5W. A single solar module can provide only an inadequate amount of power. Most of the installations include multiple modules. A photovoltaic system includes an array of PV (photovoltaic) modules, an inverter, interconnection wiring, a battery pack for storage, and a solar tracking mechanism optionally.
Fig. 4: Photovoltaic solar panel
ISSN: 2321 9653; IC Value: 45.98; SJ Impact Factor: 7.538
Volume 10 Issue XI Nov 2022 Available at www.ijraset.com
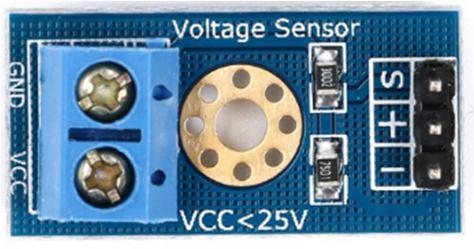
This module is based on the principle of resistive voltage divider design, can make the red terminal connector input voltage to 5 times smaller. Arduino analog input voltages up to 5 v, the voltage detection module input voltage not greater than 5Vx5=25V (if using 3.3V systems, input voltage not greater than 3.3Vx5=16.5V).
Arduino AVR chips have 10 bit AD, so this module simulates a resolution of 0.00489V (5V/1023), so the minimum voltage of input voltage detection module is 0.00489Vx5=0.02445V
Fig. 5: 25V voltage sensor
Input Voltage (V) 0 to 25 Voltage Detection Range (V) 0.02445 to 25 Analog Voltage Resolution (V) 0.00489
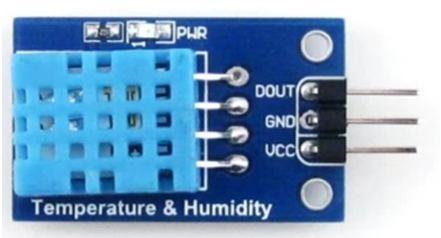
The sensor comes with a dedicated NTC to measure temperature and an 8 bit microcontroller to output the values of temperature and humidity as serial data. The sensor is also factory calibrated and hence easy to interface with other microcontrollers. The sensor can measure temperature from 0°C to 50°C and humidity from 20% to 90% with an accuracy of ±1°C and ±1%. So, if you are looking to measure in this range then this sensor might be the right choice for you
Operating Voltage: 3.5V to 5.5V
Operating current: 0.3mA (measuring) 60uA (standby)
Output: Serial data Temperature Range: 0°C to 50°C Humidity Range: 20% to 90%
Resolution: Temperature and Humidity both are 16 bit Accuracy: ±1°C and ±1%
Fig. 6: DHT11 sensor
The Arduino Uno R3 with Cable is a microcontroller board based on the ATmega328 It has 14 digital input/output pins (of which 6 can be used as PWM outputs); 6 analog inputs, a 16 MHz ceramic resonator, a USB connection, a power jack, an ICSP header, and a reset button.
Fig. 7: Arduino UNO R3
ISSN: 2321 9653; IC Value: 45.98; SJ Impact Factor: 7.538
Volume 10 Issue XI Nov 2022 Available at www.ijraset.com
Table 2: Specifications Of Arduino Uno Microcontroller Chip ATmega328
Operating Voltage (VDC) 5
Input Voltage(Recommended) 7 12V
Input Voltage (limit) 6 20V
Analog I/O Pins 6
Digital I/O Pins 14 (of which 6 provide PWM output)
PWM Digital I/O Pins 6 DC Current per I/O Pin (mA) 40 DC Current for 3.3V Pin (mA) 50
Clock Speed 16 MHz
SRAM 2
EEPROM 1 KB (ATmega328)
Flash Memory 32 KB
On Board LEDs On/Off, L (PIN 13), TX, RX Dimensions in mm (LxWxH) 75 x 54 x 12
E. High current SG 90 servo
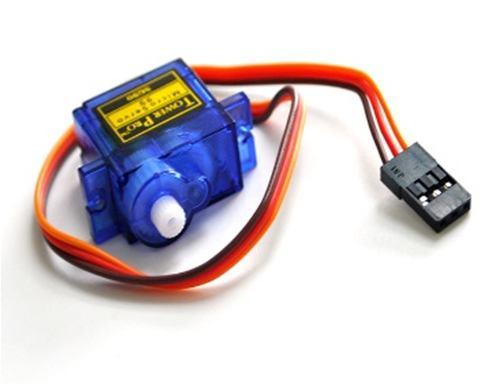
SG90 mini servo is lightweight, high quality and lightning fast. It equips Carbon Fiber Gears which makes the servo motor much lighter than the same metal gear motor. For small load applications using the metal gear, servo motor adds on unnecessary weight, so we suggest using these lightweight plastic gear servo motors.
The SG90 9g Mini Servo is a 180° rotation servo. It is a Digital Servo Motor that receives and processes PWM signal faster and better. It equips sophisticated internal circuitry that provides good torque, holding power, and faster updates in response to external forces.
Weight(gm) 9
Operating Voltage (VDC) 3.0 ~ 7.2
Operating Speed @4.8V 0.10sec/60°
Stall Torque @ 4.8V (Kg Cm) 1.2
Stall Torque @6.6V (Kg Cm) 1.6
Operating Temperature (°C) 30 to 60
Dead Band Width ( μs) 7
Gear Type Glass Fiber Rotational Degree 180º Servo Plug JR
F. Arduino IDE
Used to write the C language code to interpret sensory data.
G. Python
To perform data analytics.
H. NodeRED
Used to display real time data.
I. Google Colab
To perform data analytics.
ISSN: 2321 9653; IC Value: 45.98; SJ Impact Factor: 7.538
Volume 10 Issue XI Nov 2022 Available at www.ijraset.com
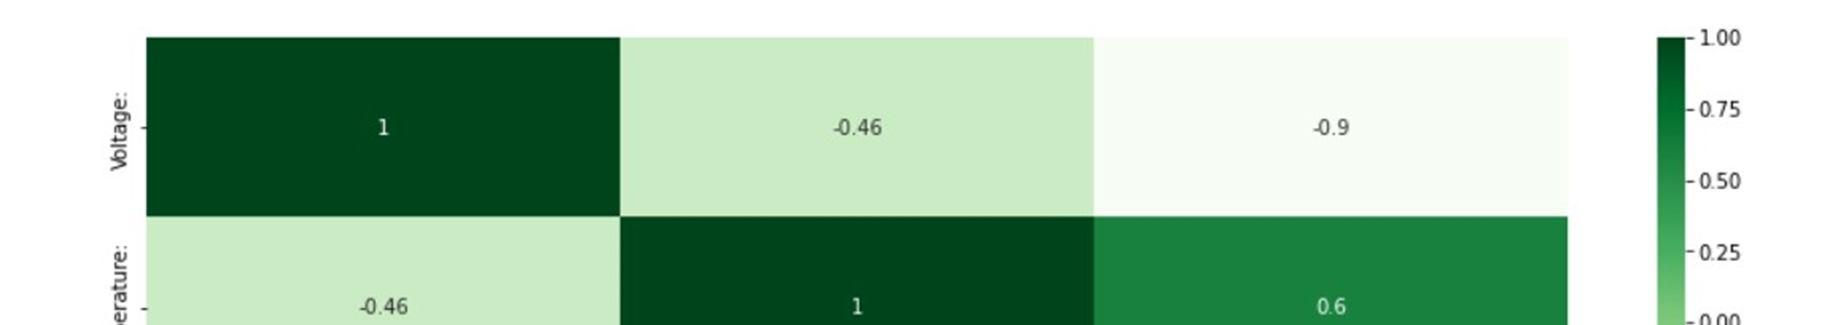
Data analytics performed was useful to recognize new patterns and errors in the data. The above correlation matrix shows the correlation between variables, it gives the correlation between all the possible pairs of values in a matrix format and the histogram plot of temperature, humidity and voltage shows the frequency of numerical data. We can use a correlation matrix to summarize a large dataset and to identify the patterns and make a decision according to it. We can also see which variable is more correlated by which variable and we can visualize our results.
We used NodeRED to visualize the data for ease of access. Also, in addition to this we created a robust system that is fully automated and there is no need to involve humans for the functioning of the prototype.
The obtained results show that there is increased level of performance post unfavorable conditions for the photovoltaic solar panel. This is because the control action was taken ahead of major impact times which led to the increased safety and better performance of the photovoltaic solar panel system.
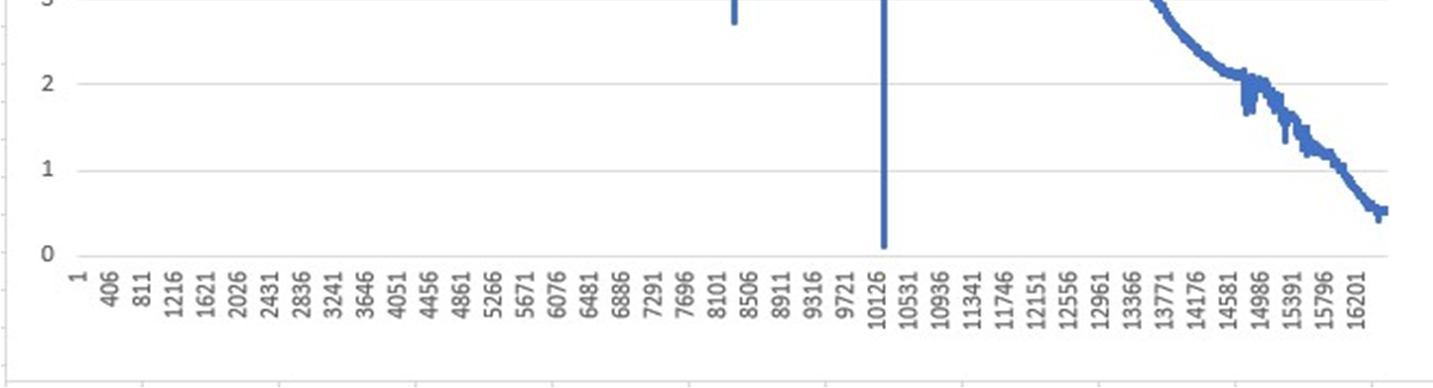
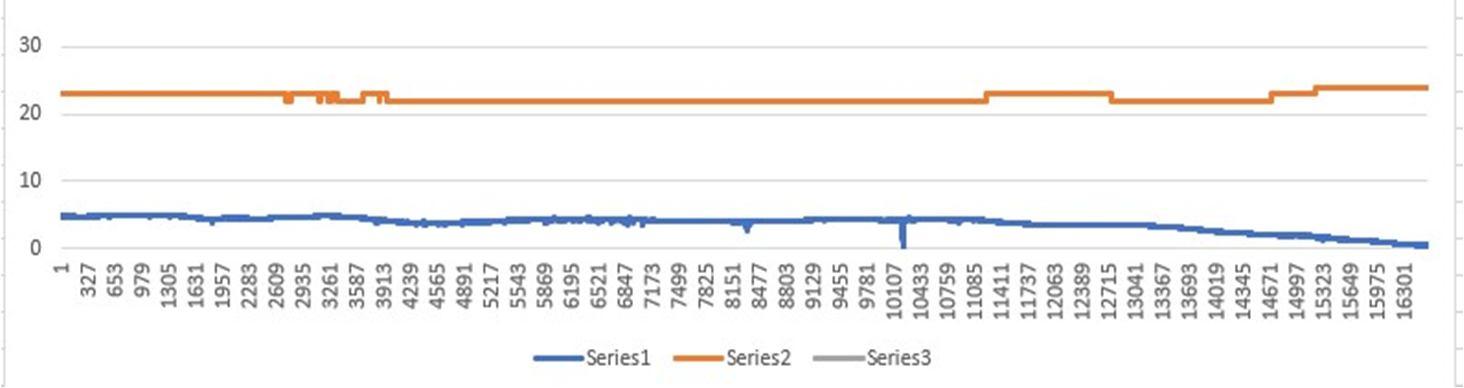
Fig 9: Voltage variation in 1 day
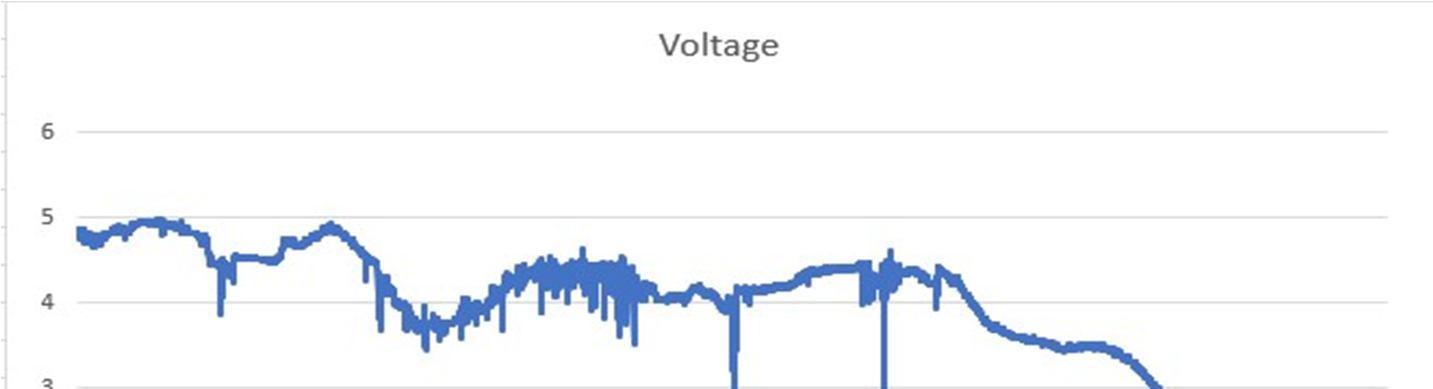
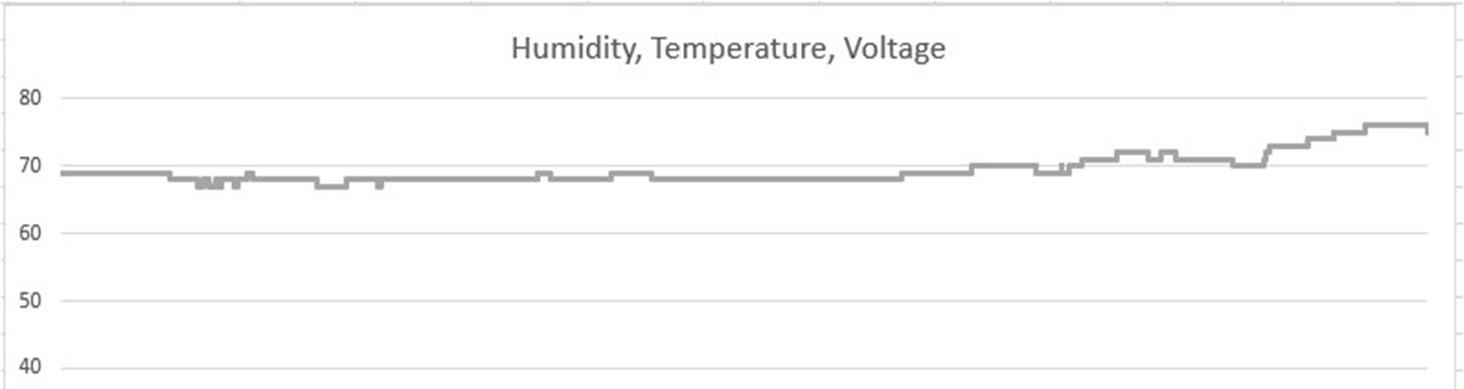
Fig 10: Humidity, Temperature & Voltage variation in 1 day
ISSN: 2321 9653; IC Value: 45.98; SJ Impact Factor: 7.538
Volume 10 Issue XI Nov 2022 Available at www.ijraset.com
Fig 11: Dependency of variables on each other
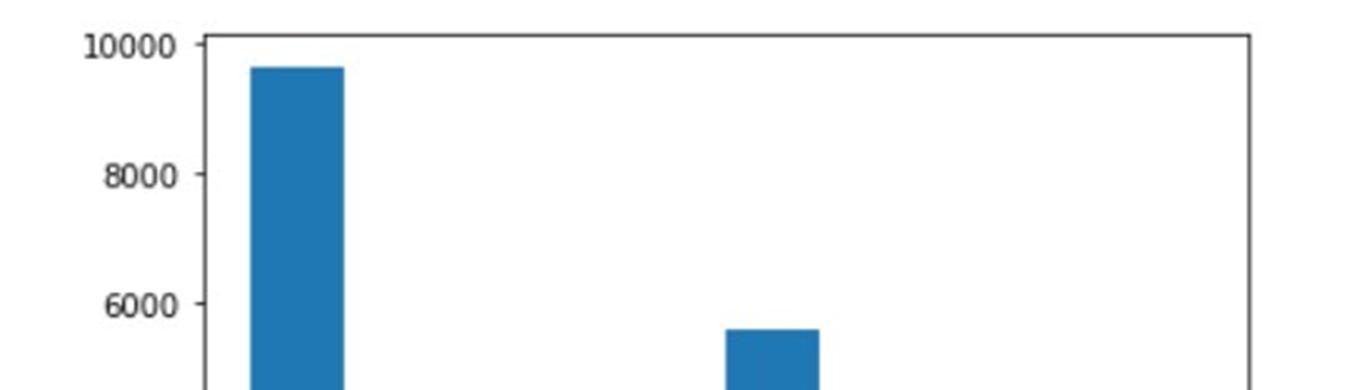
Fig 12: Temperature value histogram
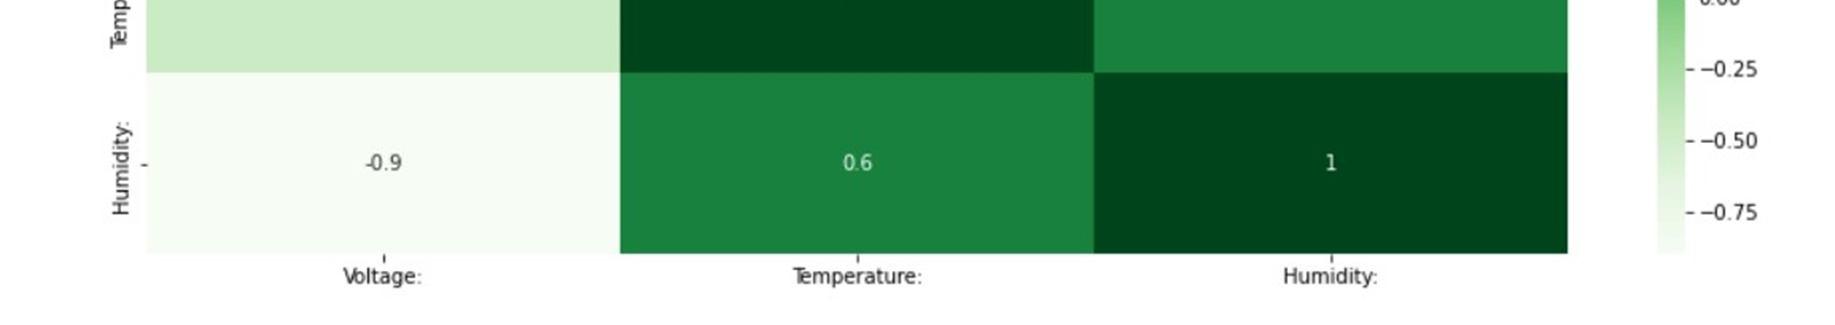
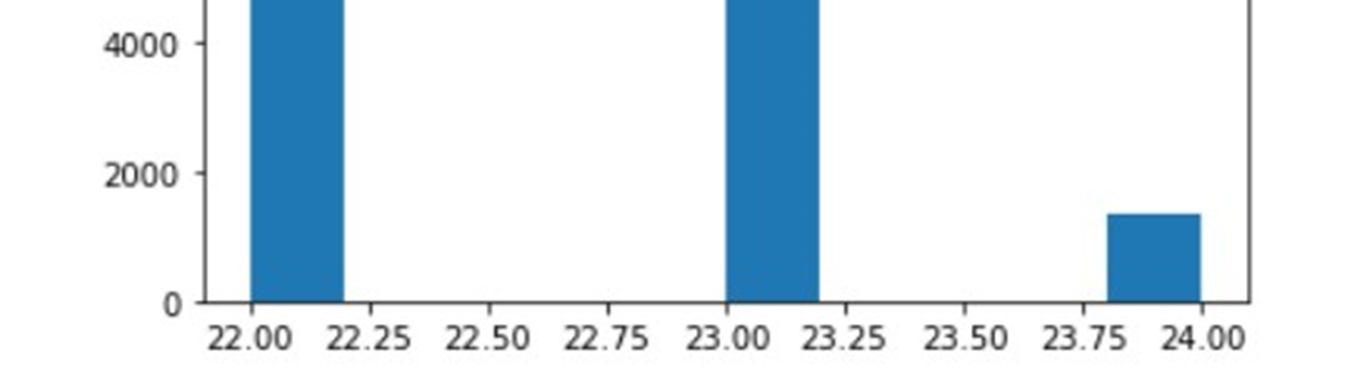
Fig 13: Humidity values histogram

ISSN: 2321 9653; IC Value: 45.98; SJ Impact Factor: 7.538 Volume 10 Issue XI Nov 2022 Available at www.ijraset.com
Fig 14: Voltage values histogram
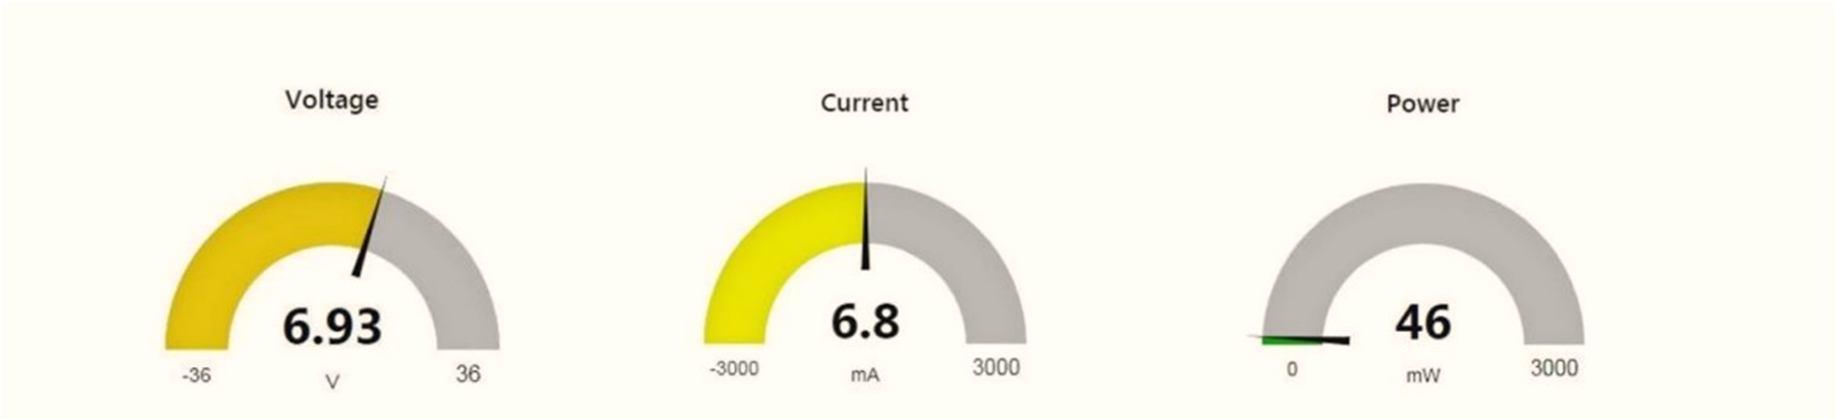
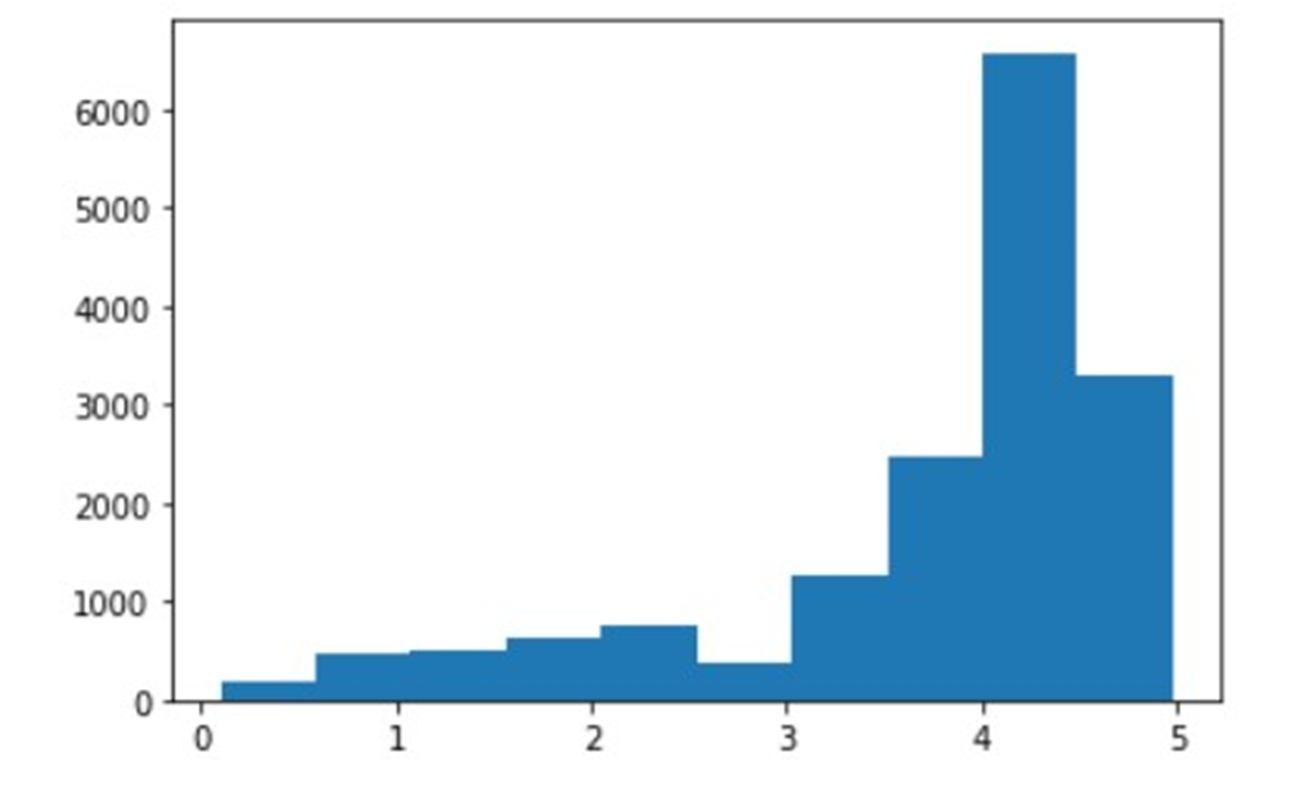
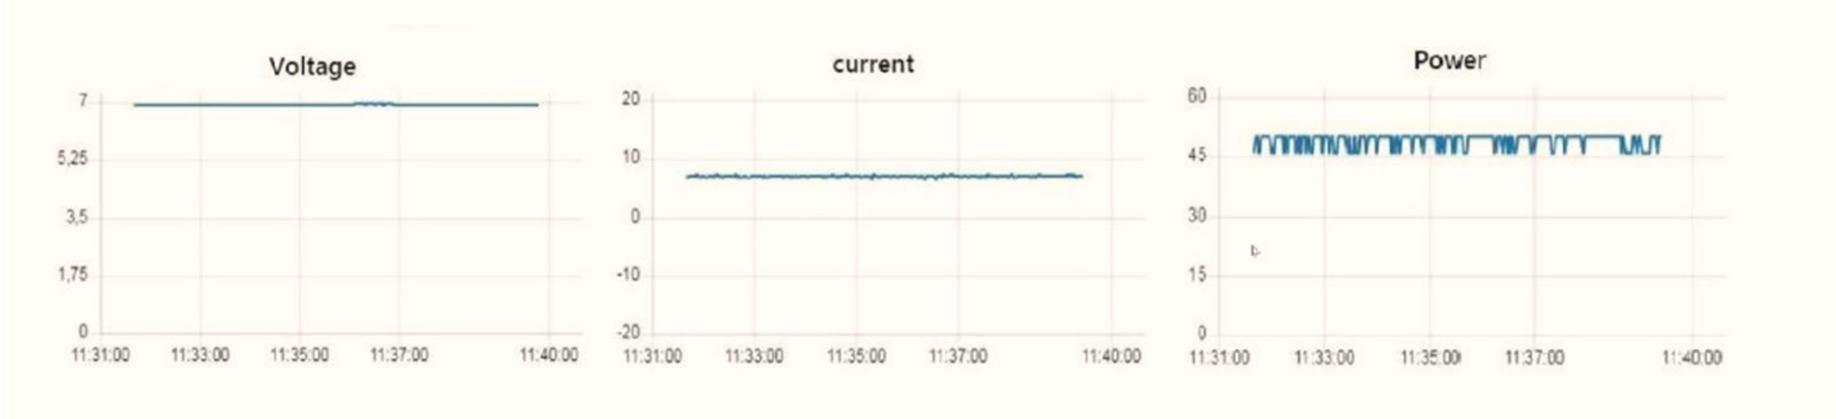
Fig 15: NodeRED dashboard for real time monitoring
[1] R. F. Gusa, W. Sunanda, I. Dinata and T. P. Handayani, "Monitoring System for Solar Panel Using Smartphone Based on Microcontroller," 2018 2nd International Conference on Green Energy and Applications (ICGEA), 2018, pp. 79 82, doi: 10.1109/ICGEA.2018.8356281.
[2] D. Saravanan and T. Lingeshwaran, "Monitoring Of Solar Panel Based On IOT," 2019 IEEE International Conference on System, Computation, Automation and Networking (ICSCAN), 2019, pp. 1 5, doi: 10.1109/ICSCAN.2019.8878814.
[3] J. L. Prasanna, D. Lavanya and T. A. Kumar, "Condition monitoring of a virtual solar system using IoT," 2017 2nd International Conference on Communication and Electronics Systems (ICCES), 2017, pp. 286 290, doi: 10.1109/CESYS.2017.8321282.