

Optimizing and Analyzing the Cost of Collection andTransportation of Solid Waste Using GIS
Mukesh Singh1 , Dr. Anirudh Gupta2
1M.Tech. Student, Environmental Engineering, Institute of Engineering and Technology,Lucknow, Uttar Pradesh, India
2Assistant Professor, Civil Engineering Department, Institute of Engineering and Technology,Lucknow, Uttar Pradesh, India

Abstract: This study aimed to analyze the cost of the waste collection and transportation system of zone 2 ward 95, Kanpur. Population growth, rapid economic development and urbanization have led to an increase in the generation of solid waste. For this purpose, the maps of collection routes and locations of waste storage were drawn using Arc & QGIS software. According to the GIS maps software, the main waste collection cost was supplying human resources and fuel charges. Transfer stations are an integral part of present day municipal solid waste management systems. The main criteria used to decide on the location of a transfer station has traditionally been the minimization of transport costs since it is cheaper to transport great amounts of waste over long distances in large loads than in small ones.Municipal solid waste (MSW) has been produced since the establishment of mankind. Solid wastes are wastes generated due to human and animal activities and are unavoidable by products of human activities. Routing is one of the main components of solid wastemanagement to optimize of collection route and reduce travel distance which could reduce disposal costs. Waste collection and transport can generate up to 70% of the MSW system costs. Separate collection of recyclables or organic waste raises the costs of waste collection. The proper estimation and monitoring of waste collection costs are essential to define the most cost-effective waste collection system. This has become a critical issue for every MSW company aimed at providing their services in the best possible way.
Keywords: MSW, Vehicle Route, ArcGIS, QGIS, Collection & Transportation, etc.
I. INTRODUCTION
The recent increase in the production of different types of waste in various quantities and qualities is due to industrialization. Preserving the health of human beings and the environment and also raising the efficiency in all stages of solidwaste management is a cause of the consideration of new waste management systems in metropolises. In this framework, policies and scientific strategies have been applied to develop programs and effective solutions for the collection, transportation,and disposal of solid waste. The main components of municipal solid waste management include production, storage, transportation, processing, recycling, and disposal which are connected and thus should be systematically linked so that uniformunits can be used. The efficiency of the waste management program should be based on health, economy, and environmental engineering aspects. The collection stage is the most difficult part of solid waste management, especially in megacities. One of the most effective factors in waste management is the cost of waste collection and transportation which constitutes about 50% to70% of the total cost of solid waste management programs. Through the application of plans, advice, and optimized route management of the waste collection system, such costs can be drastically reduced Therefore, optimization of solid waste collection routes in an urban area is important where a significant amount of the time is spent loading and unloading as well as driving. Optimizing collection services is still depending on the knowledge of local conditions such as one way streets and road construction by the collection teams. Efficiency and effectiveness are two indicators of a system’s performance. While efficiency indicators define the relationship between a system’s input resources and output products or services, effectiveness indicators measure a system’s ability to meet its objectives. In other words, efficiency indicators show how efficiently a company utilizes the contracted budget for the collection and transportation of municipal waste.
II. MATERIAL AND METHODS

A. Study Area
Kanpur is a major industrial town of Uttar Pradesh, the northern state of India. This town is situated on the south bank of river Ganga, located 80 km west of Lucknow, the state capital. It is also known as the industrial capital of the state. According to the 2011 census, Kanpur Nagar district has a population of 4,581,268, roughly equal to the nation of Costa Rica orthe US state of Louisiana. This gives it a ranking of 32nd in India (out of a total of 640). The district has a population density of1,449 inhabitants per square kilometre (3,750/sq. m). Its population growth rate over the decade 2001 2011 was 9.72%.
The Arc & Q Map module was routes for the basic functions of GIS problem solving, namely Dijkstra algorithm to find the shortest route with the network analyst tool of this module carrying out the actual analyses. System analyst tool can carry out a variety of different analyses including the production of network data sets in single or multiple modes, identification of optimal route using one network data set, developing a model for route analysis, transportation of a series of orders using a vehicle fleet,network analysis using traffic data and specification of most suitable sites. ArcGIS 10.4 & QGIS software was used for the GIS method employed in this study. The database of the network topology software for the neighbourhood of the optimization study was processed, and the road restrictions, like direction, speed limits were identified.
B. Vehicle Routing Problem

Vehicle routing problem is an optimization problem that aims to find best route between the location and transfer station to dumping site. There may be only one vehicle in the problem, or there may be more than one vehicle. Although the purpose of determining the best route is generally to find the shortest distance for the routes, a different problem can also be defined for different purposes such as minimizing the route of vehicle. Usually, constraints of the problem are related to the vehicles, the customers or the process. Due to these factors or constraints, several types of VRP have been introduced.
C. GIS

Geographic information systems are utilized in multiple technologies, processes, techniques and methods. They are attached to various operations and numerous applications that relate to: engineering, planning, management, transport. Showing spatial datafor a specific plan of purposes from this current reality. Creating, visualizing, and managing networks is an important part of GIS. Many types of physical infrastructure such as roads, railways, and utilities can be modelled as networks with lines and nodes with properties attached to them. This tutorial will teach how road networks are commonly modelled and apply some styling techniques to visualize the routing properties. We willalso use QGIS built in tools for network analysis that to find the shortest path between 2 points along with the network.
D. QGIS

QGIS functions as geographic information system (GIS) software, allowing users to analyse and edit spatial information, in addition to composing and exporting graphical maps. QGIS supports raster, vector and mesh layers. Vector data is stored as either point, line, or polygon features. Multiple formats of raster images are supported and the software can geo reference images. QGIS can display multiple layers containing different sources or depictions of sources. In order to prepare printed map with QGIS, Print Layout is used. It can be used for adding multiple map views, labels, legends, etc.

ISSN: 2321 9653; IC Value: 45.98; SJ Impact Factor: 7.538 Volume 10 Issue IX Sep 2022 Available at www.ijraset.com

1) Identification Of The Layers: In the given drawing, there were many layers such as pipeline, contour, road and housing layers. With referencing with the Google Earth Image and Arc Map, user can identify the road layers needed for data analysis. Finally, non spatial data such as road name and length of each road were added.
2) Creating Network Database: A Network Dataset was created from the feature sources that participated in the network. It incorporates an advanced connectivity model that can represent complex scenarios, such as multimodal transportation networks. It also possesses a rich network attribute model that helps model impedances, restrictions, and hierarchy for the network.
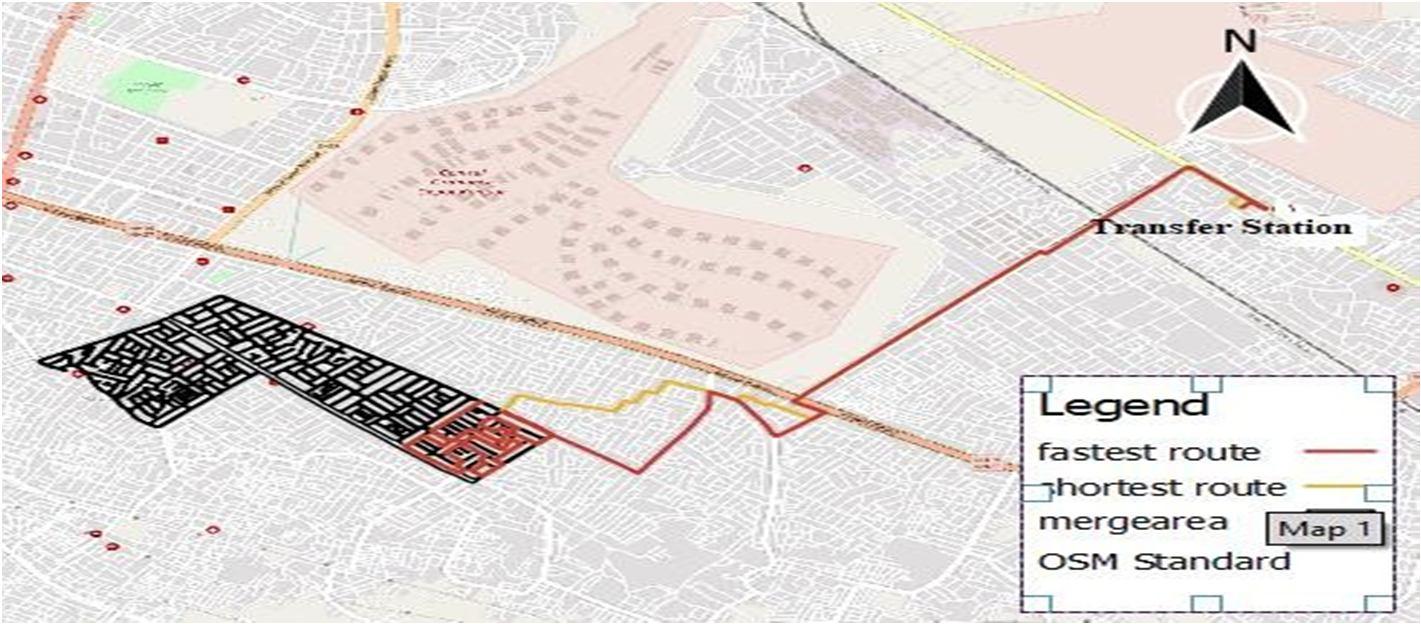
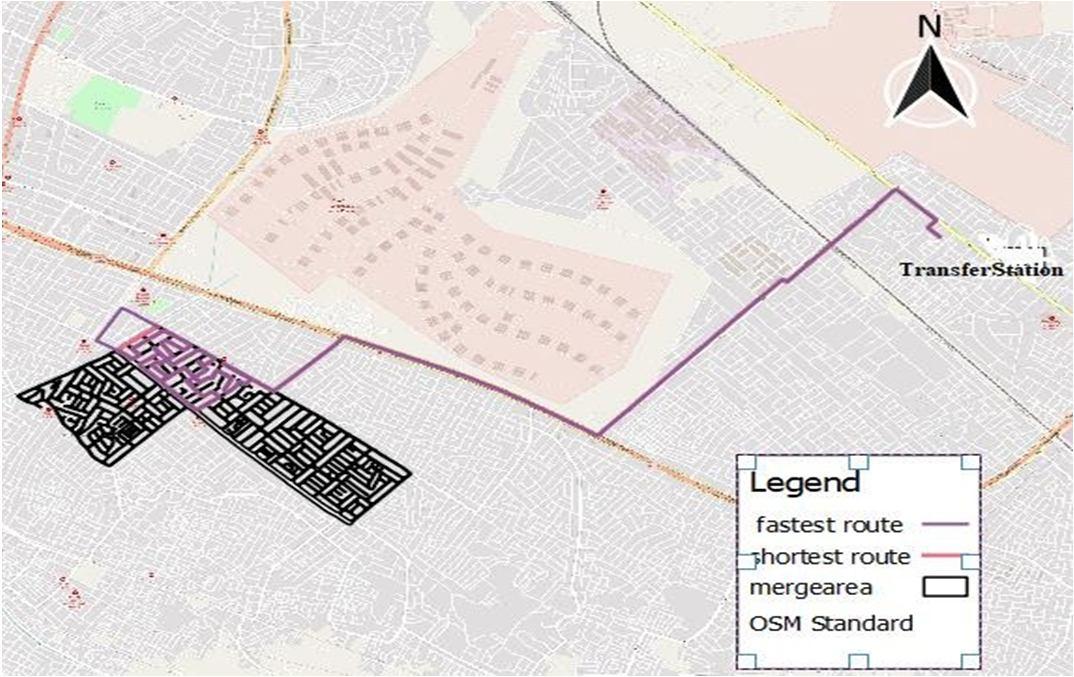
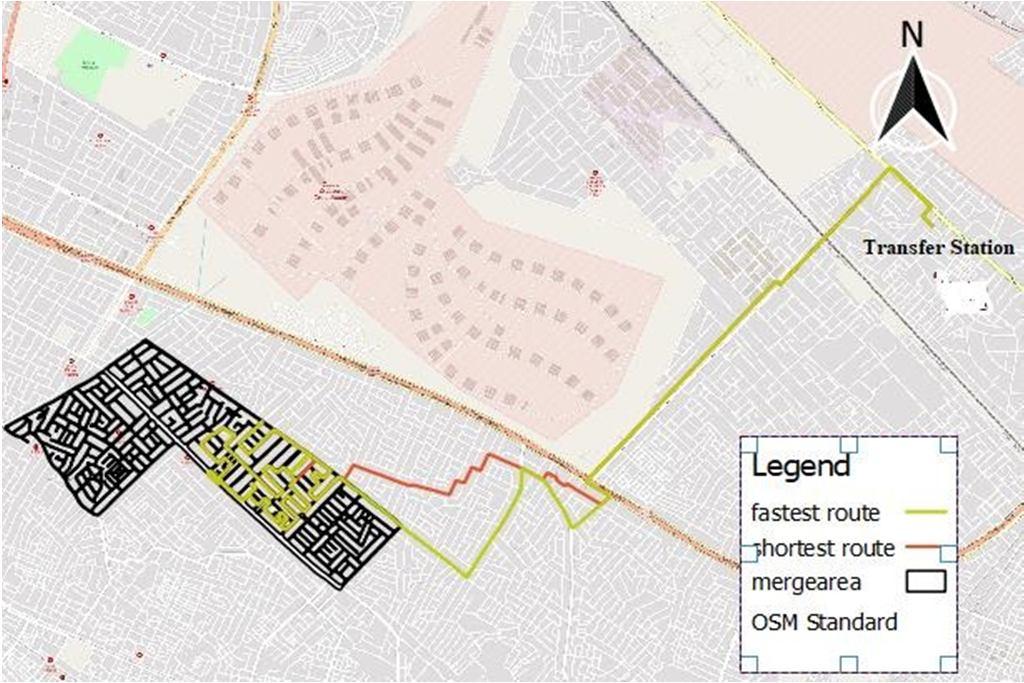
3) Creating Network Database: Arc GIS NA is an extension that provides network based spatial analysis including routing, travel directions, closest facility and service area analysis. The NA is able to find efficient travel routes for the trucks during solid waste collection. In order to solve the route optimization, distance criteria and collection time by the truck (regardless to time spent in traffic) were considered and generated. The final output was an optimal solution in terms of distance criteria. After setting the stop points, the optimized routes for solid waste collection were produced. The stop points were numbered automatically by Network Analystin the order that they were visited.
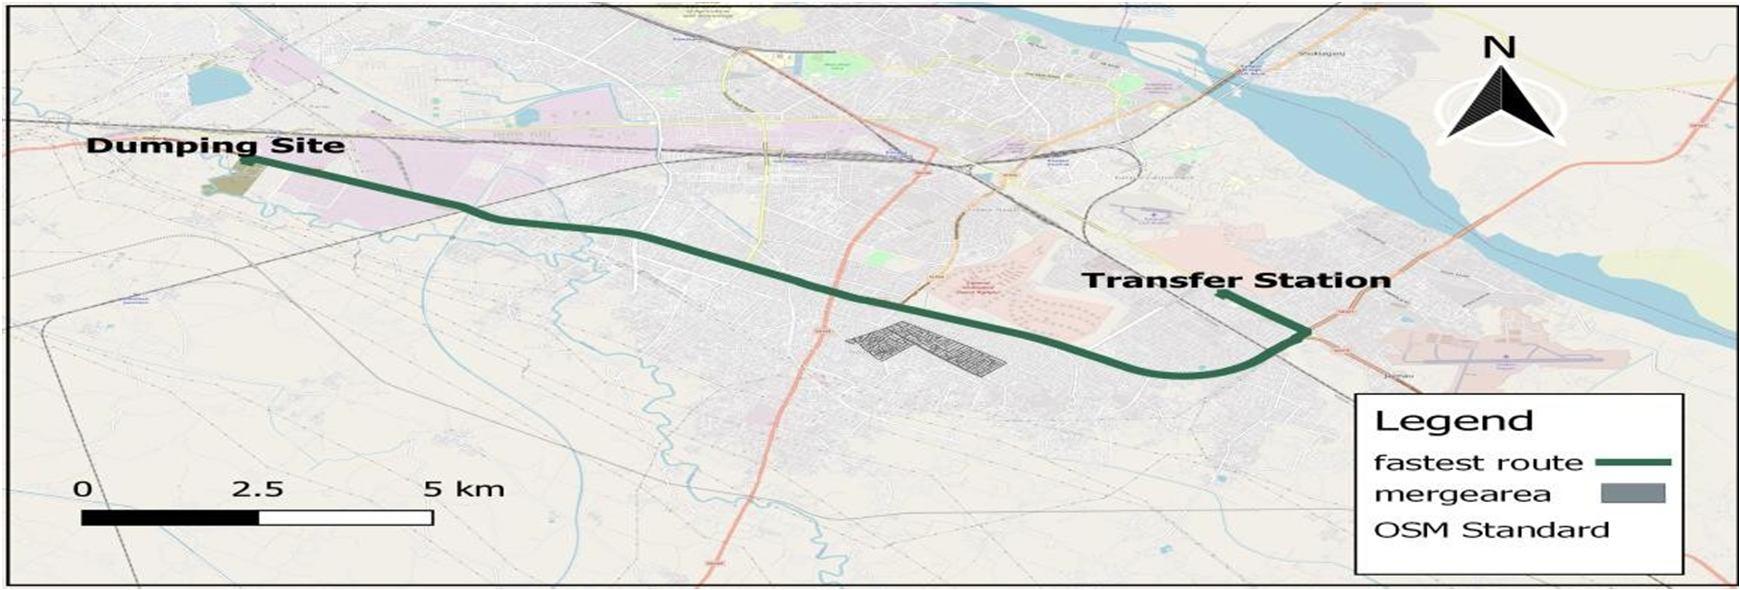
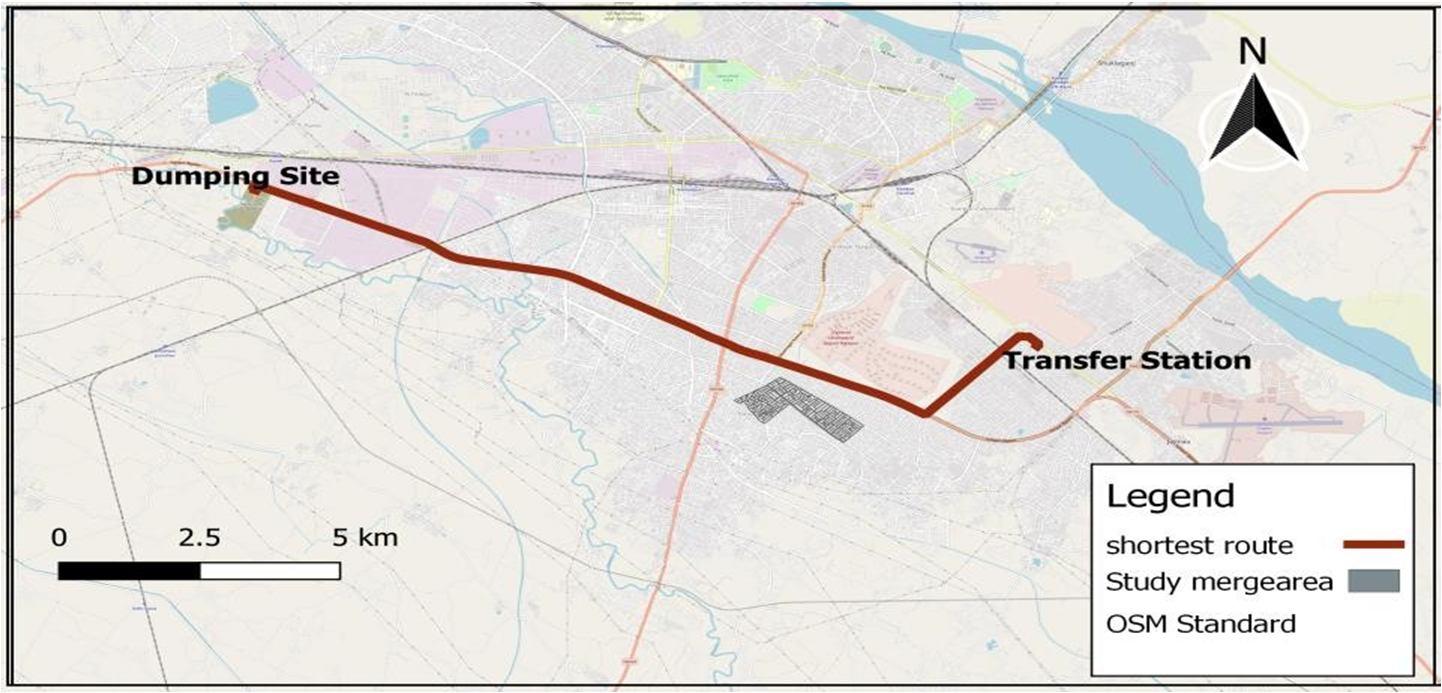
4) Service Design (definition of the routes): The best possible routes for solid waste collection were identified based on the information obtained with the help of the GIS regarding the possible routes, and having taken into account the restrictions to the road conditions and topography. The routes were chosen in a way that the resources used for the collection, the length of the route and the time taken to complete the collection are minimized.
E. Solid Waste Management
Waste management or waste disposal includes the processes and actions required to manage waste from its inception to its final disposal. This includes the collection, transport, treatment and disposal of waste, together with monitoring and regulation of the waste management process and waste related laws, technologies and economic mechanisms. Waste can be solid, liquid, or gas and each type have different methods of disposal and management. Waste management deals with all types of waste, including industrial, biological, household, municipal, organic, biomedical, and radioactive wastes. In some cases, waste can pose a threat to human health. Health issues are associated with the entire process of waste management. Health issues can also arise indirectly or directly. Directly, through the handling of solid waste, and indirectly through the consumption of water, soil and food. Waste is produced by human activity, for example, the extraction and processing of raw materials.
F. Transfer and Transport

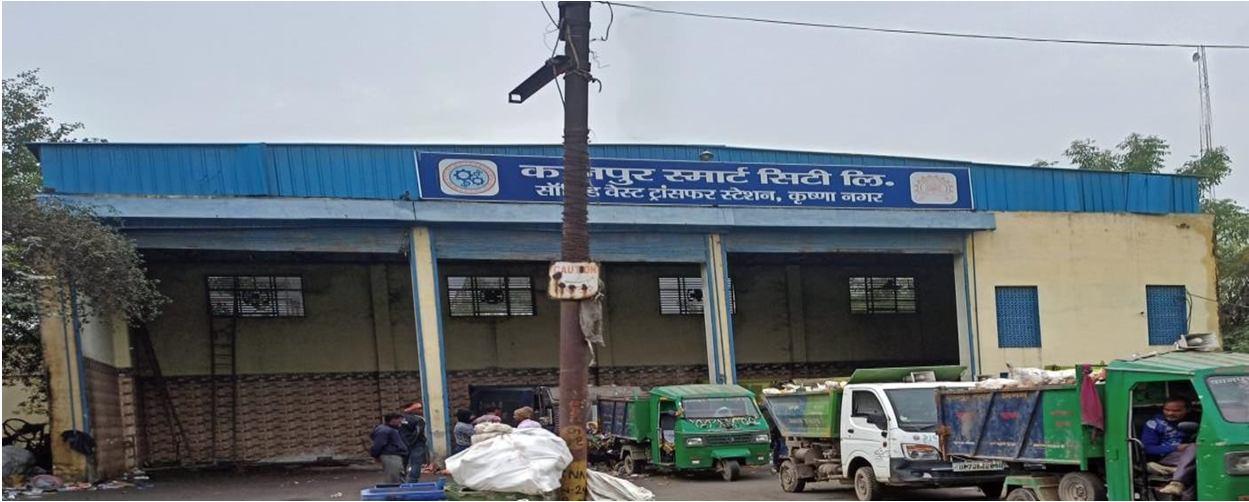
The transfer of waste from the smaller collection vehicles to the larger transport equipment. Solid waste transfer stations are facilities where solid waste, mainly municipal solid waste (MSW), is unloaded from collection vehicles or containers for reloading into larger, long distance vehicles for transport to landfills or other permitted solid waste facilities for final disposal. Facilities that move the solid waste from one mode of transportation to another, such as road, can also be considered transfer stations SW that quickly decomposes, such as food waste, must be removed from a transfer station by the next day. Recyclables may be stored in containers for a longer period of time. Combining several truckloads of waste into a single shipment reduces trips to and from the disposal site, saving communities moneyon labour and transportation.
The private companies are contracted, for the collection of household solid waste and transportation to landfill disposal sites by the Municipality, number of labour’s and waste trucks assigned to the task of collection and transportation, the contract budget,the mean location (studyarea) to disposal site.




S1

S3
4428 53136
135.9 4077 48924

3942 47304
3807 45684
3294 39528
And 5
were specified to
all

carried out specific direction. Waste collection
also calculating cost effectiveness of
IV. CONCLUSIONS
waste
this study, an optimization was developed using the QGIS tool in order to improve the efficiency of the collection and transportation of waste of ward 95, zone 2 in Kanpur. The location area of the transfer station to the dumping site were modelled separately to find respective optimized transportation routes for solid waste management. This study finds the reductions in haul distance as 2.19 for location. The present study attempted to analyze the collection and transportation costs of municipal solid waste from location of study area to transfer station. Here GIS based optimal model is developed and used to trace the least cost. This minimum cost is with respect to distance efficient collection path in transferring the solid waste to the open dumping ground. With different transfer station and associated minimum paths could be adopted as it saves around 25 thousands (approx.) on Solid waste management.
V. ACKNOWLEDGMENT
The author wishes to express his paramount gratitude to Asst. Prof. Dr. Anirudh Gupta, CED, IET Lucknow, their scholarly guidance and constructive feedback have been a source of inspiration and motivation to complete this paper and the Nagar Nigam Kanpur for providing the essential data for conducting this paper.

REFERENCES
[1] Bundela P S, Gautam S P, Pandey A K, Awasthi MK and Sarsaiya S (2010) Municipal solid waste management in Indiancities: A review. International Journal of Environmental Sciences 1(4):591 606.
[2] Rajkumar N, Subramani T and Elango L (2010) Groundwater contamination due to municipal solid waste disposal: A GIS based study in erode city. International Journal of Environmental Sciences 1: 39 55.
[3] Rathi (2007) Optimization model for municipal solid waste management in Mumbai. India environment and developmenteconomics Cambridge press, United Kingdom12:105 121
[4] Amponsah SK and Salhi S (2004) The investigation of a class of capacitated arc routing problems: The collection ofgarbage in developing countries. Waste Management 24: 711 721.
[5] Tavares G, Zsigraiova Z, Semiao V, et al. (2008) A case study of fuel saving through optimization of MSW transportation routes. Management of Environmental Quality 19: 444 454.
[6] D. Khan and S. R. Samadder, “Municipal solid waste management using Geographical Information System aided methods:a mini review,” Waste Management & Research, vol. 32, no. 11, pp. 1049 1062, 2014.
[7] Karadimas, N.V., Doukas, N., Kolokathi, M., Defteraiou, G. Routing optimisation heuristics algorithms for urban solidwaste transportation management, WSEAS Transactions on Computers, Vol. 7, No.12, 2008, pp. 2022 2031.
[8] Ellis S. and Dinsmore Q. (2005) Turning a corner with mapping software, Public Works, Vol.136, 2005, pp. 56
[9] Despotakis V.K. and Economopoulos A.P. A GIS model for landfill sitting. Global NEST Journal, Vol. 9, No.1, 2007, pp. 29 34
[10] Zamoranoa M, Molero E, Grindlay A, Rodriguez M L, Hurtado A, Calvo F J A planning scenario for the application of geographical information systems in municipal waste collection: A case of Churriana de la Vega (Granada, Spain). ResourConserv Recycl2009;54:2 123.
[11] Apaydin, O., Gonullu, M.T.:(2007) Route optimization for solid waste collection: Trabzon (Turkey) case study. Global Nest J. 9, 6 11.

