
ISSN: 2321 9653; IC Value: 45.98; SJ Impact Factor: 7.538

Volume 10 Issue XI Nov 2022 Available at www.ijraset.com


ISSN: 2321 9653; IC Value: 45.98; SJ Impact Factor: 7.538

Volume 10 Issue XI Nov 2022 Available at www.ijraset.com
1,
 2 Department of Mechanical Engineering, Government College of Engineering, Aurangabad
Abstract: Process parameters directly affect the performance and quality of the composite of polypropylene (PP) and kenaf in injection molding. Optimize the parameter of injection molding with the help of response surface methodology (RSM). The important parameters are injection temperature, pressure, and holding time to optimize using the 3 factor, 3 level Box Behnken method. MINITAB 20 is used for statistical analysis of tensile properties of polypropylene and kenaf composite. In this paper the confirmation test is conducted to verify the predicted value of tensile strength and the results show the optimum value for injection temperature is 191.970°C, a pressure value is 40 bar, and the holding time is 13.8384 sec. the optimum parameters are used to manufacture the composite for better tensile strength and actual value of the composite is in the range of the predicted value.
Keywords: Polypropylene (PP), Kenaf, Injection molding, Response surface methodology, Minitab 20
Polymer composites have become very highly demanded in the automotive industry for the development of new material components which reduce cost and are environmentally friendly. Plastic has a low specific gravity, excellent mechanical strength, strong acoustic, thermal, and electrical insulation, and is simple to produce. As a result, it is commonly employed in Electrical and automotive components and transportation equipment. The natural fiber composite has high strength and high durability. Kenaf fiber is a natural fiber that is utilized in the production of reinforced polymer composites. The polymer is divided into two types: thermoplastics and thermosets. Thermoplastics include polypropylene, polyethylene, and polyvinyl chloride, while thermosetting include phenolic, epoxy, and polyester resin. Petroleum based thermoplastics like polypropylene and polyethylene are used to strengthen fibers such as kenaf, sisal, banana, jute, flax, hemp, and others. Kenaf fiber is used for composite reinforcing. Kenaf fiber's availability and superior qualities make it an excellent choice for use as reinforcement in composite products. Injection molding is a multivariable, nonlinear, and cyclical unsteady process that is the most extensively used molding method in plastics due to its benefits of excellent production efficiency and great processing adaptability. The selection of injection molding process parameters, which may be carried out historically by trial and error based on specialists' expertise and practical knowledge, is the essential aspect that determines the quality of molding products. By trial and error, it is difficult and costly to optimize the injection molding process parameters and achieves high quality products [1]. Nowadays, industries may produce kenaf reinforced composites utilizing a variety of processing processes like compression molding hot pressing, and pultrusion These traditional processing methods, however, are not appropriate for high volume manufacturing, particularly for automobile components. As a result, plastic injection molding ears to be a perfect substitute for natural fibre composites, providing high intolerance, complicated geometry, and a fast cycle time at a reduced cost, making it desirable for automobile components.
Yallew et al. (2022) studied the natural fiber reinforced composites fabricated by the compression molding process with different parameters heating temperature, compressive pressure, and curing time. and in this paper, they used sisal, hemp, and jute reinforced composite material. The tensile strength of sisal fiber is more effective than that of hemp, jute reinforced material. The manufactured composite material can be employed in furniture, cars, and packaging sectors as non load bearing, lightweight materials. [6]. Tianyun Zhang et al. (2019) studied the optimization of polypropylene material using seven different parameters melt temperature, injection pressure, injection rate, packing time, packing pressure, cooling time, and mold temperature, and affect all parameters of injection molding in the tensile strength of polypropylene[1].
ISSN: 2321 9653; IC Value: 45.98; SJ Impact Factor: 7.538 Volume 10 Issue XI Nov 2022 Available at www.ijraset.com

M. Bernard et al. studied and optimized the effect of temperature and speed parameters and mechanical properties of kenaf fibre composite. in this paper, they used compression molding for producing the composite material which has great tensile strength. Processing of composite material optimized the temperature and barrel speed. Scanning electron micrographic (SEM) shows the strong bonding in kenaf and polymer composite, dynamic mechanical properties show polypropylene has a maximum peak as compared to kenaf fiber composite and polypropylene (PP)/kenaf has good properties than polypropylene [8]. Kun Li et al. (2018) studied and optimized the fiber reinforced composites using injection molding with the RSM, Taguchi method, and NSGA II techniques.
The study used polypropylene and kenaf fiber material. Polypropylene granules and kenaf fiber with a ratio of 80:20 percent. From previous literature, input parameters were selected as injection temperature, pressure, and holding time, and output parameters as tensile strength

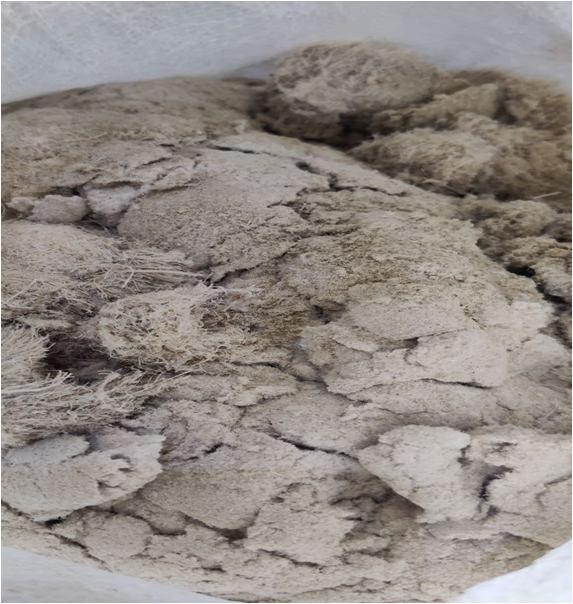
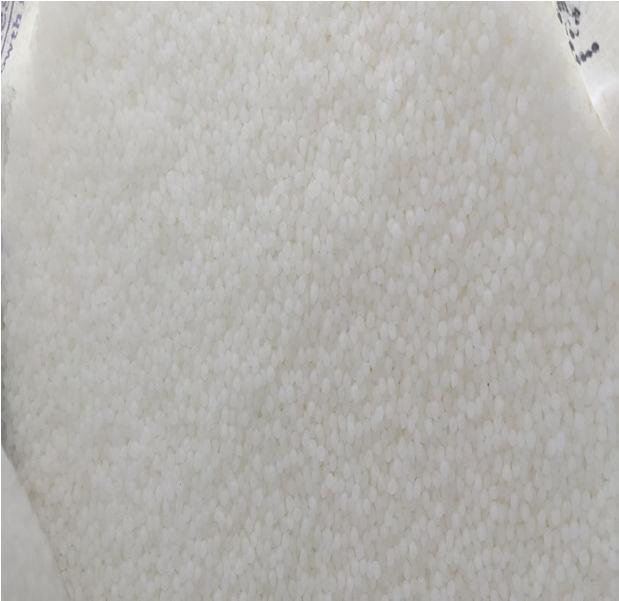
Fig.1.Polypropylene (PP) Fig.2.Kenaf Fibre Powder Fig.3.PP and Kenaf composite Granules
Extrusion was used to combine polypropylene and kenaf fibre composite granules to produce the composite, and injection molding was used to manufacture the tensile specimen. We first grind the long kenaf fibre into kenaf powder, then manually combine the powdered kenaf and polypropylene granules. Next, we extrude the long composite filament and cut it into granules. Finally, we use this composite to optimize the temperature, pressure and holding time of the injection molding machine using surface response methodology.
For tensile strength, the standard tensile specimen ASTM D368 was used. Figure following shows the dimensions of ASTM D368 and produced specimen.
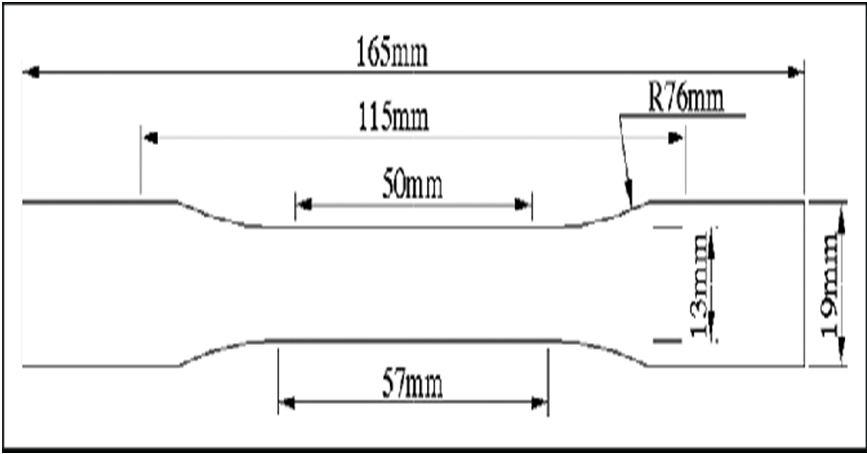
Fig.4. Standard specimen ASTM D368
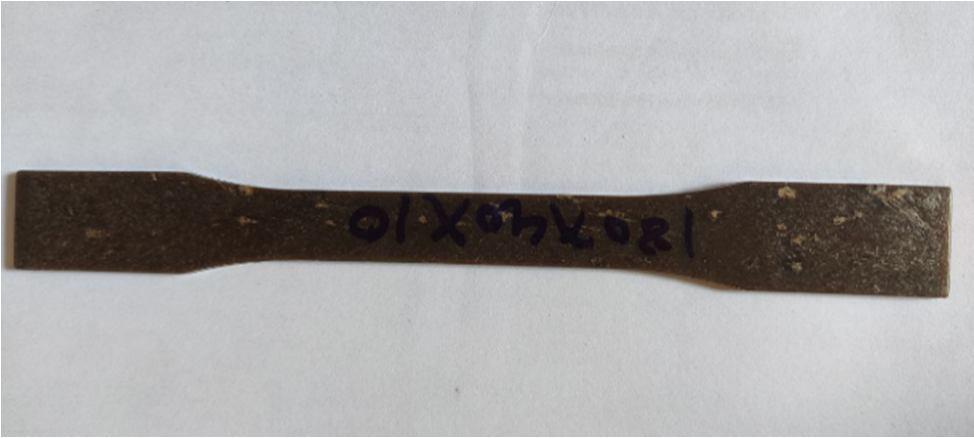

ISSN: 2321 9653; IC Value: 45.98; SJ Impact Factor: 7.538 Volume 10 Issue XI Nov 2022 Available at www.ijraset.com


Response surface method (RSM) is the ability to determine the subset of variables that optimized the single response or set of multiple responses For experimental investigation used a Box Behnken Design in response surface methodology (RSM). A total of 15 experiment runs with three parameters including three replicates center points were carried out. The parameter is shown in the below table. This parameter is based on the previous literature study. Minitab software version 20 was used tool for data analysis. Three factors and three level is given below:
Table 1: Parameters for experimental design
Parameters Level 1 Level 2 Level 3 Temperature (°C) 185 190 195 Pressure (bar) 40 50 60 Holding Time (sec) 10 20 30
After performing the experiment the table shows the results from the experimental runs. And study the influence of processing parameters on the tensile properties of polypropylene and kenaf composites. Analysis of variance is used for the statistical significance of the created model each response was selected as the best fit for the experimental data and experimental data are given below;
Table 2: Experimental Runs and Response results Sr.no Temperature (°C) Pressure (bar) Holding Time (Sec) Tensile Strength (MPa) 1. 185 40 20 178.2 2. 195 40 20 199.9 3. 185 60 20 188.4 4. 195 60 20 85.8 5. 185 50 10 184.8 6. 195 50 10 171.0 7. 185 50 30 179.7 8. 195 50 30 115.0 9. 190 40 10 214.4 10. 190 60 10 159.1 11. 190 40 30 189.4 12. 190 60 30 117.2 13. 190 50 20 205.5 14. 190 50 20 199.8 15 190 50 20 206.6
ISSN: 2321 9653; IC Value: 45.98; SJ Impact Factor: 7.538 Volume 10 Issue XI Nov 2022 Available at www.ijraset.com

Analysis of variance (ANOVA) is estimated the regression coefficient of tensile strength and also shows the contribution of each input parameter. A probability value (P value) of the input parameter temperature, pressure, and holding time of the processing condition is less than 0.005 showing that the terms of the model significantly effect the response in the design. In this case, all terms are significant and the regression line perfectly fit into the given data. the determination coefficient R Seq of 0.9915 and adjusted R Seq of 0.9803 shows that the relation between the variables under consideration. ANOVA result for tensile is given below in table no 3

SOURCE DF Contribution (%) Seq SS Adj SS Adj MS F Value P Value
Model 8 99.15 20172.5 20172.5 2521.56 87.89 0.000 Linear 3 58.62 11926.9 11926.9 3975.62 138.57 0.000 Temperature 1 15.62 3177.6 3177.6 3177.57 110.76 0.000 Pressure 1 32.92 6701.9 6701.9 6701.86 233.6 0.000 Hold Time 1 10.06 2047.4 2047.4 2047.43 71.37 0.000 Square 3 18.38 3740 3740 1246.67 43.45 0.000
Temperature*Temperature 1 8.64 1757.7 2149.3 2149.3 74.92 0.000 Pressure*Pressure 1 4.36 886.4 1038.9 1038.86 36.21 0.001 Hold Time*Hold Time 1 5.39 1095.9 1095.9 1095.89 38.2 0.001 2 Way Interaction 2 22.15 4505.6 4505.6 2252.81 78.52 0.000
Temperature*Pressure 1 18.97 3858.6 3858.6 3858.56 134.49 0.000 Temperature*Hold Time 1 3.18 647.1 647.1 647.06 22.55 0.003 Error 6 0.85 172.1 172.1 28.69 Lack of Fit 4 0.72 145.5 145.5 36.37 2.73 0.286 Pure Error 2 0.13 26.7 26.7 13.33 Total 14 100.00 20344.6
Main effect for tensile strength shows the maximum strength for temperature in a range between 180 190 °C and pressure is 40 Bar and holding time is 10 20 sec. for these all points we get maximum tensile strength. Figure 6 shows the Residual plot for tensile strength, the residual plot for composite generates a straight line nearly and indicates the error is distributed normally.


ISSN: 2321 9653; IC Value: 45.98; SJ Impact Factor: 7.538 Volume 10 Issue XI Nov 2022 Available at www.ijraset.com


The regression equation for tensile strength is given below

Tensile strength = 41057 + 398.9 Temperature + 131.9 Pressure + 53.6 Hold Time
0.965 Temperature*Temperature 0.1677 Pressure*Pressure 0.1723 Hold Time*Hold Time 0.6212 Temperature*Pressure 0.2544 Temperature*Hold Time
The equation from the response surface might be used to calculate the maximum and ideal tensile strength values predicted from the experiment. In Figure 8, 3D surface plots show the correlations between tensile strength and the interaction of the relevant parameters.
The surface plot shows that at temperature 190 °C the tensile strength is increasing with increases the temperature from 185°C 190°C.and then slightly decreases. Pressure at 60 bar we get the minimum tensile strength. And the interaction between temperature and holding time with constant pressure. tensile strength decreases with increasing holding time, the holding time is 30 sec we get the minimum value, the temperature at 185 °C the tensile strength is high then slowly it decreases. The interaction between pressure and holding time, the minimum temperature, and the minimum holding time get a high tensile strength. For these interactions, the pressure is 40 bar, and theholding time is 10 sec showing good tensile strength. The contour plot a is shown below;

ISSN: 2321 9653; IC Value: 45.98; SJ Impact Factor: 7.538 Volume 10 Issue XI Nov 2022 Available at www.ijraset.com


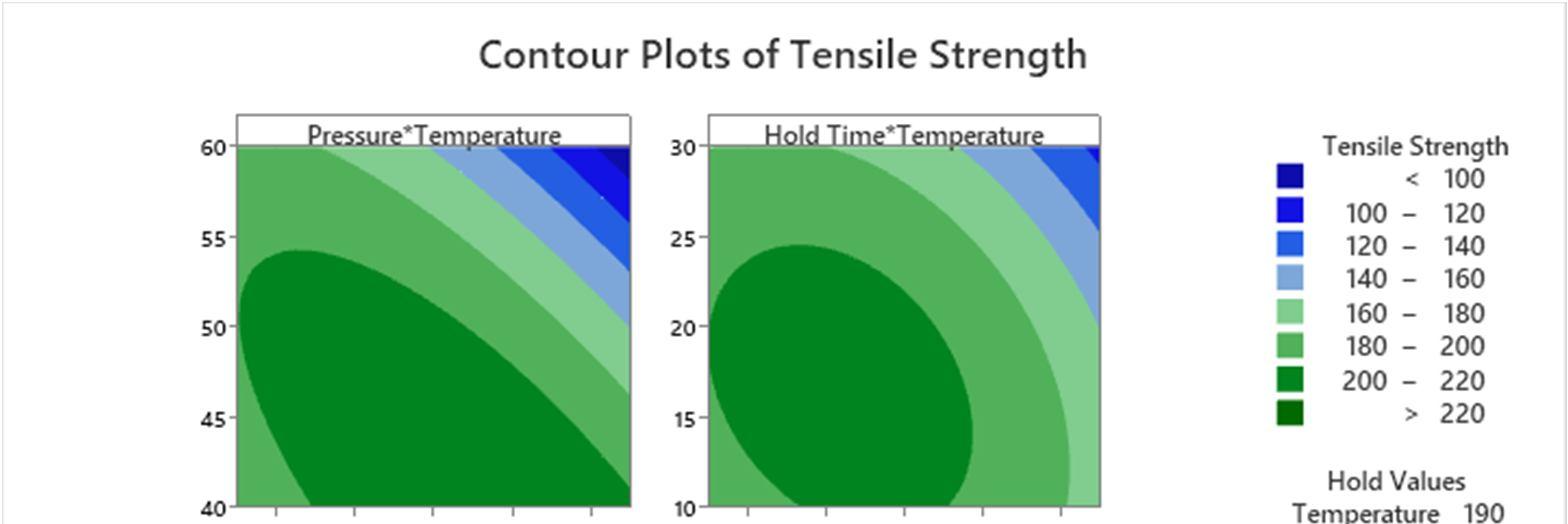
The maximum predicted value for tensile strength and experimental (actual) optimum values for response are gained from the model of the equation. The predicated numerical optimum value from design and expert of Response surface methodology (RSM). The optimal parameter value for temperature is 191.970°C, the pressure value is 40 bar, and the holding time is 13.8384 sec. the confirmation test is conducted to verify the result is close to the predicted value. The confirmation table for tensile strength is shown below and the percentage of error is calculated from the predicted and actual values. The average error for tensile strength is 3.05%.

Tale 4 : confirmation test for tensile strength Temperature (°C) Pressure (Bar) Holding Time (Sec) Tensile strength (MPa)

Predicated Actual 191.970 40 13.8384 223.201 230
Fig9.Optimization plot for tensile strength

ISSN: 2321 9653; IC Value: 45.98; SJ Impact Factor: 7.538 Volume 10 Issue XI Nov 2022 Available at www.ijraset.com

The effect of injection molding on the tensile strength of the polypropylene and kenaf composite was investigated from the Response surface methodology (RSM). Injection molding parameters such as injection temperature, pressure, and holding time and as well as temperature hold time, temperature pressure, and pressure hold time interaction have an effect on tensile strength. By using a 3D response surface plot the optimum value for the process parameter was found. The optimum parameter’s value was achieved at a temperature is 191.970°C, a pressure value is 40 bar, and a holding time is 13.8384 sec. for these values the confirmation test is conducted and the error is 3.05% which is less than the 10%. The tensile strength achieved for the optimum parameter is 230 MPa. In this study, the parameter for injection molding is important for the manufacturing of polypropylene and kenaf composite and its impact on their tensile properties.
I would like to thank Shree Polymers Akola (Maharashtra State, India) for providing the testing facilities, as well as Central Institute of Plastics Engineering & Technology, Aurangabad for providing the manufacturing facility for experiments.
[1] Tianyun Zhang, Kui Chen, Guangqiao Liu and Xiaoping Zheng “Injection Molding Process Optimization of Polypropylene using Orthogonal Experiment Method Based on Tensile Strength” IOP Conf : Materials Science and Engineering 612 (2019) 032102
[2] Reza Arjmandi, Ilknur Y ldırım, Fiona Hatton1, Azman Hassan, Christopher Jefferies, Zurina Mohamad and Norhayani Othman “Kenaf fibers reinforced unsaturated polyester composites: A review” Journal of Engineered Fibers and Fabrics Volume 16: 1 22
[3] Izdihar Tharazi , Abu Bakar Sulong, Farrahshaida Mohd Salleh, Abdul Hakim Abdullah, Nur Farhani Ismail “Application of Response Surface Methodology for Parameters Optimization in Hot Pressing Kenaf Reinforced Biocomposites” Journal of Mechanical Engineering Vol 17(3), 131 144, 2020

[4] Karthick.R , Mukesh.K , Kuttimani.C , Muralidharan.S “Fabrication and Property Evaluation of Kenaf Jute Fiber Reinforced Composites” IJIRSET Vol. 4,May 2015
[5] Kun Lia, Shilin Yana, Yucheng Zhong , Wenfeng Panc , Gang Zhao “Multi Objective Optimization of the Fiber reinforced Composite Injection Molding Process using Taguchi method, RSM, and NSGA II” Simulation Modelling Practice and Theory (2018)
[6] Temesgen Berhanu Yallew ,Eshetie Kassegn , Sirak Aregawi1,Alula Gebresias “Study on efect of process parameters on tensile properties of compression molded natural fber reinforced polymer composites” Springer Nature Switzerland AG (2020)
[7] ian Wang , Qianchao Mao , Nannan Jiang and Jinnan Chen ”Effects of Injection Molding Parameters on Properties of Insert Injection Molded Polypropylene Single Polymer Composites” Polymers 2022,
[8] M. Bernard , A. Khalina , Aidy Ali , R. Janius , M. Faizal , K.S. Hasnah , A.B. Sanuddin “The effect of processing parameters on the mechanical properties of kenaf fibre plastic composite” Materials and Design 32 (2011)
