10 XI November 2022 https://doi.org/10.22214/ijraset.2022.47462
ISSN: 2321 9653; IC Value: 45.98; SJ Impact Factor: 7.538

Volume 10 Issue XI Nov 2022 Available at www.ijraset.com

ISSN: 2321 9653; IC Value: 45.98; SJ Impact Factor: 7.538
Volume 10 Issue XI Nov 2022 Available at www.ijraset.com
1
1, 2, 3, 4
5
2
3 ,

4,
5
Abstract: In this Internet era, where everything is available online so is News. People are nowadays using online platforms like Facebook, Twitter, Instagram to read and share the news. Predicting the popularity of news accurately holds immense value for news providers including online stakeholders, advertisers. In this research paper we aimed at finding the best model for predicting the accuracy of online news articles.
The data for our project has been taken from a website named Mashable. We used various models on the dataset and found that SVR with PCA yielded the best results.
Keywords: Machine learning, popularity prediction.
Today, reading and sharing news have become the center of people’s entertainment lives. The prediction of the popularity of news before the news gets published will be really beneficial for the media industry including authors, advertisers, reporters etc. The popularity prediction of online news content has remarkable practical values in many fields. For instance, taking in account the benefits the news popularity prediction will have, news authority can have a beforehand understanding of such online news consumption users. This will let news organization deliver more useful, engaging content with which people can relate more. Working in this manner will allow the news authority people to allocate resources more judiciously. News popularity prediction can give an upper hand in keeping the organization well informed for trend changes if any, understanding choice of human according to prevailing situation, allow them to make more profitable business ,and increase the number of readers and deliver them relatable content quickly and efficiently. The project aims to develop an effective learning algorithm to predict how popular an online article (news or story) would be before its publication by analyzing several statistical characteristics extracted from it.
We are using an existing dataset of news articles on www.mashable.com The dataset was scraped by Fernandez et. all for their paper titled, “A Proactive Intelligent Decision Support System for Predicting the Popularity of Online News”. The results obtained by us are comparable to the results obtained in this paper. The subject of news popularity has been extensively studied in related contexts, especially home page rankings for news articles on sites like www.yahoo.com and www.cnn.com . Many aggregations of time sensitive articles are interested in promoting content that others will find as interesting. To this end, the paper by Fernandez et. al extends their models to provide the authors with recommendations on what enhancements may be made prior to publication to influence article popularity like using different keywords, changing the length of title of the article, etc. Additionally, we came across related work by S. Jamalli et. al. that studied, amongst other interesting things, popularity prediction for content on Digg. There was also a past Kaggle competition that used the same UC Irvine dataset as our project, optimizing for a similar goal of popularity prediction.
Online news popularity prediction (Mashable news) dataset is publicly available at http://archive.ics.uci.edu/ml/datasets/Online+News+Popularity, which aims to predict the future popularity of news articles using information that are known before the release of news articles. Mashable news dataset consists of 58 heterogeneous features about the associated statistics of the original news articles released by Mashable (www.mashable.com) during a two years period from January 7, 2013 to January 7, 2015 .
Additionally, they extracted a bunch of natural language processing features such as closeness to top latent Dirichlet allocation (LDA) topics, title subjectivity, the rate of positive and negative words and title sentiment polarity by using LDA to compute relevant topics as well as to measure the closeness of current article to the previously computed topics. Sentiment polarity and subjectivity scores were also computed by applying the pattern web mining module.
ISSN: 2321 9653; IC Value: 45.98; SJ Impact Factor: 7.538 Volume 10 Issue XI Nov 2022 Available at www.ijraset.com
Seven models were used to perform binary classification. For each model, we used 10 fold cross validation to give us an accurate estimate of model prediction performance, except SVM for which 5 fold cross validation was used as the computation time was very high.
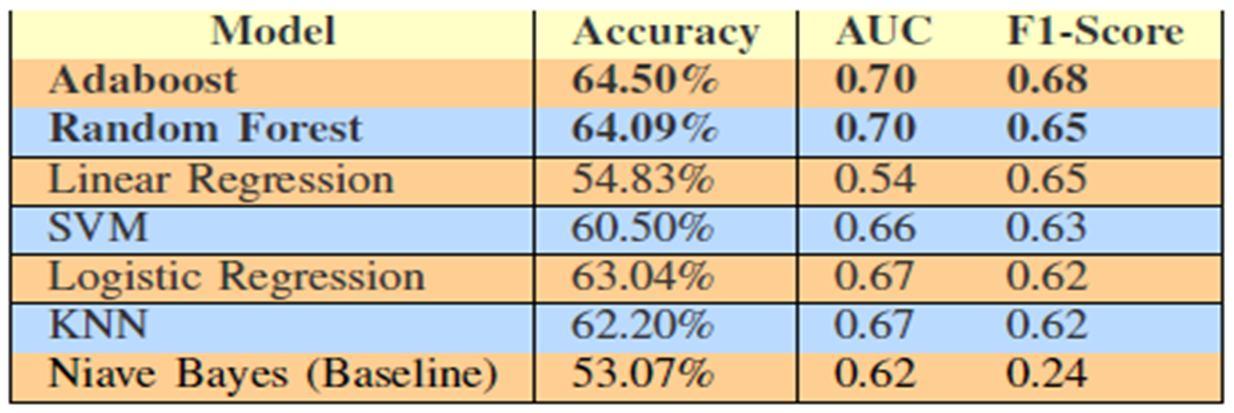
Linear Regression was used to predict the number of shares for every news article. This was converted to a classification result based on the threshold. All 58 predictive features were used for this model. The weakness of this approach is that it assumes that our features are mutually independent and that our classes are linearly separable. Furthermore, we are using this regression approach on a classification problem which does not lend itself well to a high performing model.
RFE was used to retrieve the top 20 features for the Logistic Regression model. The regularization parameter used is 1.0 with L2 regularization. An advantage of this model is that we are using a non linear activation function (sigmoid) to provide contrast to the linear separability assumption of Linear Regression.
RFE was used to retrieve the top 20 features for the model and then a SVM classifier was trained with a radial basis function kernel and the regularization parameter, C = 10. We tried linear, polynomial, and radial kernels. We choose RBF because it yielded the best accuracy. An advantage of SVM is that it is guaranteed to converge to a global minimum. However, the computation time required is comparatively higher and it does not return probabilistic confidence.
In Random Forest, we used 100 trees and the maximum number of features considered at each decision node was log2(total features) = 6. Since, Random Forest is an ensemble classifier, it gives a very good generalization performance and does not overfit the data. Also, since it uses decision trees it can learn non linear hypothesis and is in top two classifiers in terms of performance.
We used decision stump as a base estimator for Adaboost and used grid search on 10, 50 and 100 decision stumps and got the best performance with 100 decision stumps. We used this classifier because it has a fairly good generalization performance and in addition to bagging, it uses boosting which helps in learning complex non linear hypothesis which is necessary because the data is not linearly separable. This gave us the best performance out of all the other classifiers we used.
This method determines the class of each testing sample by taking the majority vote from its k nearest training samples. To arrive at the right number of nearest neighbors to consider, we performed a search over a list of multiple k values and then picked a k value that gave the best AUC score. The strength of this model is that it is robust to fluctuations in feature values, taking an aggregate similarity measurement across features (L2 Norm). A weakness of this model is that we are making an assumption about which distance metric to use. For example, while it makes sense for real valued features to use the Euclidean Distance, perhaps Manhattan Distance is more appropriate for one hot encoded features like day_of_the_week.
Results obtained were as given in the table.
ISSN: 2321 9653; IC Value: 45.98; SJ Impact Factor: 7.538 Volume 10 Issue XI Nov 2022 Available at www.ijraset.com
39,000 articles taken from UCI Machine Learning Repository. Contained 58 features and the final no of shares associated with each of the articles.
On getting data description and observing the data, we find that the first two columns are not useful for prediction. Hence, we drop these columns. Rest of the data is numeric, or ordinal, so we don’t need preprocessing. We did not find any missing values in the dataset.
We performed Principal Components Analysis (PCA) on the 58 dimensional feature space to analyze the covariance of features in our dataset. In projecting our data into PCA space we were surprised to observe that the PCA dimensions do not lend themselves well to discriminating popular vs unpopular news articles. This is an important insight for this predictive task.
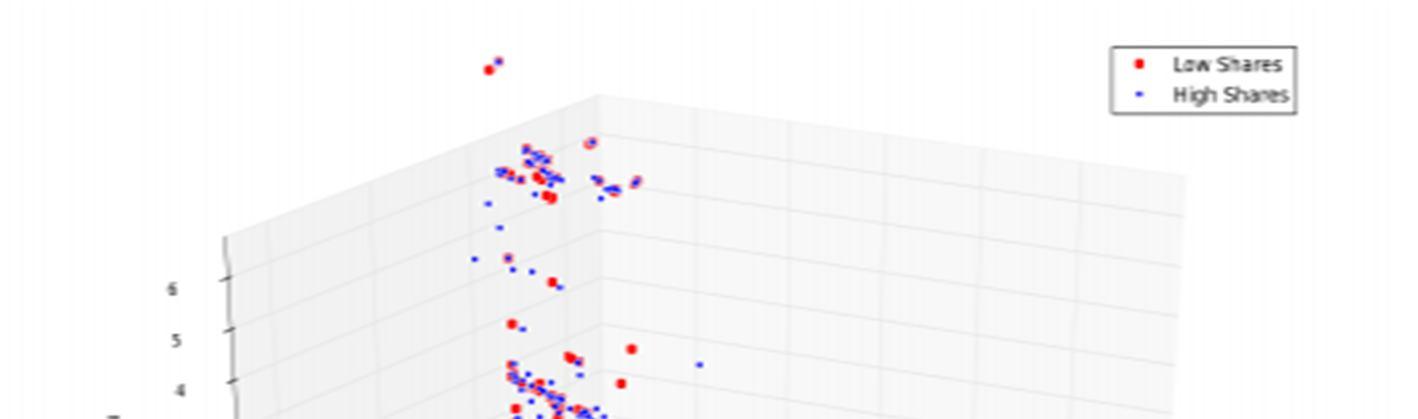
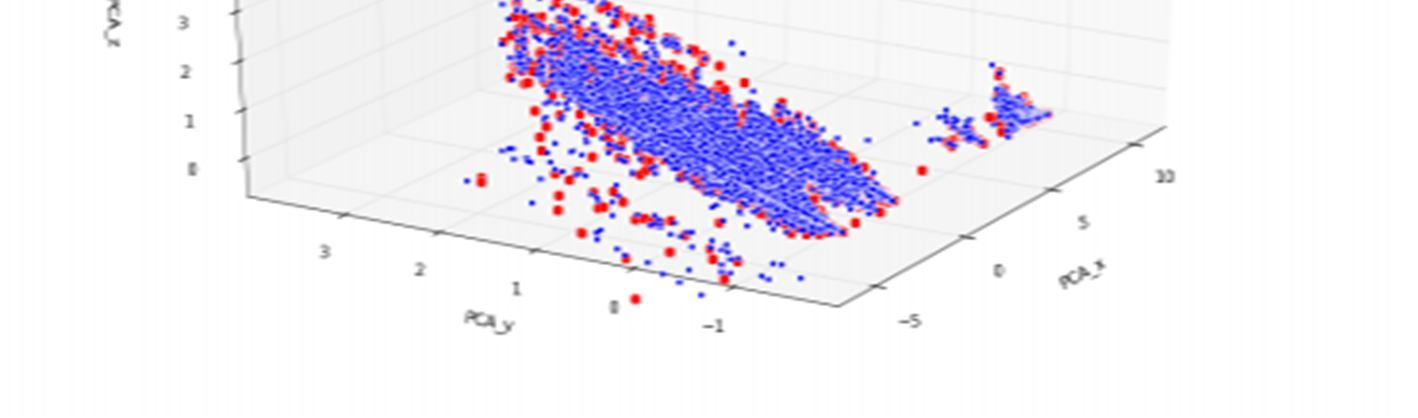
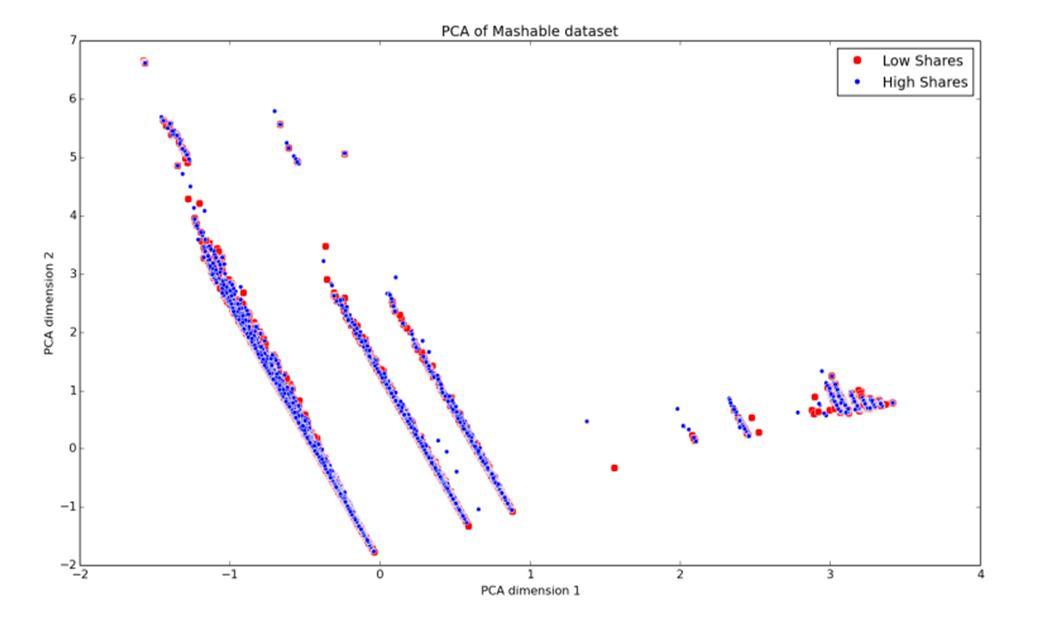
Two dimensions of the feature space explain 92.6% of the variance in the data and three dimensions of the feature space explain 96.2% of the variance in the data. In these plots it is clearly evident that our classes are not separable in PCA space.
The features do not clearly demarcate the two classes. This served as the first indication that our classification results may not be exceptionally strong because classification problems discriminate powerfully where there exists a manifold which clearly separates the data classes. Despite clever feature selection, our best models only perform reasonably, never exceptionally.
ISSN: 2321 9653; IC Value: 45.98; SJ Impact Factor: 7.538 Volume 10 Issue XI Nov 2022 Available at www.ijraset.com
Now, we had to split away input and output features into training and testing set. For this formulation, we used a Neural Network with 3 densely connected layers with 100, 70 and 32 nodes respectively. The activation function used for the dense layers is ‘relu’. The output layer is also deeply connected but only has 2 nodes (since this is a binary classification problem). The output layer’s activation function is ‘softmax’ which maps the values in a range of [0,1] which add up to 1. Hence the node with the greater value is the final prediction.
Stochastic Gradient Descent is used as the optimizer for the model and Categorical Cross entropy for the model’s loss function. After some hyperparameter tuning, the model reached an accuracy of 65.1% (validation loss of 0.62) which is a little less than some of the Machine Learning models.
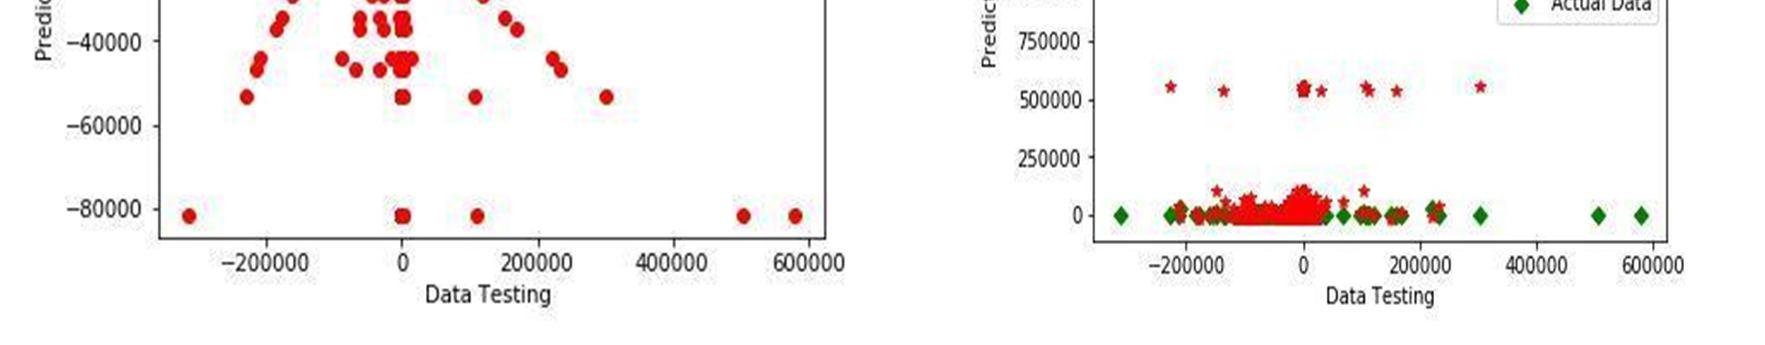
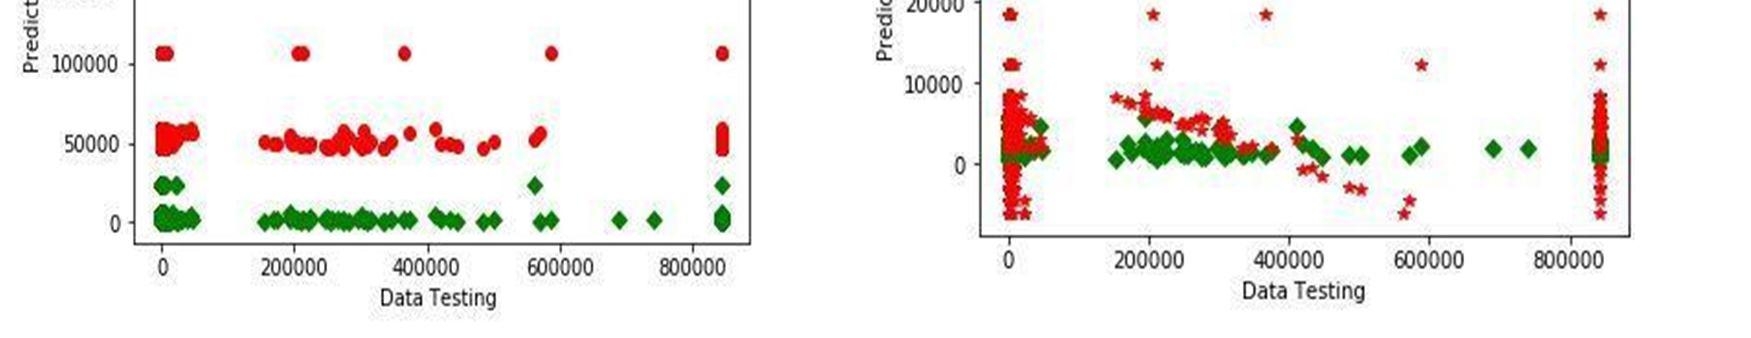
We have first applied, the Neural Networks and then the SVR (Support Vector Regression) to predict the popularity of the news item. Then to understand the data more, we use, Principal Component Analysis (PCA) to understand the significance of each feature and then re run the above techniques to see the difference.
While doing these tests, we found Neural Networks need a lot of data to perform well, as they have lots of parameters that need to converge to a good solution, whereas SVR performs well. On doing PCA, the Neural network will improve, as now the number of parameters are less, and with low data, the accuracy will be better, but as the data improves, Neural network will gain accuracy, but overall in both settings, SVR performed well.
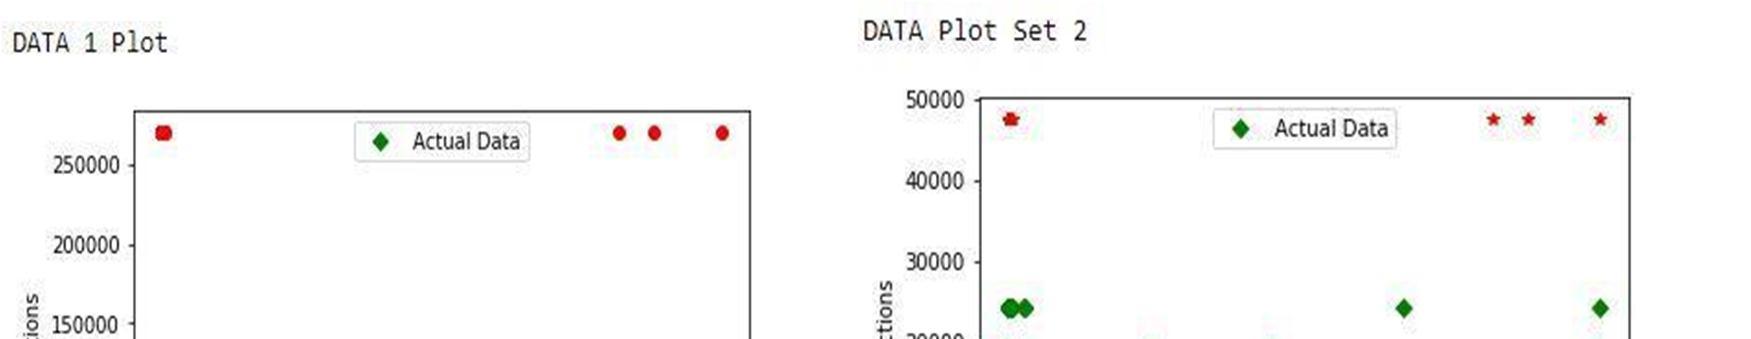
We compare the predicted data with actual data.
The datasets available on the UCI ML repository are usually clean and processed. However, one flaw of the dataset was all the column names had an appended space on the left. That is, once the data is loaded in a pandas dataframe, for example, the shares column, would have to be accessed by df[‘ shares’] instead of df[‘shares’]. This may seem trivial, but it can cause some frustrating errors while running the experiments.
URL and timedelta columns have been omitted when loading the CSV data file since they are meta data and cannot be treated as features.
Since different features have different ranges of values, some features may affect the prediction more than others. Therefore, a common practice is to standardize and normalize the data. Scikit learn provides many variations of such scaling. The most suited method for this project is found to be the MinMaxScaling. This estimator scales and translates each feature individually such that it is in the given range on the training set, i.e. between zero and one.
The most important part of any machine learning project is feature engineering. It is even more important than the model selection itself. We had 58 different features to choose from which made the problem of feature selection quite difficult.
When dealing with a lot of features, one common technique is to reduce the dimensions. We made a use of Single Value Decomposition (another technique of dimensionality reduction) in this project. Most Kaggle users use SVD for improving the model accuracy by appending the SVD components with the features. Keeping this in mind, we appended 10 SVD components into the already present 58 features to get a total of 68 predictors. This improved the accuracy by a margin of 3% which made the difference in beating the state of the art results as reported by Fernandes et. al.
Another technique of reducing features is by looking at the ‘feature_importances_’ attribute of the model. This attribute lists the importance of each feature in the form of probability from a range of [0.0, 1.0]. Dropping the features with smaller importance reduces noise from the data. A feature, ‘n_non_stop_words’, had 0.00008 importance and hence it was dropped from the model.
ISSN: 2321 9653; IC Value: 45.98; SJ Impact Factor: 7.538
Volume 10 Issue XI Nov 2022 Available at www.ijraset.com
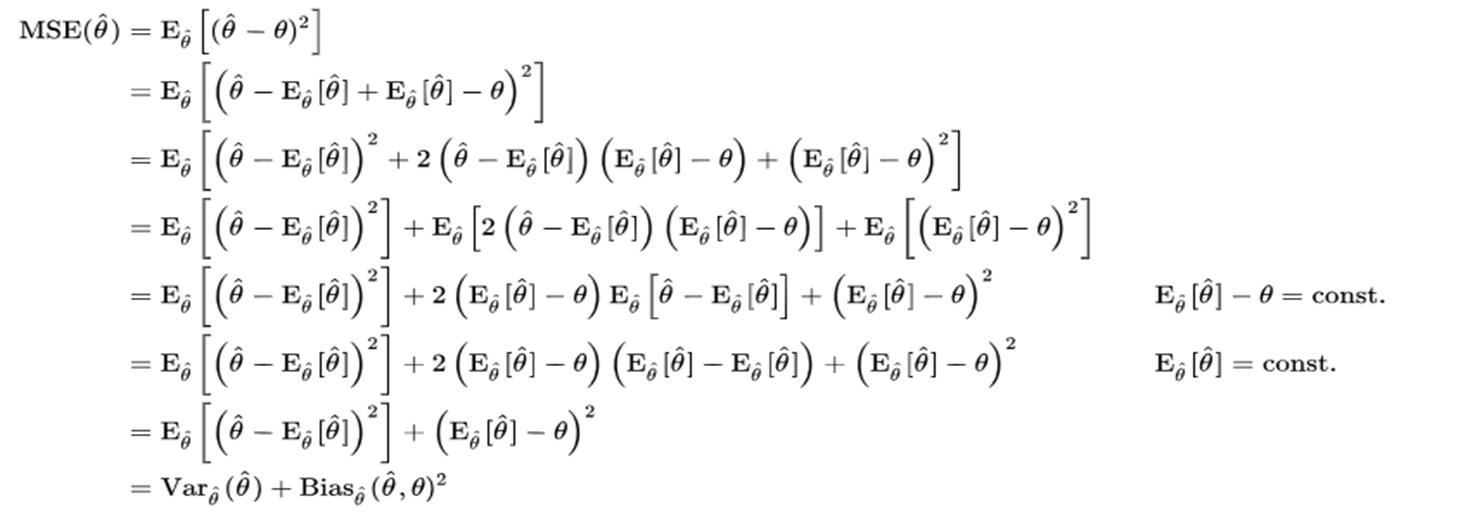
In our project we calculate error by using Root Mean Squared Error (MSE) technique which is commonly used for predicting purpose.
A. Neural Networks: 65 69%
B. SVR: 67 70%
C. Neural networks after applying PCA: 70 75%
D. SVR after applying PCA : 74 78%
Neural Network without PCA
Support vector Regression without PCA
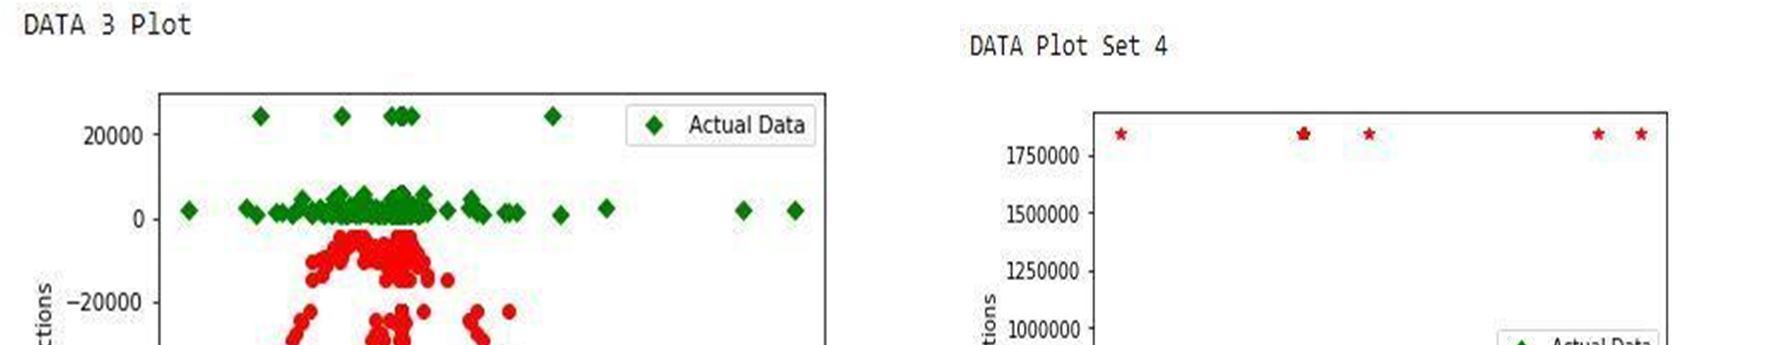
Neural Network after using PCA
Support Vector Regression after using PCA
ISSN: 2321 9653; IC Value: 45.98; SJ Impact Factor: 7.538 Volume 10 Issue XI Nov 2022 Available at www.ijraset.com
This project introduces and implements neural network and SVR to tackle the challenge of classifying popular news articles from unpopular articles by measuring the count of shares in before publication approach. Our findings suggest that neural network and SVR is able to predict popularity with a decent prediction rate using only statistical features associated with original news articles without using the original content of news articles or after publication attention. neural network and SVR also outlined discriminative and useful metadata features, such as the statistical summary of keywords, the earlier popularity of articles referenced in articles, natural language processing features, and publication time. Future work will include, first, the exploration of more advanced features regarding content like trend analysis. Second, the evaluation of the prediction model on more complex and more unbalanced popularity prediction datasets. Third, the comparison of the model with many other state of the art techniques. Future work will include, the exploration of more advanced features regarding content like trend analysis. The evaluation of the prediction model on more complex and more unbalanced popularity prediction datasets. The comparison of the model with many other state of the art techniques.
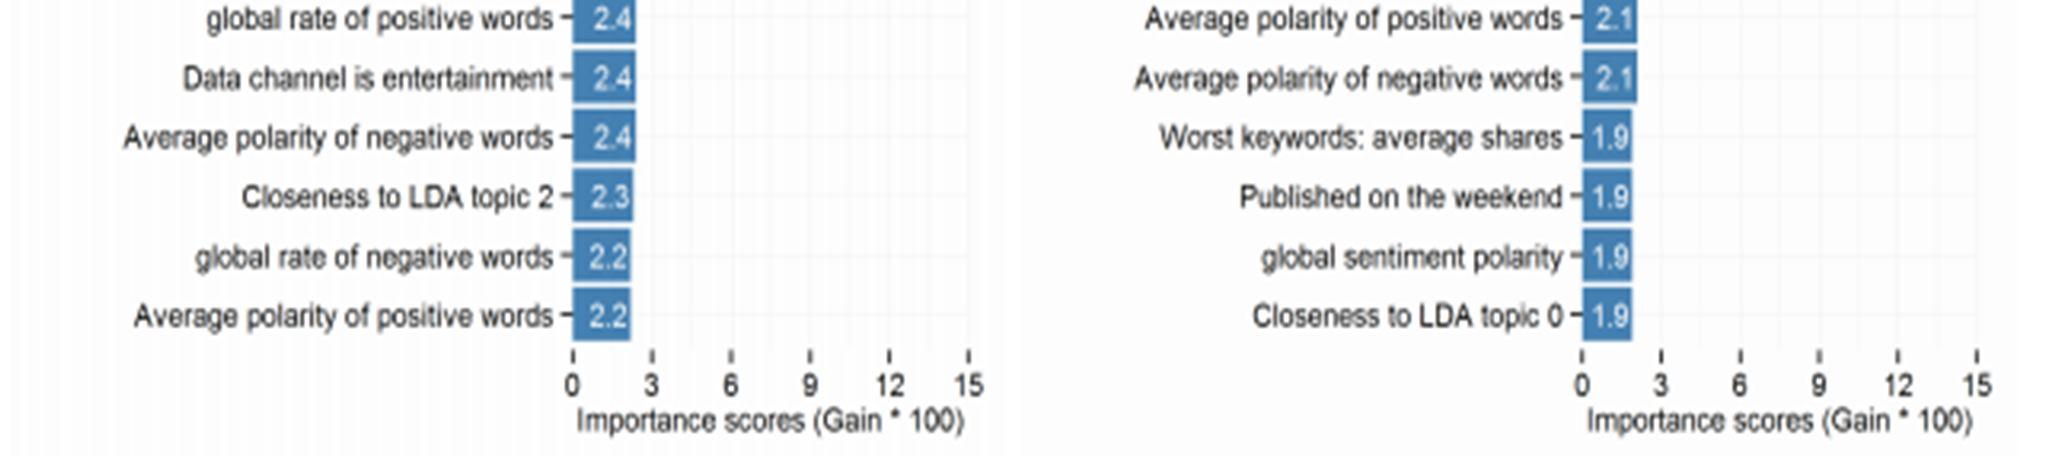
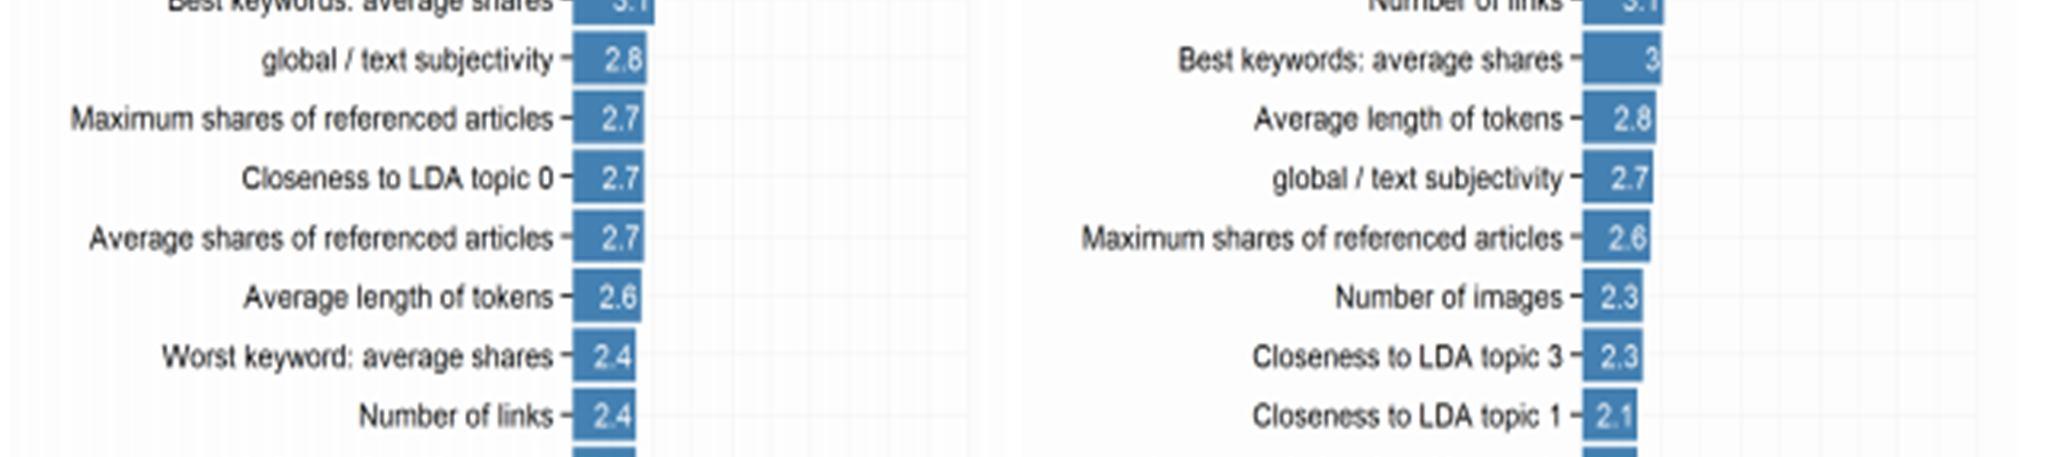
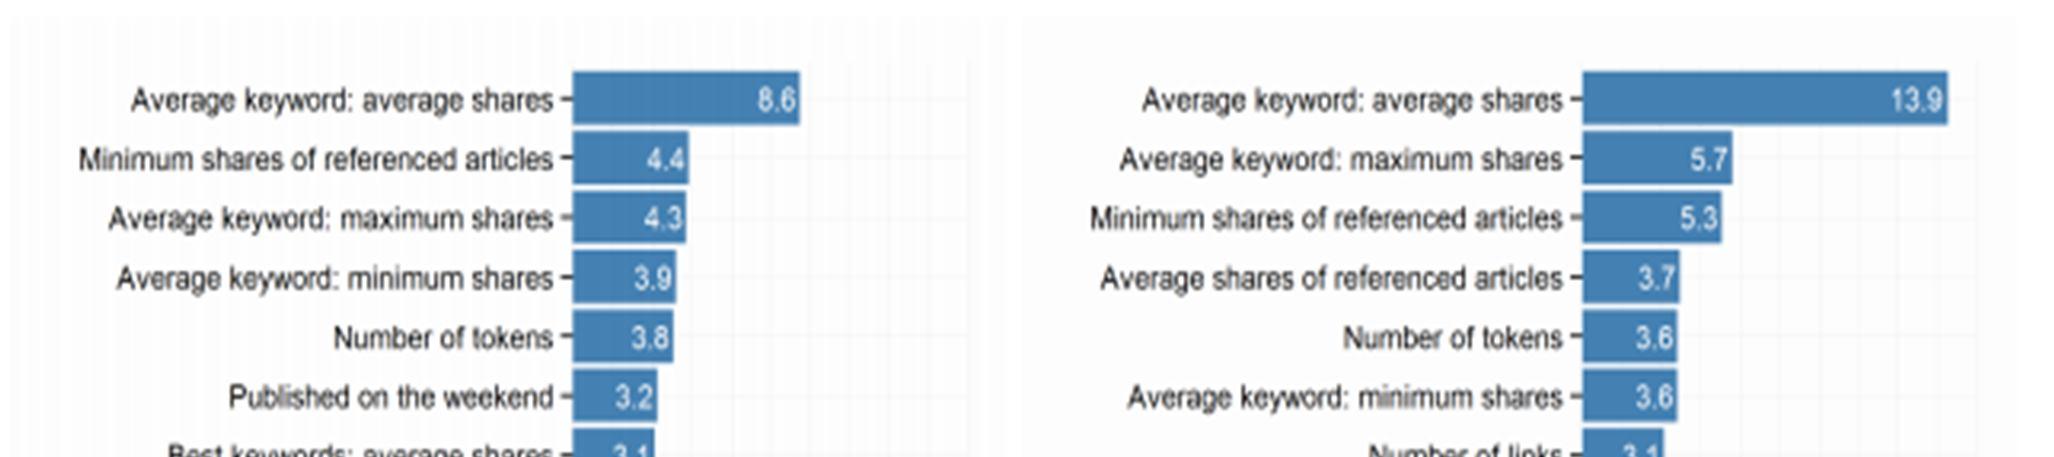
Top 20 features based on the importance scores of features, measured via GBM, for predicting the, from left to right, popularity of online news, and number of shares of online news.
In this project, we worked on a dataset to predict the popularity of a news article. Based on the correlation coefficient matrix, following are some recommendations to improve the popularity of News Article:
A. Increase The
1) Number of embedded links
2) Number of images 3)
Number of videos 4) Amount of subjectivity in title 5) Number of words which are more popular 6) References to older articles which have high popularity
ISSN: 2321 9653; IC Value: 45.98; SJ Impact Factor: 7.538
Volume 10 Issue XI Nov 2022 Available at www.ijraset.com
B. Decrease The
1) Number of longer words in the content
2) Amount of multi topic discussion in an article (Articles which talk about multiple topics perform poorly)
3) Number of negative words (words with negative polarity)
Some other observations Articles with positive words in the title tend to be more popular while articles in the ‘world’ channel/category tend to be less popular.
[1] Tatar, P. Antoniadis, M. Amorim, and S. Fdida, “From popularity prediction to ranking online news,” Social Network Analysis and Mining, vol. 4, no. 1, 2014. [Online]. Available: http://dx.doi.org/10.1007/s13278 014 0174 8
[2] C. Castillo, M. El Haddad, J. Pfeffer, and M. Stempeck, “Characterizing the life cycle of online news stories using social media reactions,” in Proceedings of the 17th ACM Conference on Computer Supported Cooperative Work & Social Computing, ser. CSCW ’14. New York, NY, USA: ACM, 2014, pp. 211 223. [Online]. Available: http://doi.acm.org/10.1145/2531602.2531623
[3] S. Gao, J. Ma, and Z. Chen, “Modeling and predicting retweeting dynamics on microblogging platforms,” in Proceedings of the Eighth ACM International Conference on Web Search and Data Mining, ser. WSDM ’15. New York, NY, USA: ACM, 2015, pp. 107 116. [Online]. Available: http://doi.acm.org/10.1145/2684822.2685303
[4] A. Tatar, M. de Amorim, S. Fdida, and P. Antoniadis, “A survey on predicting the popularity of web content,” Journal of Internet Services and Applications, vol. 5, no. 1, 2014. [Online]. Available: http://dx.doi.org/10.1186/s13174 014 0008 y
[5] Scikit learn, Scikit learn: Machine Learning in Python, Pedregosa, F. and Varoquaux, G. and Gramfort, A. and Michel, V. and Thirion, B. and Grisel, O. and Blondel, M. and Prettenhofer, P. and Weiss, R. and Dubourg, V. and Vanderplas, J. and Passos, A. and Cournapeau, D. and Brucher, M. and Perrot, M. and Duchesnay, E., Journal of Machine Learning Research, volume=12, pages=2825 2830,2011
[6] Fernandes, Kelwin, Pedro Vinagre, and Paulo Cortez. ”A proactive intelligent decision support system for predicting the popularity of online news.” Portuguese Conference on Artificial Intelligence. Springer International Publishing, 2015.
[7] S. Jamali and H. Rangwala, ”Digging Digg: Comment Mining, Popularity Prediction, and Social Network Analysis,” 2009 International Conference on Web Information Systems and Mining, Shanghai, 2009, pp. 32 38.
[8] ”Predict the Popularity of an Online News Article.” Kaggle: Your Home for Data Science. N.p., 16 Mar. 2016. Web. 11 Mar. 2017. ¡https://inclass.kaggle.com/c/predicting online news popularity¿.
[9] Y. Zhu and D. Shasha, “Efficient elastic burst detection in data streams,” in Proc. of KDD’03. ACM, 2003, pp. 336 345.
[10] S. A. Myers and J. Leskovec, “The bursty dynamics of the twitter information network,” in Proc. of WWW’14. ACM, 2014, pp. 913 924.
[11] S. Alcock and R. Nelson, “Application flow control in youtube video streams,” ACM SIGCOMM Computer Communication Review, vol. 41, no. 2, pp. 24 30, 2011.
[12] A. V´azquez, J. G. Oliveira, Z. Dezs¨o, K. I. Goh, I. Kondor, and A. L. Barab´asi, “Modeling bursts and heavy tails in human dynamics,” Physical Review E, vol. 73, no. 3, p. 036127, 2006.
[13] K. Lerman and R. Ghosh, “Information contagion: An empirical study of the spread of news on digg and twitter social networks.” 2010.
[14] Y. Keneshloo, S. Wang, E. H. S. Han, and N. Ramakrishnan, “Predicting the popularity of news articles,” in Proc. Of SDM’16, 2016.
[15] T. Zaman, E. B. Fox, E. T. Bradlow et al., “A Bayesian approach for predicting the popularity of tweets,” The Annals of Applied Statistics, vol. 8, no. 3, pp. 1583 1611, 2014.
[16] G. Szabo and B. A. Huberman, “Predicting the popularity of online content,” Communications of the ACM, vol. 53, no. 8, pp. 80 88, 2010.
[17] L. Marujo, M. Bugalho, J. P. d. S. Neto, A. Gershman, and J. Carbonell, “Hourly traffic prediction of news stories,” arXiv preprint arXiv:1306.4608, 2013.
[18] J. Cheng, L. Adamic, P. A. Dow, J. M. Kleinberg, and J. Leskovec, “Can cascades be predicted?” in Proc. Of WWW’14. ACM, 2014, pp. 925 936.