1 minute read
International Journal for Research in Applied Science & Engineering Technology (IJRASET)

from Multifunctional Control for PV Integrated Battery Energy Storage System with Enhanced Power Quality
by IJRASET


ISSN: 2321-9653; IC Value: 45.98; SJ Impact Factor: 7.538
Advertisement
Volume 11 Issue III Mar 2023- Available at www.ijraset.com
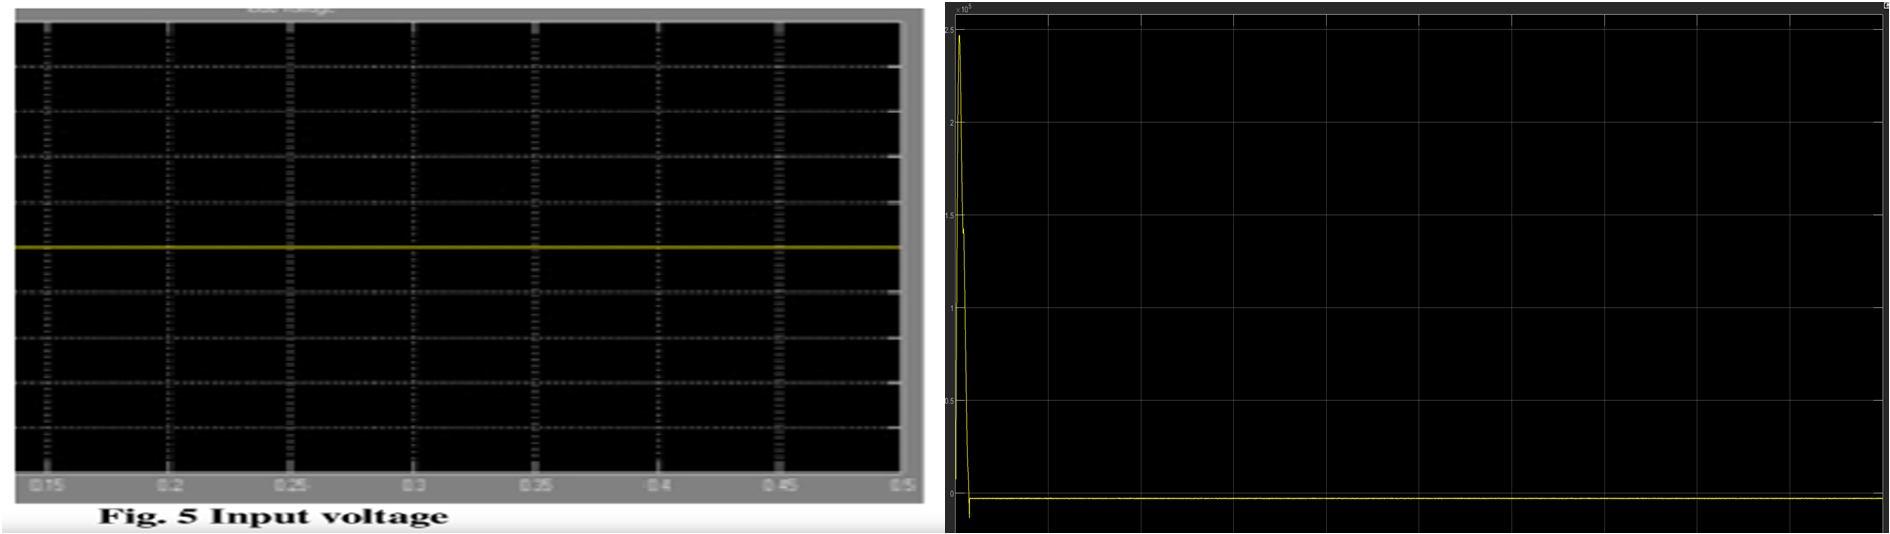
Battery SOC increasing even with Switch open waveform as shown in Fig.13. The Fig 14 is the input voltage waveform. Boost Converter DC Link Output Voltage, Current and Power with Maximum Power Point Tracking. Figure 16: shows the Boost Converter Inverter output voltage and current. Figure 17. Shows Boost Converter Load, Inverter, and Grid Active Power Profile. Fig 18 as shown in SOC Exponential Characteristics. Figure 19: Bi-Directional Converter Output Voltage and Current. The Fig 20 as shown in Short circuiting the PV panel, Grid Voltage and DC-link Voltage. The Fig 21 shows the DOD Discharge Characteristics. It is output waveform of bidirectional converter when it was operated in boost mode. If the system connected with grid at the same time SOC of the battery below 25%


