https://doi.org/10.22214/ijraset.2023.49414

ISSN: 2321-9653; IC Value: 45.98; SJ Impact Factor: 7.538

Volume 11 Issue III Mar 2023- Available at www.ijraset.com

https://doi.org/10.22214/ijraset.2023.49414

ISSN: 2321-9653; IC Value: 45.98; SJ Impact Factor: 7.538

Volume 11 Issue III Mar 2023- Available at www.ijraset.com
Abstract: The micro-hardness test is often used to pre-determine the mechanical properties of a material. The Vickers method can be used for testing metals, particularly those with extremely hard surfaces. The study of the correlation between applied load and the measured value of the microhardness was carried out for Bismuth wire samples. Bismuth is a semimetal in bulk, it is not a good thermal electrical material. Bismuth nanowires (10nm) have a thermal electric figure while exhibiting semiconductor behaviour. Mechanical characterization is critical for the formation of nanowires made of various materials. The microhardness testing of bismuth wire plate samples was performed on a microscopic scale in this communication. Vicker's number variation is reported. At low indentation test loads, an indentation size effect was observed for Bismuth wire plate samples. For all samples, the variation of microhardness number (Hv) with variable loads is non-systematic. PSR ( Proportional specimen Resistance )Model, MPSR ( Proportional specimen Resistance )Model for the calculation of elastic stiffness constant C11, Wooster’s empirical relations used with obtain hardness data.
Keywords: Vicker’s microhardness, Bismuth wire samples, ISE, PSR, MPSR
Bismuth nanowires are useful as a fuse in infrared optics and provide an excellent opportunity to investigate the effect of quantum confinement. 5N pure Bismuth was obtained from Nuclear Fuel Complex, Hydrabad. These mechanical studies could aid in the formation of crystalline bismuth nanowires. Microhardness testing of bismuth wire pates was performed on a microscopic scale in this communication. Microhardness testing is a non-destructive method for determining the suitability of a material for a given purpose. Microhardness testing was performed on 5N pure bismuth wire plate samples. The linear relationship of the double logarithm between measure (the microhardness) and scale (the applied load) shows indentation self-similarity, both in indentation shape and in the results of hardness for pure Bismuth wire plates samples .The behavior of variation in microhardness number (Hv) with load changes is non linear. Mayer's index 'n' was also discovered, and its value for bismuth metal is less than 2; this indicates that the material is soft and extremely ductile.
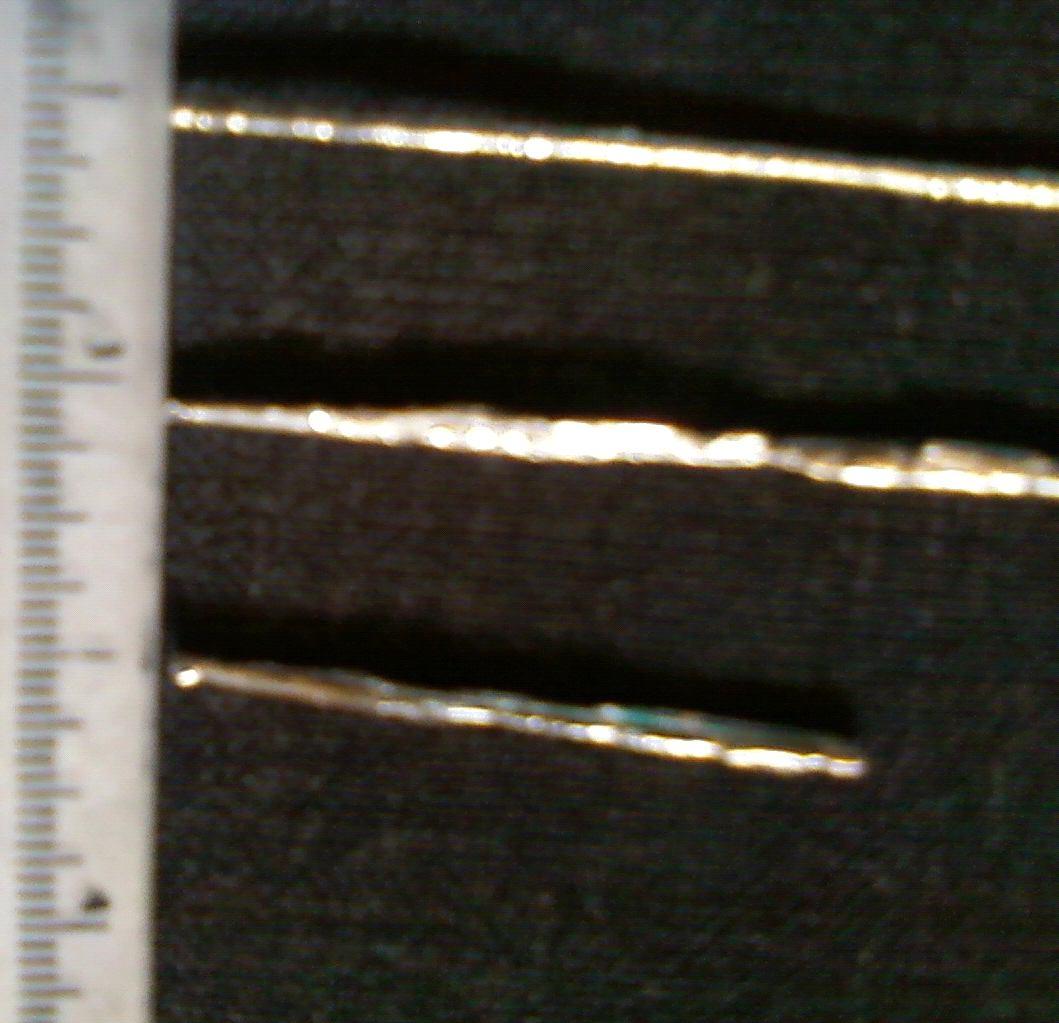
Macrowire of bismuth material was prepared by melting the bismuth metal in the thistle and end of thistle was connected to 1 meter long and 1 mm diameter wire wounded capillary. The current supplied to obtain the melting temperature of Bismuth material. The molten melt moves in capillary and after cooled it slowly a very fine nearly 20 cm long wire was obtained as shown in fig.4. The wire was sliced by thin plates and indented on Vaisheshika Vickers Microhardness tester. Indentation mark were made with a pyramidal diamond indenter. The measurements were carried out for load ranging from 10 gm to 120 gm for all samples and the indentation time kept constant and it was 10 seconds Randomly different indentation marks for constant time were made for different load values on smooth surface of Bismuth plates The mean diagonal length was used in calculations. Vickers microhardness number (Hv) is obtained for each sample. To obtain the general behaviour, the average of 20 samples at each load were drawn on single graph of Hv vs P. Vickers microhardness were obtained through following relation
Hv = 1.854 P/d² Kg/mm² (1)

Where P is the applied load in Kg and d is average diagonal length of indented impression in mm. Hv is in unit of Kg/ mm². The Moh hardness HM is calculated through Mott formula shown in table –I for respective samples,
HM = 0.657 ( Hv ) ¹/ ³ (2)
ISSN: 2321-9653; IC Value: 45.98; SJ Impact Factor: 7.538

Volume 11 Issue III Mar 2023- Available at www.ijraset.com
The variation of Vickers microhardness number Hv is function of applied load for Bismuth wire plates and Vickers microhadness number Hv decreases with increase of load at lower load values , at higher load it becomes constant. The microhardness decrease with increase of load is in good agreement with the normal Indentation Size Effect (ISE) [1-4] . Several models for the relationship between applied indentation test load and indentation diagonal length have been reported in the literature to describe the ISE behaviou of material. Intrinsic structural factors of the test material [ 5,6,7] is the most common explanation of ISE found in literature.
In order to analyze the ISE in the hardness testing one needs to fit the experimental data according to Meyer’s law, which correlates the resulting indentation size d and applied load P with each other,
P = K1dⁿ (3)
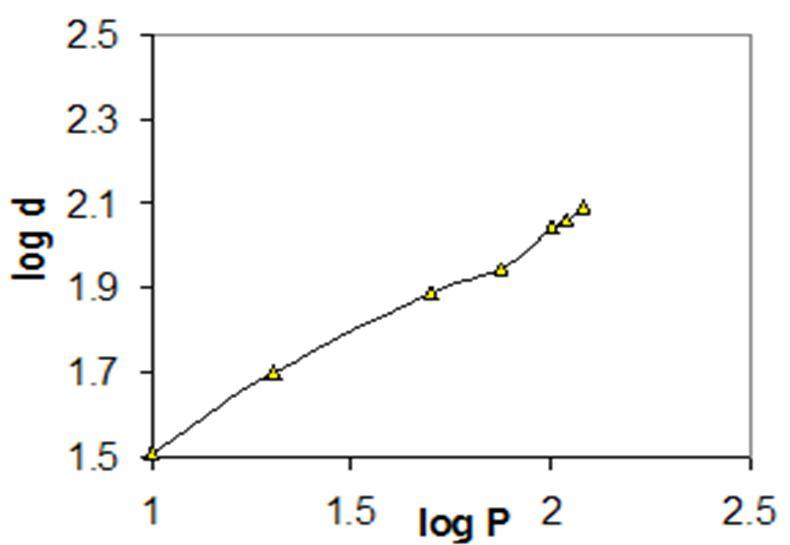
Where K1 is the material constant (standard hardness), n is the Meyer index and other symbols have their usual meanings. fig 2 illustrating the plot of log P against log d for bismuth wire plates samples, is in good agreement with Meyer’s law.

Combining equation (1) and (3) we get
Hv = K2P ⁿ − ² / ⁿ
Here K2 is a new material constant. This expression shows that Hv should decrease with increase in P if n < 2., which is in good agreement with the experimental data because the value of n. The value of n calculated using least square fitting method was found to be less than 2 for bismuth wire plate samples as shown in table-I.

According to Onitsch [8] and Hanneman [9] , n should lie between 1 to 1.6 for hard material and above 1.6 for softer ones. The value of n for all samples are above 1.6 so, it suggests that our samples belong to soft material category. Recently Li and Bradt explained the ISE with help of general model “Proportional Specimen Resistance” (PSR). As can be seen from fig 1. Hv for all Bismuth samples attains saturation value at higher load can be explain by PSR model. According to PSR model, there are two factors which are responsible for decrease of Hv with increase in load. These are (i) the frictional forces between the test specimen and indenter facts and (ii) the elastic resistance of the test specimen. In the PSR model Li and Bradt, microhardness can be described by two different parts,

ISSN: 2321-9653; IC Value: 45.98; SJ Impact Factor: 7.538

Volume 11 Issue III Mar 2023- Available at www.ijraset.com
1) The indentation load dependent part or ISE regime and
2) The indentation test load independent part. The indention test load (P) is related to indentation size d (Li, Bradt) [10]
As P = a1d + a2d = a1d + (Pc/d0) d² (4)
a1 – coefficient is contribution of proportional specimen resistance to apparent microhardness
a2 - coefficient related to load independent microhardness
P – the critical applied test load above which microhardness become load independent d0 – the corresponding diagonal length of the indentation equation (3) can be rearranged as

P/d = a1 + (Pc / d0²)d (5)
i.e. a Plot P/d against d will give a straight line as shown in fig.3 ,the slope of the plot the value of load independent microhardness (Hv°) for Bismuth wire plates shown in table-I. Applying PSR model of Li and Bradt [6] in the case of Bismuth samples have been observed the plot of p/d against conform that PSR model is also applicable for bismuth wire plate samples. The slope of plot P/d against d give the value of Pc/d0² which when multiplied by Vickers conversion factor 1.854 gives load independent microhardness. Table-I summarized the Vickers microhardness as obtained from equation (1) along evaluated from the slopes of graphs..

Gong et al. in [16] modified the PSR model to investigate the ISE behaviour in various materials. The resulting MPSR model is defined by (4a):
ISSN: 2321-9653; IC Value: 45.98; SJ Impact Factor: 7.538

Volume 11 Issue III Mar 2023- Available at www.ijraset.com
where 0 is a constant related to the residual surface stresses associated with the surface grinding and polishing processes during sample preparation. The parameters 1 and 2 are constants as defined in the PSR model. The values of 0, 1, and 2 can be evaluated by plotting the data against . The plot of versus (and polynomial curve fitting there of according to the MPSR model) is 4.4shown in Figure 4.We can conclude this to be fractal behaviour. The load dependence of hardness shows dual fractal behaviour given the two different regions of hardness. Correlation was found in both the tensile and pressure tests between the degree of deformation and Meyer’s index (n). In the unreformed sample, the value of Meyer’s index is close to 2, with the increase in the degree of tensile deformation increasing its “normal” character (values less than 2), Based on the observation, a comprehensive study of ISE in microhardness measurements was conducted using a number of existing models, that is, the classical Meyer's law, Li and Bradt's proportional specimen resistance model (PSR) and the modified proportional specimen resistance model (MPSR), Table 2 Wooster’s empirical relation [11] used to calculate first order elastic stiffness coefficient C11 shown in table –2 log C11 = 7/4 log Hv° (8)

Bismuth wire of 20 cm long and 1mm diameter obtained Microhardness measurement of Bismuth wire plate samples are calculated and Vickers hardness number (Hv) is in the range16-19 kg/mm² under the applied load in the region of 10-120 gm If the range of “very low loads” and the measured values of the micro-hardness decrease with the increase of the load, a “normal” Indentation Size Effect (ISE) and this behavior observed for Bismuth wire plate samples .The variable hardness for different faces at different planes defined as microhardness of Bismuth crystal is influenced by anisotropic properties of crystals. The microhardness behavior for the different crystal planes is different for initial smaller value of applied load but the indentation on all these samples resulted in a region where the microhardness is independent of applied load and these are well fitted with the approach of Proportional Specimen Resistance (PSR) model[6] The best correlation between measured values and used models is achieved by using a modified PSR model Work hardening coefficient found to be greater than 1.6 for bismuth wire plate could be concluded that bismuth is soft material and extremely ductile and also suggest that there is a possibility in decrease of wire’s diameter of bismuth. The best correlation between load-independent Vickers microhardness measured values and applied models was achieved in the case of the MPSR.


ISSN: 2321-9653; IC Value: 45.98; SJ Impact Factor: 7.538
Volume 11 Issue III Mar 2023- Available at www.ijraset.com
The author is thankful to Prof. K.C.Poria, Head, Department of Physics, Veer Narmad South Gujarat University for providing the necessary facilities to carried out this work and his inspiration and encouragement.
[1] Anbukmar S, Vasudevan S and Ramasamy P, J. Materi. Sci. Lett. 5, 223 (1984)
[2] Charles J B and Gnanam F D, J. Mater, Sci. Lett. 9, 165 (1990)
[3] Irusan T, Arivuoli D and Ramasamy P, J. Mater.Sci.Lett. 12, 405 (1993)
[4] Kotru P N, Raina K K, Kachroo S K and Wanklyn B M, J. Mater. Sci. 19, 2582 (1984)
[5] Mukerji S and Kar T, Cryst. Res. Technol. 34, 1323 (1999)
[6] H Li and Bradt R C, Mater. Sci. Eng. A142, 51 (1991)
[7] Tabor D, The Hardness of Matels, ( Oxford University Press, Oxford, 1951 )
[8] Onitsch E M, MikroScopie 2 131 ( 1941)
[9] Hanneman M Metallurgia manch. 23, 135 ( 1941)
[10] H Li, Ghosh A, Han Y H and Bradt R C, J. Mater. Res. 8 1028 ( 1993 )
[11] Wooster W A, Widersande and Science Anwendung, Rep. Prog. Phys : 16 62 ( 1953 )

