
10 VII July 2022 https://doi.org/10.22214/ijraset.2022.46061

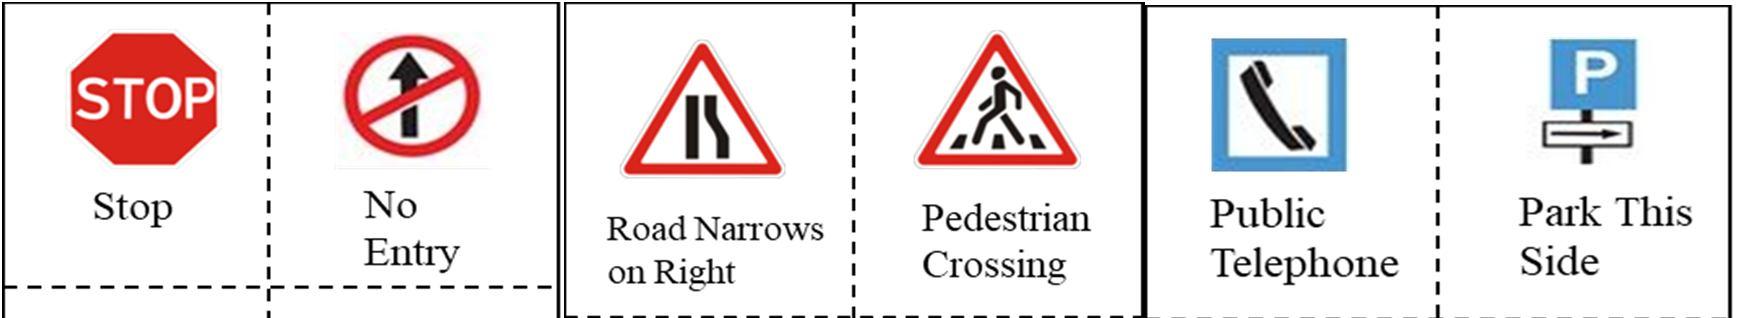
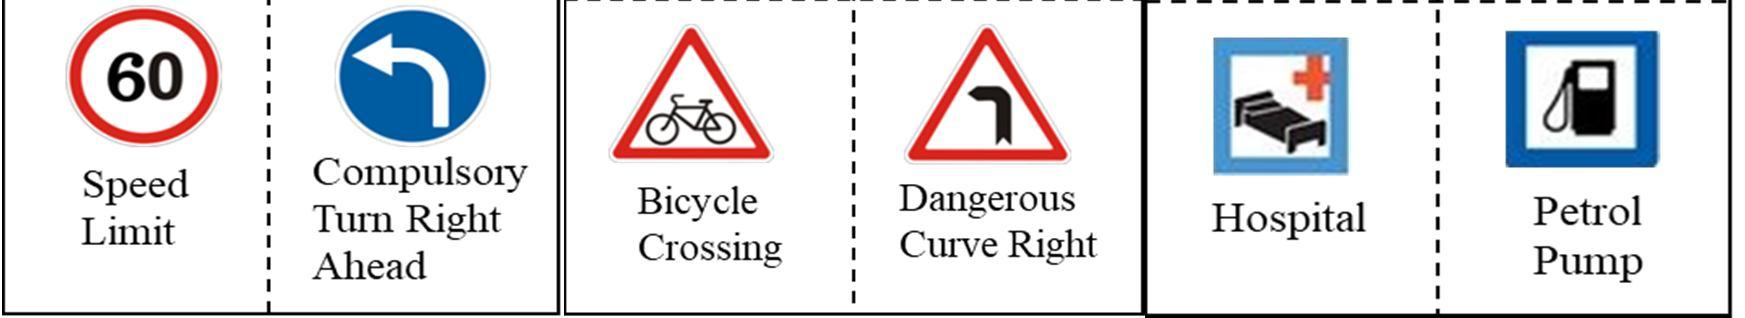
2) Warning/Cautionary signs
1) Generally, Traffic signs are categorized into three groups: Mandatory/Regulatory signs
According to the Ministry of Road Transport and Highways (MORTH) Government of India, the report states that road accidents stood at 1,51,417 in 2018 accounting for 11% of total death in India [8]. This is because the number of automobiles on the road nowadays is increasing exponentially due to travel, transportation, services, etc., and they have become an indispensable part of our daily routines. Rush hour traffic makes it possible for people to miss traffic signs, and occasionally people do this on purpose (by speeding, for instance), which can result in fatal collisions. This may be dealt with by using autonomous cars, which minimize or even eliminates traffic accidents. Visual signals, such as traffic lanes and traffic signs, provide drivers with the most important information about the restrictions and state of the roads across every country. Traffic signs are an essential component of the road infrastructure since they offer diverse information on the condition of the roads, warnings, restrictions, and other valuable information.
Keywords: Traffic sign detection and recognition (TSDR), support vector machine (SVM), Convolutional neural networks (CNN), Histogram of oriented gradients (HOG) I. INTRODUCTION
Rajesh V1, Rajashekar J S2 1PG Student, 2Professor, 1,2Department of EIE Engineering, Dayananda Sagara college of Engineering, Bangalore, India
Abstract: With the expansion in the number of vehicles on the road, the development of technology, and other factors, safety has elevated to the top of automotive industries. Following traffic laws and regulations are essential in Advanced Driver Assistance Systems (ADAS) to prevent collisions. Over the past few decades, traffic sign recognition has gained significant interest due to its quick processing speed and the reduction of human interactions, which lowers risk with the assistance of Artificial Intelligence. While trying to focus on the road, drivers sometimes miss signage on the side of the road, which could be vulnerable for both them and the pedestrians. If the driver could be alerted effectively without having to change their focus, this issue may be avoided. When a sign is detected and recognised, the Traffic Sign Detection and Recognition (TSDR) system alerts the driver to any approaching signs. In addition to ensuring road safety, this also gives drivers a little more comfort while negotiating challenging or unfamiliar roads. This paper provides a comprehensive survey on traffic sign detection and recognition with details of algorithms, architectures, and methods implemented. Based on the investigation of several experts, this literature study was completed and may be used as a future reference.
International Journal for Research in Applied Science & Engineering Technology (IJRASET) ISSN: 2321 9653; IC Value: 45.98; SJ Impact Factor: 7.538 Volume 10 Issue VII July 2022 Available at www.ijraset.com 4801©IJRASET: All Rights are Reserved | SJ Impact Factor 7.538 | ISRA Journal Impact Factor 7.894 |
Literature Review on Vision-based Traffic Sign Detection and Recognition using Artificial Intelligence
3) Informative/Guide signs Fig.1 Mandatory signs Fig. 2 Warning signs Fig. 3 Informative signs


Input image Detection Recognition text/voiceOutputmessage
TemplateSupportNetworksVectorMachinesMatchingRandomForestsOtherMethods
4 Simple
The different techniques of approach in the TSDR (Traffic sign Detection and Recognition) system are shown in Fig.5. In this paper Recognition based on SVM and CNN is illustrated as this is mainly focused on these two techniques because of their reliability and robustness and training of large datasets. These two algorithms are the primary emphasis of this work due to their dependability, robustness, and capacity to train big datasets [6]. (Traffic Sign Detection and Recognition Systems) Colors (Red, Blue, yellow) (Triangle,Circles,hexagon) Hybrid Methods
Block
Fig. 5 Various
approaches.
International Journal for Research in Applied Science & Engineering Technology (IJRASET) ISSN: 2321 9653; IC Value: 45.98; SJ Impact Factor: 7.538 Volume 10 Issue VII July 2022 Available at www.ijraset.com 4802©IJRASET: All Rights are Reserved | SJ Impact Factor 7.538 | ISRA Journal Impact Factor 7.894 |
II. ARCHITECTUREOFTSDRSYSTEM
These signs are designed in a way to stand distinct in the form of colours, and shapes and are easily recognized by the human eye. However, due to the complexity of driving situations, passing vehicles, structures, and plants along the roadside frequently interfere with the detection and recognition of traffic signs. To properly judge the next driving manoeuvre, neither the driver nor the vehicle vision system can accurately interpret the meaning of traffic signs. Because of this, researchers have developed various techniques for real time traffic sign recognition.
Recognition
Recognition Neural
The two modules for traffic sign detection and recognition are detection and recognition. The image is initially taken at a specific distance and pre processed to remove extra noise and data. To locate the traffic signs, the picture is subjected to colour transformation and shape analysis in the detection module. The recognition step receives the output from the preceding module and extracts the Region of Interest (ROI) and categorises it using the system's database. The output of this module starts with a text message or audio alert telling the driver what the traffic sign means and instructing them to react appropriately.
TSDR
Shape
Detection
Fig. Traffic Sign System Diagram. traffic sign detection and recognition


B. HOG Feature Descriptor
A. Support Vector Machine (SVM)
International Journal for Research in Applied Science & Engineering Technology (IJRASET) ISSN: 2321 9653; IC Value: 45.98; SJ Impact Factor: 7.538 Volume 10 Issue VII July 2022 Available at www.ijraset.com 4803©IJRASET: All Rights are Reserved | SJ Impact Factor 7.538 | ISRA Journal Impact Factor 7.894 | III.DIFFERENTTECHNIQUES
Fig 6: Graphical representation of separation of two datasets In the graphic above, data points on H1 and H2 are called support vectors. The hyperplane which separates the data to their classes by defining the decision surface is of the form: w Tx+b=0 xi is the input sample feature x1, x2…xn; and outputs result y (yi ∈ { 1,1}) which have the values "1" for one class and " 1" for the other; w is the weight vector; |b|/||w|| is the hyperplane's perpendicular distance from the origin; and ||w|| is the hyperplane's Euclidean norm, b is bias. H1 and H2 are the planes which are defined by: H1: w T*xi+b =+1, H2: w T*xi+b = 1. The datapoints on the planes H1 and H2 are the tips of the support vectors which lie closest to the decision surface (hyperplane) The restrictions are valid for separable: yi(xi *wT +b) 1≥0 ∀ i. (1) Both hyperplanes H1 and H2 include these locations. By minimising ||w||2/2 under the restrictions of (1) the hyperplane, the largest geometric separation between the margins of two data sets is computed [9]. Kernel functions can help classify the data when the data points are non linear and unable to be separated by a linear plane. Because of its kernel, which transforms the input data space into a higher dimensional space, SVMs are also known as kernelized SVMs [1].
Gradient Magnitude (Gx) = + … (2) Gradient direction (Gy) = …(3) Nine bins are used to quantize the gradient directions. Using the data obtained from (2) and (3), each pixel in the cell will compute the values in the bins. This will form an array of 9x1 dimension for each patch in the image. Create a pixels per cell of size 8x8 and cells per blocks by joining four cells together. Now the histogram’s length is 9x4=36. Since the blocks are constructed without any overlap, there will be a total of 7x7=49 blocks in the image. As a result, the feature vector's length is 7x7x9x4=1764. H1 H H0
The fundamental task of the SVM is to find a hyperplane in an n dimensional space that divides the data points into their respective classes. The data points and the hyperplane should be as wide apart as is practical. Maximizing the margin distance adds some support, increasing the confidence with which future data points may be categorised. Support vectors refer to the data points that are closest to the hyperplane. Due to their proximity to one another, they have a bigger influence on the precise location of the hyperplane than other data points.
The Histogram of Oriented gradients is a feature descriptor used in image processing for the purpose of object detection. This is done by extracting the magnitude and directions based on the structure or shape of the localized image. Histogram is generated for this region of the image using both magnitude and orientation. For example, consider an image of size 64x64 pixels.
Calculation of the gradient: small change in the X and Y directions of the pixel values is the gradients. Consider Gx and Gy are the gradients along X and Y direction respectively.


The creation of any TSR system requires the use of the traffic sign database. It is employed for developing, training, testing, assessing, and validating models. Large numbers of traffic signs representing all categories with intricate scenarios and imagerymay be found in the database. Table 1 lists some of the widely used datasets that are freely accessible to the scientific community [6]. Used (Laboratory Layer Basic three layers of CNN
International Journal for Research in Applied Science & Engineering Technology (IJRASET) ISSN: 2321 9653; IC Value: 45.98; SJ Impact Factor: 7.538 Volume 10 Issue VII July 2022 Available at www.ijraset.com 4804©IJRASET: All Rights are Reserved | SJ Impact Factor 7.538 | ISRA Journal Impact Factor 7.894 | C. Convolutional Neural Networks (CNN)
for Intelligent and Safe Automobiles Dataset) 2012 US 47 Input Layer Hidden
TABLE I Widely
Output Layer Fig 7:
Traffic Sign Databases No. Dataset Year Country Classes 1. GTSRB (German Traffic sign Recognition Benchmark) 2013 Germany 43 2. GTSDB (German Traffic sign Detection Benchmark) 2012 Germany 43 3. KULD (Katholieke Universiteit Leuven Dataset) 2009 Belgium 62 4. LISAD
IV.DATABASE
A form of Deep Learning technology, convolutional neural networks can take in an input image, give significance (learnable weights and biases) to distinct components and objects in the image, and be able to distinguish between them. Convolutional neural networks are highlygood at identifying the patterns in the input picture, such as lines, gradients, circles, or even eyes and faces. This characteristic makes convolutional neural networks very useful for computer vision. In contrast to more traditional computer vision techniques, convolutional neural networks may start working on a raw picture right away and do not need any prior processing. Convolutional neural networks' strength comes from the convolutional layer, a special kind of layer [10]. It typically has three layers: input, hidden, and output. The input layer is made up of the input image's pixel matrix. Convolutional layers are frequently followed by activation layers, some of which are then followed by pooling layers, as the hidden layers. The number of layers in the concealed layer depends on how complicated the problem is. The output layer, which is a fully linked layer, flattens and sends the input from the preceding levels to turn the output into the necessary number of classes for the network.


Recently, there has been an increase in interest in creating effective and trustworthy TSDR systems. To find papers published in journals that are indexed in the Scopus database and to limit the search to the last ten years, a basic search for "traffic sign detection and identification" has been conducted to demonstrate the present level of scientific study on this issue (2009 2018). Figure 3's Citation Trends illustrate the comparatively quick growth rate, with citations increasing by 60.34% between 2016 and 2018 [6]. Fig 9: Citation trends in TSDR system. A. T. Guofeng, et al. (ICIEA, 2017). “Traffic Sign Recognition Based on SVM and Convolutional Neural Network”. [1] The technique in this research was broken down into three stages: a) HSV colour space conversion b) Localizing traffic signs using HOG and SVM; c) classifying using enhanced CNN. Conversion to HSV colour space is the first step since this colour model performs better under varying lighting conditions and is more in line with how humans understand data [2]. By adjusting the threshold values of the H and S components, the red, yellow, and blue are transformed into binary pictures. This makes it easier to obtain ROIs for the image by eliminating extraneous noise.
27 129 175 334 364 500 618 757 1181 13291400120010008006004002000 2009 2010 2011 2012 2013 2014 2015 2016 2017 2018 CitationsofNumbers Year
International Journal for Research in Applied Science & Engineering Technology (IJRASET) ISSN: 2321 9653; IC Value: 45.98; SJ Impact Factor: 7.538 Volume 10 Issue VII July 2022 Available at www.ijraset.com 4805©IJRASET: All Rights are Reserved | SJ Impact Factor 7.538 | ISRA Journal Impact Factor 7.894 | Fig 8: Examples of traffic scenes in KULD database V. RESEARCHTRENDSONTRAFFIC SIGNDETECTIONANDRECOGNITION
VI. LITERATURESURVEY

In the last phase, the author suggests classifying data using an upgraded CNN model and provides four layers: Input, Convolution, Pooling, and Classifier. The CNN receives an RGB image matrix as its input rather than a grayscale value of the pixel since doing otherwise would waste data. GTSDB and GTSRB are the datasets utilised in this study for the training and testing of 43 types of traffic signs. The experimental is suggested for indication signs, prohibition signs, and warning signs. The results obtained were 94.33%, 97.44%, and 96.47%, respectively. The proposed algorithm's overall accuracy rate is 99.21%, with an average picture processing time of fewer than 10 milliseconds.
In this study, the author suggested two stage systems detection and recognition which were analysed and tested using publicly accessible Belgian Dataset and German dataset. Because Hue Saturation Value (HSV) processes images similar to how humans do and because it has a wide spectrum of colours, it is used in the detection phase. The following phase is locating the prospective traffic sign based on colour and determining its shape. Red signs are carefully reviewed in colour based identification, and if they meet a particular threshold, that area is checked to see if they are traffic signs. The author concentrated on two shapes, namely the circle and triangle, for shape based detection. It makes use of the Douglas Peucker algorithms. This algorithm counts the edges and locates contour regions; if they meet the minimal requirement, bounding boxes are generated to demarcate the intended region. By using image thresholding and inversion filter, this sign is verified and moved on to the next phase. In the recognition phase, the author used the CNN feed forward neural network which consists of six convolutional layers and has dropout layers in between the fully connected hidden layers to prevent overfitting. They employed a trio of CNNs in an ensemble to increase accuracy. Each of these CNNs is trained using weights that are initialised at random. The outputs of each of these three CNNs are eventually averaged to create a single ensemble model. To train this model effectively and save training time, it would be beneficial to train all these models simultaneously. Overall train sets for triangles and circles were 10582 and 16106 images. Similarly, the test sets were 3456 and 5277 images respectively When put to the test, they scored 98.11% accuracy for triangles and 99.18% accuracy for circles C. Sudha S. K, et al. (IJERT, 2016). “A Real Time System for Detection and Recognition of Traffic Signs”. [3]
D. Hasan, et al. (ICICCT, 2020). “Traffic Sign Recognition System (TSRS): SVM and Convolutional neural Network”. [4] The author of this study explains in detail how to localise traffic signs using SVM and classify them using CNN. The real time dataset was initially built by cropping the region around the traffic signs in the video frames. To propose CNN and SVM models, they split the entire dataset into training and validation, each with 1200 images. They have considered 12 different traffic signs and each class has 100 images. Grayscale images are created by first applying a colour transformation to RGB images.
The HOG feature vector of the ROI is extracted in the following phase and sent to the SVM classifier, which will determine if it is a traffic sign. In this case, they employed a histogram of nine bin oriented gradients, which implies that the gradient direction of the cell, which is 360o, is divided into nine orientations. HOG of the cell is obtained by utilising weights of gradient direction in the histogram. Later, each cell unit is joined in series to form a large, continuous block to get a 9 dimensional feature vector of the corresponding cell. By doing this, the HOG feature vector of ROI is derived, which further categorises it as a probable traffic sign.
International Journal for Research in Applied Science & Engineering Technology (IJRASET) ISSN: 2321 9653; IC Value: 45.98; SJ Impact Factor: 7.538 Volume 10 Issue VII July 2022 Available at www.ijraset.com 4806©IJRASET: All Rights are Reserved | SJ Impact Factor 7.538 | ISRA Journal Impact Factor 7.894 |
B. A. Vennelakanti, et al. (ICCE, 2019), “Traffic sign detection and recognition using a CNN Ensemble”. [2]
The author presented the technique in this research in two stages, Detection and Recognition. It contains layers for image capture, pre processing, detection, and classification, the author further clarifies. In the detection phase, 720p images are recorded from the moving car's roof at a predetermined frames per second rate. The visibility of the traffic sign is impacted by variations in lighting and weather. To reduce noise, the Weiner filter and Gaussian noise are utilised. Then, RGB is converted to YCbCr, where Y stands for chrominance information, the difference between the blue component and a reference value is represented by Cb, the difference between the red component and a reference value is represented by Cr Red and blue colour objects are retrieved using the threshold approach, and all stray pixels are separated using an adjusted morphological process. In this case, the author concentrated mostly on four shapes: triangle, rectangle, circle, and octagon. The candidate object is chosen using a shape based analysis. If there is a discrepancy in similarity between the colour segmented sign and the template database greater than the threshold value, the sign is recognised as a traffic sign A pictogram threshold is used in the sign recognition stage. All pixels are divided into white and black pixels, depending on whether they are above or below the threshold value. Traffic signs are therefore retrieved from the pictograms inside and used for classification using neural networks. For classification, the model employs a multilayer feed forward CNN, and the network applies a backpropagation learning technique to train multiple layers. The primary function of the classification module is to assign the appropriate category of traffic signs to the extracted regions of interest that are supplied as input.
International Journal for Research in Applied Science & Engineering Technology (IJRASET) ISSN: 2321 9653; IC Value: 45.98; SJ Impact Factor: 7.538 Volume 10 Issue VII July 2022 Available at www.ijraset.com 4807©IJRASET: All Rights are Reserved | SJ Impact Factor 7.538 | ISRA Journal Impact Factor 7.894 |
The Region of Interest (ROI) is more competently refined in the second step based on the management of shape. The next stage is feature extraction using the HOG descriptor to train the SVM classifier. Here they rescaled the image to 32x32 pixels and employed a 9 bin histogram for the HOG feature vector. The SVM model will validate that it is a traffic sign. If a traffic sign is present, it will be processed further by the CNN model, which will classify it and label the sign using a bounding box. Convolutional, pooling, and fully connected layers are listed by the author as the CNN model's layers. The Rectified linear activation function was employed in this study to train the CNN model since it outperforms the competition in a variety of scenarios. They achieved 96.40% validation accuracy in the CNN model and 98.33% accuracy for SVM classification during the training procedure with 80:20 data split ratio. They created a system with real time video and tested it to assess the outcomes.
[2] Aashrith Vennelakanti, et al. (IEEE Access, 2019). “Traffic sign detection and recognition using a CNN Ensemble”
( ) = ∗ (4) By comparing the output error with the predicted outcomes using the backpropagation technique, the weights are modified each time the data is analysed. Seven circular and thirteen triangular classes out of a total of 21 classes were trained, with 70 photos for each class considered. The detection rate of the experiment's real time data, which was recorded at three separate times during the day (morning, afternoon, and evening), was 82.94%, 90%, and 89.41%. They attained 97.14% and 95.71% accuracy for circular and triangular, respectively, at an average frame rate of 15 to 26 frames per second.
With the improved CNN model, it has a high recognition accuracy. Due to its great degree of shape reliability, any shape deviations result in categorization errors.
E. M. Swathi, et al. (RTEICT, 2017), “Automatic Traffic sign Detection and recognition in Video Sequences”. [5]
[1] Tong Guofeng, et al. (IEEE Access, 2017). “Traffic Sign Recognition Based on SVM and Convolutional Neural Network”
This algorithm is mostly influenced by colour, and variations in lighting have an impact on the model. Since template matching is used, it will be difficult to see traffic signs from varied angles.
The detection and recognition stages of the system are divided into two fundamental categories by the author of this work. The detection step is separated into three sections: colour reformation from RGB to HSV, colour segmentation, and shape recognition. To separate the chromatic and achromatic components and make them resistant to changes in illumination, the image frame is first retrieved from the video sequence using ROI and transformed to HSV colour space. By removing the distracting backdrops, the search area in the image sequences is reduced and the traffic sign is segregated. The following phase was using the Douglass Peucker method algorithm, a contour approximation technique frequently used for Shape identification. The author primarily focused on two shapes, triangles and circles. If the total number of lines obtained is 3 and 8 in the final curve, then it is categorized as triangle and circles respectively. Because it is based on lines and curves, it functions well for traffic signals with certain geometric aberrations. With the HOG feature extracted, a multi layer feed forward neural network is used to classify traffic signs during the recognition phase. The recognized traffic sign is rescaled to 24x20 pixels and by gradient computation HOG feature vector of length 1080 is obtained. The input, hidden, and output layers of a multi layer perceptron design each include a set of nodes that are coupled to the preceding node with certain weights. The activation function in this design is nonlinear, except for the input layer. The sigmoid function described in (4) is the activation function utilised in this design.
In challenging scenarios, the suggested method has a high detection rate. This may be used in actual world situations in several nations.
[3] Sudha S.K, et al. (IJERT, 2016). “A Real Time System for Detection and Recognition of Traffic Signs”
TABLE II Reflection Note Of Literature Survey Paper Author and Year Title Reflections
[4] Hasan, N.; Anzum, T.; Jahan, N. Traffic Sign Recognition System (TSRS): SVM and Convolutional Neural Network. In Inventive Communication and Computational Technologies (ICICCT); Springer: Singapore, 2021; pp. 69 79 [5] M. Swathi and K. V. Suresh, "Automatic traffic sign detection and recognition in video sequences," 2017 2nd IEEE International Conference on Recent Trends in Electronics, Information & Communication Technology (RTEICT), 2017, pp. 476 480, doir: 10.1109/RTEICT.2017.8256642.
Volume
VII. CONCLUSIONS
[1] T. Guofeng, C. Huairong, L. Yong and Z. Kai, "Traffic sign recognition based on SVM and convolutional neural network," 2017 12th IEEE Conference on Industrial Electronics and Applications (ICIEA), 2017, pp. 2066 2071.
The geometric distortions of traffic signs and variations in lighting are well detected by this model. As a result, it may be improved and tested at night for the detection of traffic signs.
[3] Sudha S. K., Mahathi L, 2016, A Real Time System for Detection and Recognition of Traffic Signs, INTERNATIONAL JOURNAL OF ENGINEERING RESEARCH & TECHNOLOGY (IJERT) NCETET 2016 (Volume 4 Issue 17)
ISSN: 2321 9653; IC Value: 45.98; SJ Impact Factor: 7.538 10 Issue VII July 2022 Available at www.ijraset.com All Rights are Reserved | SJ Impact Factor 7.538 | ISRA Journal Impact Factor 7.894 |
[2] A. Vennelakanti, S. Shreya, R. Rajendran, D. Sarkar, D. Muddegowda and P. Hanagal, "Traffic Sign Detection and Recognition using a CNN Ensemble," 2019 IEEE International Conference on Consumer Electronics (ICCE), 2019, pp. 1 4.
International Journal for Research in Applied Science & Engineering Technology (IJRASET)
[9] S. Maldonado Bascon, S. Lafuente Arroyo, P. Gil Jimenez, H. Gomez Moreno and F. Lopez Ferreras, "Road Sign Detection and Recognition Based on Support Vector Machines," in IEEE Transactions on Intelligent Transportation Systems, vol. 8, no. 2, pp. 264 278, June 2007.
[10] Y. Sun, P. Ge and D. Liu, "Traffic Sign Detection and Recognition Based on Convolutional Neural Network," 2019 Chinese Automation Congress (CAC), 2019, pp. 2851 2854.
[5] Swathi M, et al. (IEEE Access, 2017). “Automatic Traffic sign Detection and recognition in Video Sequences”
[7] Glory Reuben Maxwell and Dr.Dinesh D.Patil, “A review on traffic sign detection and recognition system”, International Research Journal of Engineering and Technology (IRJET) 2020 (Volume 7 Issue 05) [8] https://morth.nic.in/sites/default/files/Road_Accidednts.pdf
[6] Wali, Safat B., Majid A. Abdullah, Mahammad A. Hannan, Aini Hussain, Salina A. Samad, Pin J. Ker, and Muhamad Bin Mansor. 2019. "Vision Based Traffic Sign Detection and Recognition Systems: Current Trends and Challenges" Sensors 19, no. 9: 2093.
Researchers would like to thank their colleagues for their excellent contributions and discussions on the above mentioned topics.
4808©IJRASET:
VIII. ACKNOWLEDGMENT
REFERENCES
[4] Nazmul Hassan, et al. (ICICCT, 2020). “Traffic Sign Recognition System (TSRS): SVM and Convolutional neural Network” Only 12 classes were considered for the suggested approach, which has good accuracy. Instead of using a built in system for testing, a few more classes might be added and evaluated in complicated real time settings.
The main objective of this study is to categorize the prime approaches into sections to make the concept easily understandable and to give a comprehensive review of different methods available for traffic sign detection and recognition; including along with database and research trends associated with TSDR systems [6]. In this paper, the detection of traffic signs using colour and shape based on different techniques was explored. This study suggests that support vector machine and convolutional neural network based methods were found most efficient and used because they have a high rate of detection, are very flexible, and are simple to adopt. [2] With the aid of new datasets from other nations, the total performance might be enhanced and tailored.