
10 IX September 2022 https://doi.org/10.22214/ijraset.2022.46917

Hemant Kumar1 , Anand Kumar Khatri 2

1, 2P.G. Department of Zoology, Laboratory of Environmental Biology, Govt. Dungar College, Bikaner (Rajasthan), Abhinav College, Nagaur. (Rajasthan)

Abstarct: Geographically Bikaner has four natural slopes, one towards the vallabh garden area, where the three anaerobic and two aerobic stabilization ponds of sewage treatment plant are situated in the North West part of the Rajasthan. The Thar desert lies which is characterized by typical arid conditions like scarcity of water, low rainfall, intense radiations, violent winds, high temperature fluctuations and dust storms. This paper is based on the chemical limnological study of three anaerobic and two aerobic stabilization ponds of sewage treatment plant. The study was carried out for a period of 15 months from March 2010 to May 2011. The chemical parameters measured include pH, EC (electrical conductance), TDS (total dissolve solids), and Free CO2. The parameters of three anaerobic stabilization ponds of water was ranged pH (6.7 to 8.2), EC (1.5 mmhos/cm to 2.0 mmhos/cm), TDS (960 mg/l to 1280 mg/ l), Free CO2 (172 mg/l to 294 mg/l) and two aerobic stabilization ponds of water was ranged pH (7.3 to 8.4), EC (1.3 mmhos/cm to 1.8 mmhos/cm), TDS (832 mg/l to 1152 mg/ l) and Free CO2 (152 mg/l to 270 mg/l) were recorded.
Keywords: Sewage treatment plant, anaerobic and aerobic stabilization ponds, chemical parameters.
Sewage is the waste water used by community, includes household waste liquid from toilets, baths, showers, kitchens, sinks, soap and detergents. Their chemical composition varies from day to day and even from hour to hour and also from area to area because waste produced by different areas has different characters. Heavy accumulation of sewage and other waste in water bodies because of uncontrolled dumping of wastes of rural areas, towns and cities into ponds, lakes, streams and in rivers cause loss of self regulatory capability and failing of recycling mechanisms of these water bodies due to higher levels of pollution and low level of aerobic microbes. In the recent past, several studies [1],[2],[3],[4] have reported that receiving water bodies are becoming increasingly contaminated due to discharge of domestic (sewage) and industrial waste waters. Sewage system of which handled both storm water and domestic discharge are known as combined systems. Now a days combined sewage system are avoided because heavy rainfall reduced the sewage treatment plant efficiency.
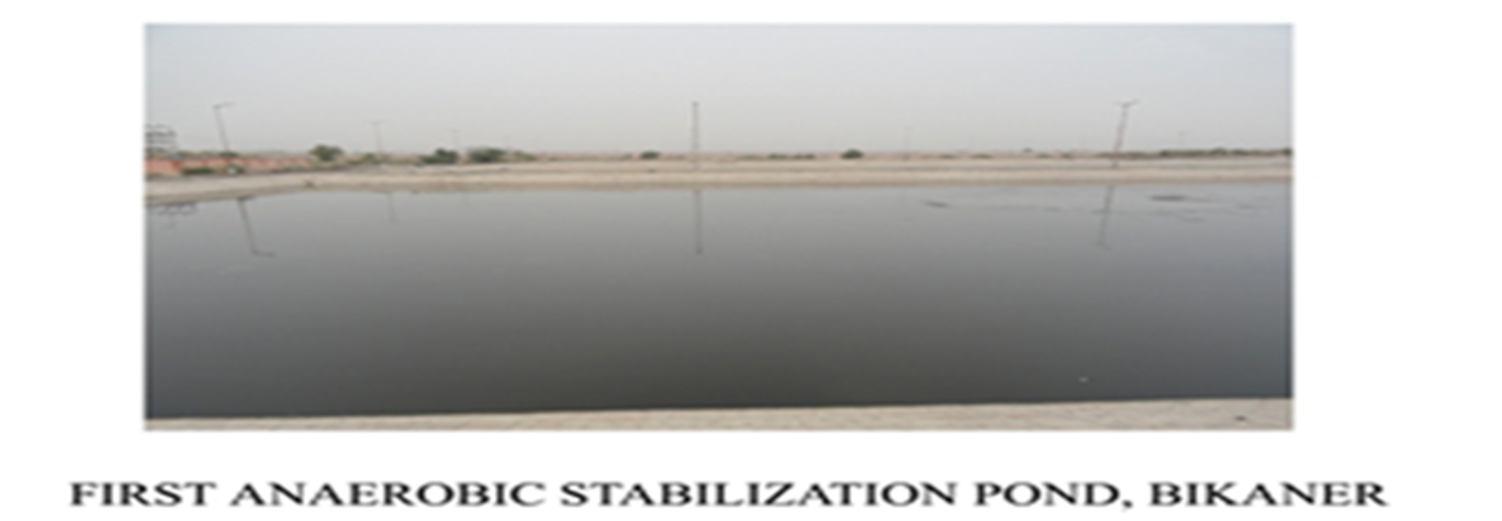
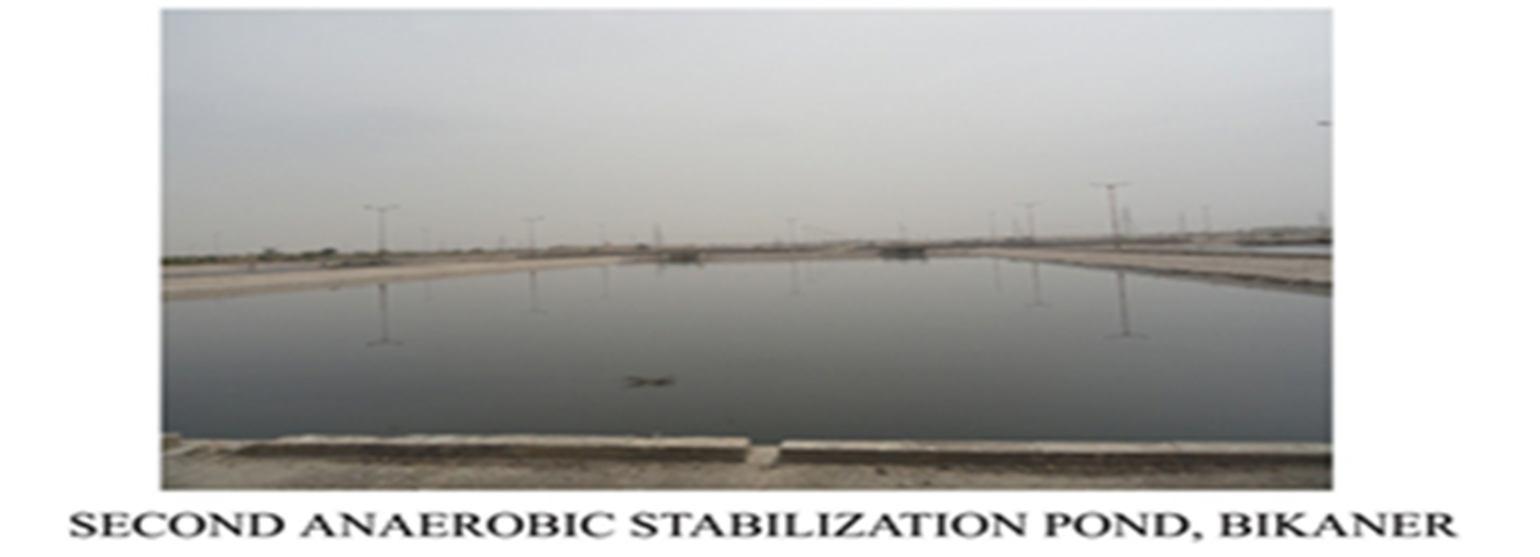
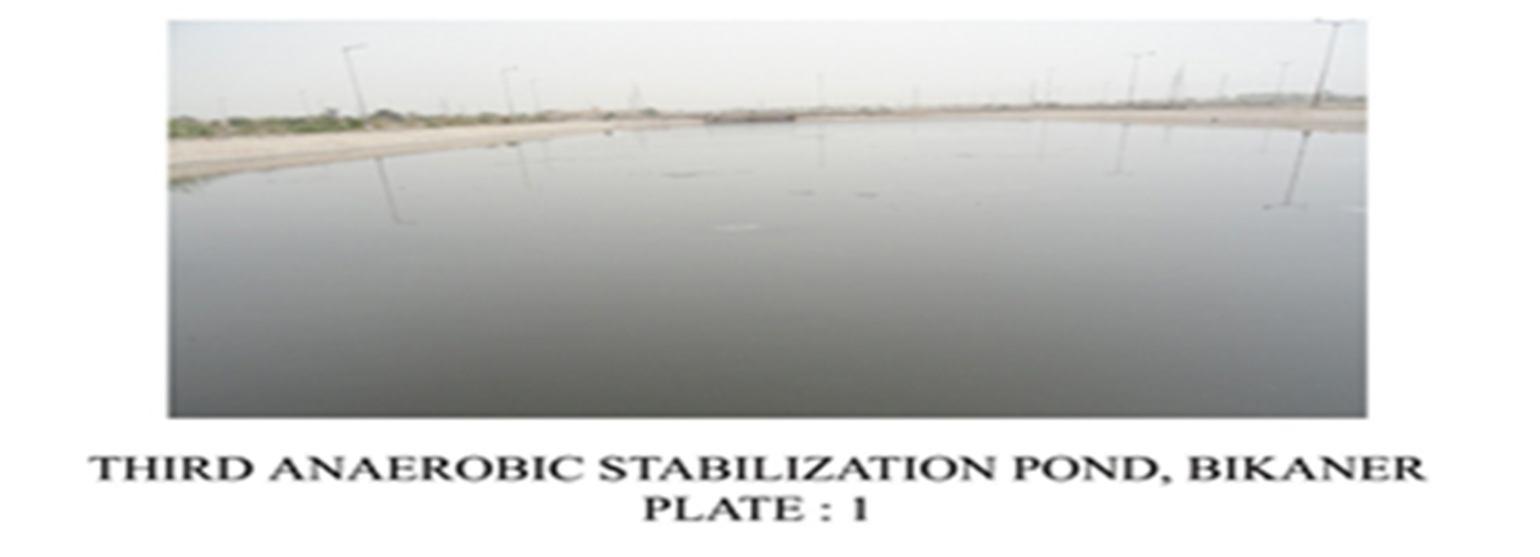
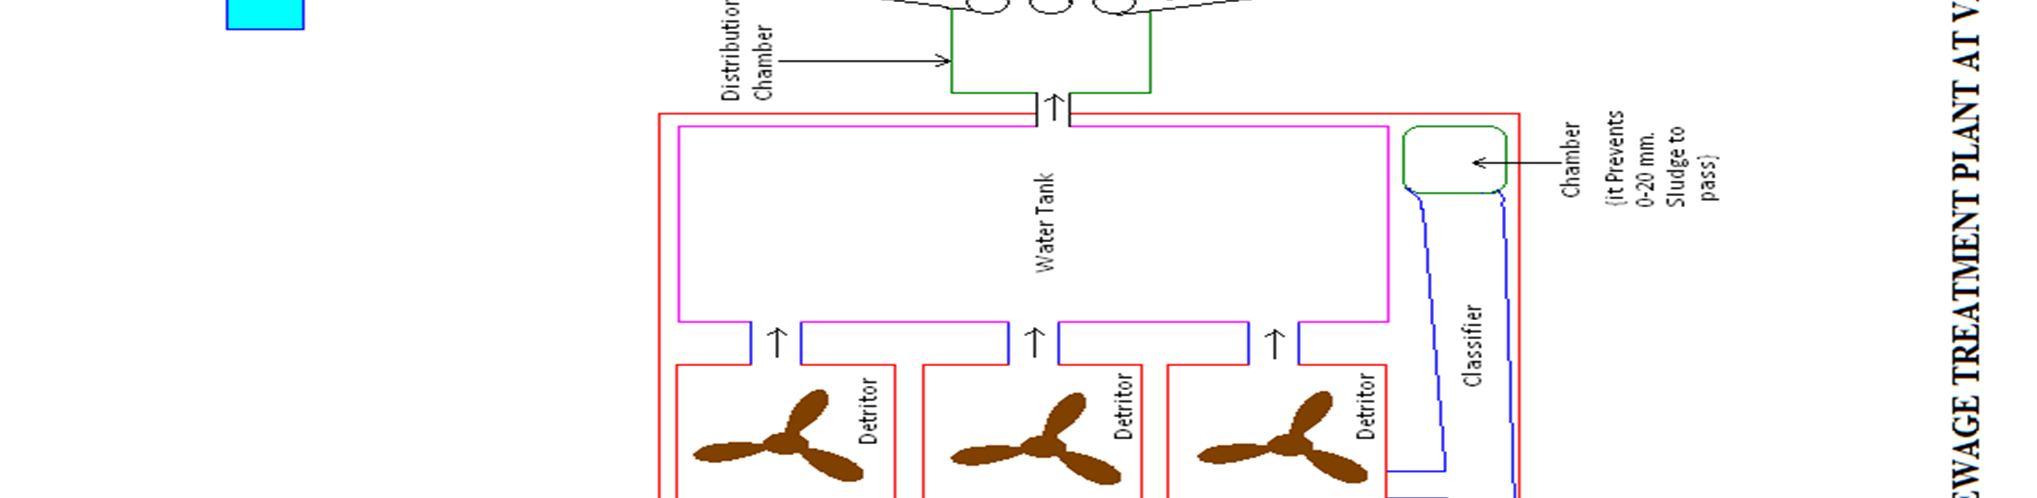
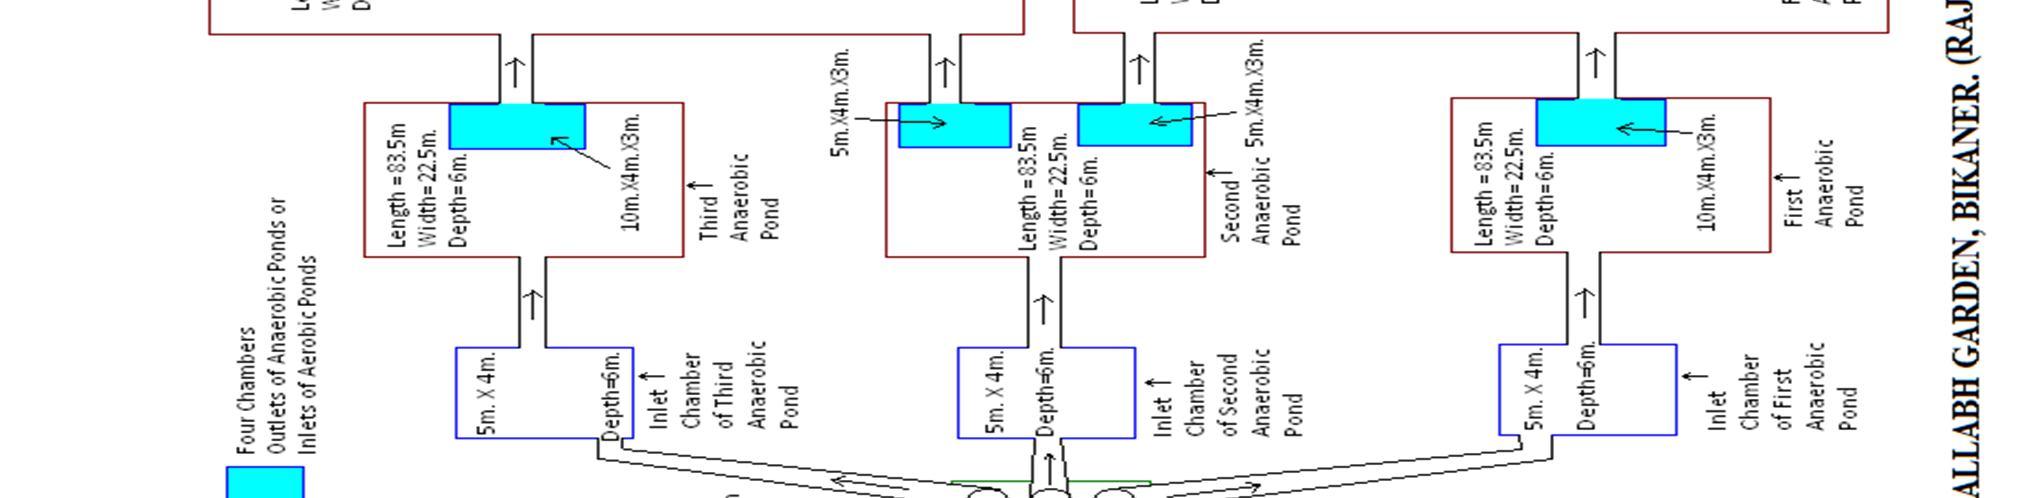
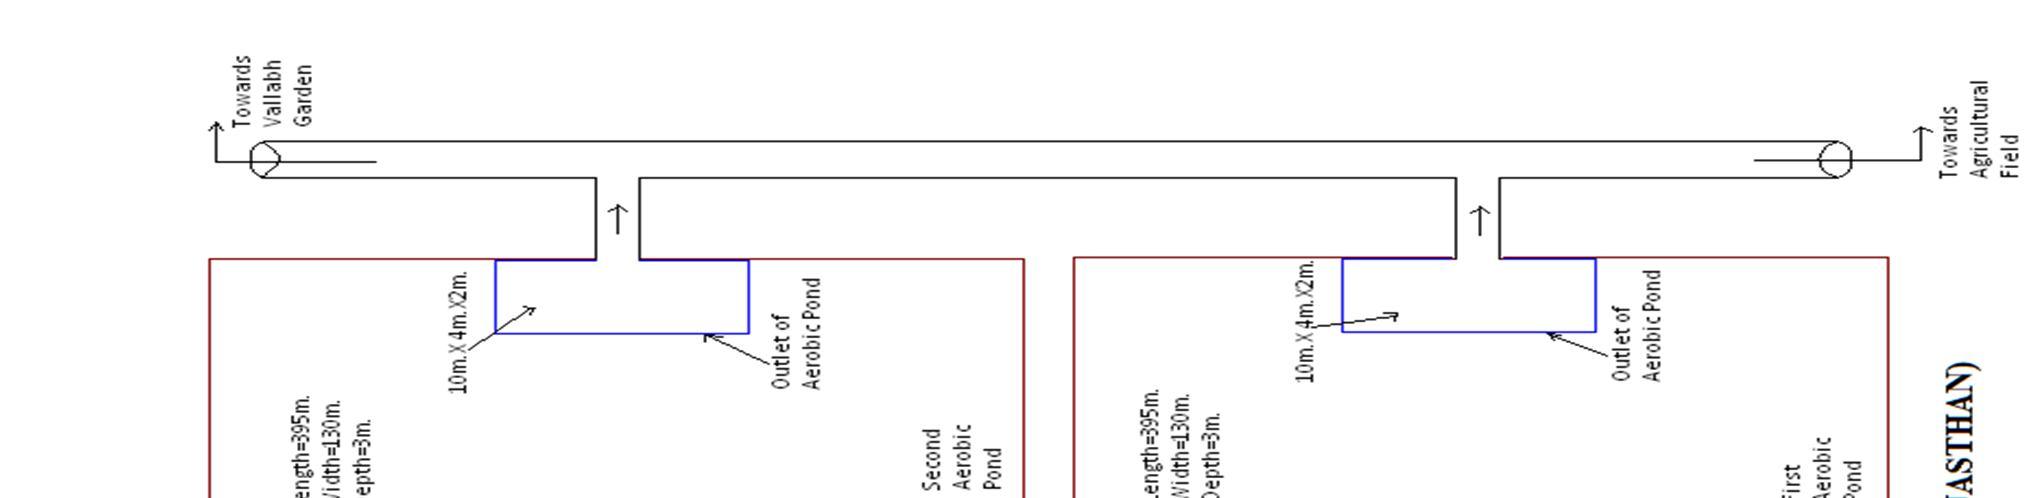
The study was carried at two types of water bodies situated about 6 Km. south of Bikaner district at sewage treatment plant of Vallabh Garden. The sewage stabilization ponds situated in sequence of deep anaerobic and shallow aerobic ponds hold the sewage water with the varying degree of pollution load, particularly the organic one. These included three anaerobic stabilization ponds (Plate 1) and two aerobic stabilization ponds (Plate 2). The flow chart of sewage treatment plant is shown in Fig. 2.


ISSN: 2321 9653; IC Value: 45.98; SJ Impact Factor: 7.538 Volume 10 Issue IX Sep 2022 Available at www.ijraset.com

The sewage water samples were collected from the pond with the help of plastic bucket. The pH and EC were noted at the site itself. pH and EC of the water were noted by the portable electronic pH meter and EC meter respectively.
For the analysis of other parameters water samples were collected in dully labelled polythene bottles, and were brought to the laboratory and kept in the refrigerator for analysis.
For analyzing free CO2 water samples were titrated against sodium hydroxide using phenolphthalein as indicator.
The pH of all five stabilization ponds of sewage treatment plant, during the study period shows that the anaerobic stabilization ponds were slightly acidic in some months as 6.7 to 6.9 in July 2010 to Sept. 2010 although it was basic in remaining months. While of aerobic stabilization ponds water seems alkaline and ranging between 7.3 to 8.4. The highest values of pH were recorded as 8.4 in the month of June 2010 in both aerobic stabilization ponds.
Technology (IJRASET
ISSN: 2321 9653; IC Value: 45.98; SJ Impact Factor: 7.538
10 Issue IX Sep 2022 Available at www.ijraset.com
its value ranging between 1.5 to 2.0 mmhos/cm. In aerobic stabilization ponds it ranges between 1.3 to 1.8 mmhos/cm. The highest value during the study period was observed in second anaerobic stabilization ponds in Jan. 2011 while it seems lowest in both aerobic stabilization ponds in month of Oct. 2010. Total dissolve solids (TDS) were noticed as ranging between 960 to 1200 mg/l. in three anaerobic stabilization ponds of sewage treatment plant. As tables show the values were lower in aerobic ponds as 832 to 1152 mg/l. in compare anaerobic stabilization ponds highest 1280 mg/l. value was recorded in Jan. 2011 in all the three anaerobic stabilization ponds while it was lower as 832 mg/l. in Oct. 2010 in both aerobic stabilization ponds. In stabilization ponds of sewage treatment plant, as per free CO2 concern, it was recorded highest as ranging 172 mg/l. to 292 mg/l. in all three anaerobic stabilization ponds. It noted lowest as 152 mg/l. to 269 mg/l. in two aerobic stabilization ponds. In March 2010 it was lowest as 152 mg/l. in both aerobic stabilization ponds while it was highest in month of Nov. 2010 at second anaerobic stabilization pond
per EC concerned all three anaerobic
Table1.
sewage treatment plant, Bikaner during March
plant, Bikaner during
Technology (IJRASET
ISSN: 2321 9653; IC Value: 45.98; SJ Impact Factor: 7.538 Volume 10 Issue IX Sep 2022 Available at www.ijraset.com
The sampling was carried out during March 2010 to May 2011, overlapping the seasons, from sewage treatment plant. The values or data of these three anaerobic and two aerobic stabilization ponds have considerable difference.
All the five stabilization ponds (three anaerobic and two aerobic) have smelly, turbid sewage water while in aerobic stabilization ponds, it was less smelly and turbid in compare to anaerobic stabilization ponds. All the five stabilization ponds held most of time alkaline sewage water with a pH ranging 6.7 to 8.4. The slightly acidic pH was present only in all three anaerobic stabilization ponds (in few months). While in both aerobic stabilization ponds it was always alkaline. The pH was lowest during monsoon and seems greatest during summer, it is just because of high salt concentration during summer while greater decomposition activity during monsoon. The high range of pH may be due to mixing up of the alkaline chemicals, soap and detergents etc. produced due to industrial, residential and commercial activities. This was also noticed by the [5] in Morana river. The rise and fall in pH seems directly linked with concentration and dilution of alkali ions particularly carbonate [6].
The higher concentration of salts in solution, higher will be the electrical conductance (the reciprocal of resistance). In anaerobic stabilization ponds of sewage treatment plant, EC was noted between 1.5 to 2.0 while in aerobic stabilization ponds 1.3 to 1.8 mmhos/cm. which means there is a slightly higher ion in anaerobic stabilization ponds in compare to aerobic stabilization ponds as it is situated after previous one.
EC values goes down in monsoon season due to extra addition of water (dilution). According to our chemical variable tables which also shows that the cations, anions and nutrients are have higher value in anaerobic stabilization ponds with compare to aerobic stabilization ponds [7] also noticed almost equal value of EC in waste stabilization ponds of Yazd (Iran). However, It is generally observed that the salinity, as reflected from EC and TDS, fluctuates greatly over the year depending upon dilution and concentration phenomena which are highly pronounced in the desert waters characterized by shallow column and exposed to high temperature and thus marked evaporation.
Since EC is a measure of electrolytes dissolved in water, it was directly related with total dissolved solids (TDS) as also noted in the studies [8] [6].
Total dissolve solids in anaerobic stabilization ponds fluctuates in between 960 to 1200 mg/l. which was very high in compare to fresh water found in desert [6] while in aerobic stabilization ponds it seems lower as ranges between 832 to 1152 mg/l. The total dissolved solids of the drinking, borewell and sewage water were compared by [9] from three different places of Sivakasi and were within the permissible limit as per ISI (1000 mg/l). Soni et al. (2009) [10] also were noted high TDS value in sewage water in suawn nala Balarampur city.
In all three anaerobic stabilization ponds of sewage treatment plant, no oxygen found in during our research period and only a few amount of dissolve oxygen were present in both aerobic stabilization ponds which might be due to mixing of that from open water surface and some flora present in that ponds. As sewage stabilization ponds are shallow in nature, a greater influence of temperature and salinity were also noted by [11] [6] in fresh water ponds. The dissolve oxygen content were also absent in the sewage water of Sivakasi which was observed by [10] and it was fewer in amount in sewage water of Suawn nala of Balrampur city as noted by[10]. In municipal sewage water, due to high level organic matter, free oxygen value decreases, while biological oxygen demand (BOD) and Free CO2 values increases. In our present study the Free CO2 was also noted as high in anaerobic (average 258.5 mg/l.) as well as aerobic stabilization ponds (224.5 mg/l). It was also recorded high as 56 to 108.0 mg/l. Soni et al., 2009 [10] at Suawn nala which carrying industrial and sewage effluent of Balrampur city. High amount of Free CO2 were reported by [9] as 624.8 mg/l. in sewage water of Sivakasi.
[1] Manas, C. (1976). Water pollution in textile, leather and paper industry water. Ind Chem. Man., 14(3): 13 14.
[2] Kundra, R. Purthy S., (1979). Sugar industry and pollution. In : Deshbandhu R, Bharatdwaj, V. (eds) Ecology and development. Indian Env. Soc., New Delhi. pp. 178 190.
[3] Handa B.K. (1981). Hydrochemistry, water quality and water pollution in U.P. Tech Report Central Ground Water Board (CGWB), Ministry of Irrigation.
[4] Krupanidhi, K.V. J.R., (1984). Mechanism of Ground water pollution in village wells. J. Geol Soc., India 25: 301 302.
[5] Musaddiq, M. (2002). Surface water quality of Morna river at Akolaa. Pollut. Res., 19(4), 685 691.
[6] Khatri, A.K. (2008). A study on gastropod fauna of some waters in the arid region of Rajasthan with special reference to trematode infection and its seasonal trends. Ph.D. Thesis, Univ. of Bikaner.
[7] Mozaheb, S.A., Ghaneian, M.T., Ghanizadeh, G.H. and Fallahzadeh, M. (2010). Evaluation of the stabilization ponds performance for municipal waste water treatment in Yazd Iran. J. of Scientific Research 6 (1) pp. 76 82.
[8] Kaur, H. (2007). A study on the ageing phenomenon in a reservoir created in the arid region of Rajasthan with special reference to eutrophication pp. 133. Univ. of Bikaner, Bikaner.
(IJRASET
ISSN: 2321 9653; IC Value: 45.98; SJ Impact Factor: 7.538 Volume 10 Issue IX Sep 2022 Available at www.ijraset.com
[9] Krishnan, Radha, R., Dharmaraj, K. and Ranjitha Kumari, B.D. (2007). A comparative study on the physicochemical and bacterial analysis of drinking, borewell and sewage water in the three different places of Sivakasi. J. of Environ. Biol. 28(1) pp. 105 108.
[10] Soni, D.K., Upadhyay, R.N., Tewari, D.D., Srivastava, A.K. and Chaturvedi, G.B. (2009). Phytoremediation of sewage pollutants through some macrophyties near industrial area of Balrampur. Environ. Conservation J.11 (1&2) pp. 47 50.
[11] Sommerfield, M.R., Cisneros, R.M. and Olsen, R.D. (1975). The phytoplankton of Canyon Lake, Arizona South Western Naturalist, 20(1) : 45 53.