10 XI November 2022 https://doi.org/10.22214/ijraset.2022.47565
ISSN: 2321 9653; IC Value: 45.98; SJ Impact Factor: 7.538


Volume 10 Issue XI Nov 2022 Available at www.ijraset.com

ISSN: 2321 9653; IC Value: 45.98; SJ Impact Factor: 7.538
Volume 10 Issue XI Nov 2022 Available at www.ijraset.com
Ranjith R1, Ronit Kumar2, Satya Prakash Sahoo3 1, 2, 3Xavier Institute of Management and Entrepreneurship
Abstract: This study aims to analyze the India’s progress towards achieving sustainable development goals framed by UN, which has to be achieved before 2030. In this article we discussed about position of various states under different parameters. This article discuss about the major milestones achieved by India in progress towards achieving SDG. This article also discuss about obstacles faced by India towards achieving sustainable development goals and how it can overcome from it to achieve the goal.
Keywords: Sustainable development, Goals of Sustainable development, India’s progress in SDG, Good Health and wellbeing.
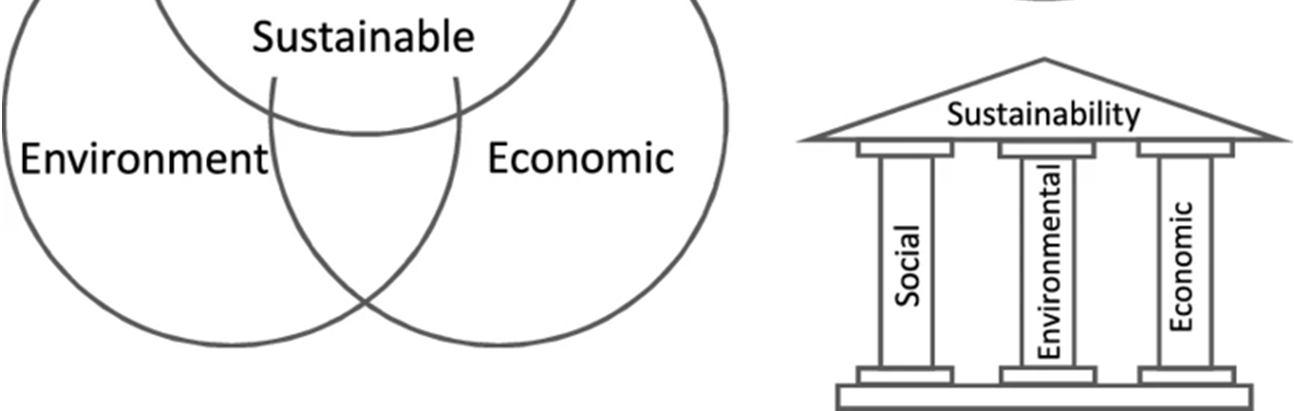
Sustainable development is development that meets the requirements of the present without compromising the capability of unborn generations to meet their own requirements. (World Commission on Environment and Development, Our Common Future( 1987), Brundtland Report.)

The Sustainable Development Goals( SDGs) or Global pretensions are a collection of 17 connected global pretensions designed to be a" participated design for peace and substance for people and the earth, now and into the future ”. The SDGs were set up in 2015 by the United Nations General Assembly and are intended to be achieved by 2030. They're included in an UN GA Resolution called the 2030 docket or what's colloquially known as Agenda 2030. The SDGs emphasize the connected environmental, social and profitable aspects of sustainable development, by putting sustainability at their center.
1) No poverty, 2) zero hunger, 3) Good health and well being, 4) Quality education, 5) Gender equality,
ISSN: 2321 9653; IC Value: 45.98; SJ Impact Factor: 7.538 Volume 10 Issue XI Nov 2022 Available at www.ijraset.com
6) Clean water and sanitation, 7) Affordable and clean energy, 8) Decent work and economic growth, 9) Industry, Innovation and Infrastructure, 10) Reduced Inequality, 11) Sustainable Cities and Communities, 12) Responsible Consumption and Production, 13) Climate Action, 14) Life Below Water, 15) Life On Land, 16) Peace, Justice, and Strong Institutions, 17) Partnerships for the Goals.
The NITI Aayog( National Institution for Transforming India) serves as the apex public policy think tank of the Government of India, and the nodal agency assigned with catalyzing profitable development, and fostering collaborative federalism through the involvement of State Governments of India in the profitable policy making process using a bottom up approach. Its enterprise include" 15 time road chart"," 7 time vision, strategy, and action plan", AMRUT, Digital India, Atal Innovation Mission, Medical Education Reform, husbandry reforms( Model Land Leasing Law, Reforms of the Agrarian Produce Marketing Committee Act, Agricultural Marketing and Farmer Friendly Reforms Index for ranking countries), Indices Measuring States Performance in Health, Education and Water Management, Sub Group of Chief Ministers on Vindication of Centrally Sponsored Schemes, Sub Group of Chief Ministers on Swachh Bharat Abhiyan, Sub Group of Chief Ministers on Skill Development, Task Forces on Agriculture and up of Poverty, and Transforming India Lecture Series. It was established in 2015, by the NDA government, to replace the Planning Commission which followed a top down model. The NITI Aayog council comprises all the state Chief Ministers, along with the Chief Ministers of Delhi and Puducherry, Lieutenant Governors of all UTs, and a vice chairman nominated by the Prime Minister. In addition, temporary members are named from leading universities and exploration institutions. These members include a principal administrative officer, four ex official members, and three part time members.
NITI Aayog has the binary accreditation to oversee the relinquishment and monitoring of the SDGs in the country and promote competitive and collaborative federalism among States and UT’s. The task at hand for NITI Aayog isn't just to periodically collect data on SDGs but to proactively realise the pretensions and targets.
The SDG India Index and Dashboard are products of the cooperation between the SDG Vertical and UNRCO. Both parties also banded in 2019 on a knowledge product named ‘ Localising SDGs Beforehand Assignments from India ’, which details the gests of and literacy from the localisation sweats of all States and UTs. The SDG Vertical, UNRCO, and the Ministry of Statistics and Programme perpetration( MoSPI) unite on the SDG Data Forum for supporting data, pointers, and statistics for covering SDGs in India.
UNDP is the Vertical’s mate for the localisation sweats. The shops and other engagements with the States/ UTs led by NITI Aayog are supported by UNDP. Both parties also unite on the enterprise on multidimensional poverty dimension and reduction. The cooperation has been formalised through an MoU inked by both organisations in August 2020.
The Vertical and GIZ have entered into a cooperation to take SDG localisation to the megacity position. Both parties will unite on developing an indicator and dashboard to cover and report the progress on achieving the SDG targets at the megacity position. The collaboration also aims at training and capacity structure programmes on data driven civic governance for civic original bodies ’ officers. The cooperation has been formalised through an MoU inked in October 2020.
ISSN: 2321 9653; IC Value: 45.98; SJ Impact Factor: 7.538


Volume 10 Issue XI Nov 2022 Available at www.ijraset.com
OPHI, UNDP, and the SDG Vertical entered into a cooperation for multidimensional poverty dimension and reduction. The development of the public MPI is an affair of the collaboration. The cooperation also extends to designing a reform action plan for faster poverty reduction.

The SDG Vertical mates with KPMG and UNRCO on private sector integration for SDGs, which aims to measure the impact of the business sector on the SDGs.
Primus mates, UNDP, and the SDG Vertical have banded on developing an online platform to grease the magnet of SDG linked investments.
Ahmad Mohd Khalid et al, 2020 The sustainable development pretensions( SDGs) were result of expansive stakeholder participation and global agreement. Despite large pledges, there's an adding concern among the member states whether SDGs address real problems of nations, particularly the developing world. This study discusses crucial issues raised by developing countries with respect to the SDGs. Using opinion of experts on SDGs regarding its counteraccusations and future, a case study for India is presented. The study with its findings and policy recommendations intend to profit SDG perpetration sweats and planning at the public and sub national position in India and other developing countries, helping them redesign and probe their public SDG perpetration strategies on analogous lines as India to ameliorate its reach and effectiveness. Basant Kumar Panda et al, 2018 The Sustainable Development Goals( SDGs) are decreasingly being used to measure experimental progress among and within countries. Achieving the health related SDGs remains a primary concern of numerous developing countries. This study measured the progress in named health affiliated pointers of SDGs in the countries of India by social and profitable groups, and prognosticated their likely progress by 2030. The health pointers analysed included health issues, nutrition, health care application and determinants of health. Data from the Census of India, Sample Registration System( SRS), National Family and Health checks( NFHSs) and National Sample Survey Organization( NSSO) were used in the analysis. Periodic rate of progress( ARP) and the needed rate of progress( RRP) were reckoned for named pointers over the period 2005 06 to 2015 16. A Composite Index of Health( CIH) was used to understand the state of health of populations. The ARP was advanced than the RRP in motherly care and reduction of under five mortality, while ARP was lower than the RRP in undernutrition and sanitation. The ARP for health affiliated pointers showed a mixed pattern across religion and estate groups. The ARP for medical backing at birth and immunization was loftiest among slated gentries and that for reduction of under five mortality was loftiest among slated lines. The CIH was smallest in Uttar Pradesh(0.26) and loftiest in Goa(0.81). The association between the CIH and the Human Development Index( HDI) was significant, suggesting interlinkage between health and development. Notable advancements were observed in motherly and child health and motherly health care application across social groups in India over the period 2005 06 to 2015 16, and if the trends continue the country can achieve the SDG target in motherly health by 2030. still, progress in nutrition and other health pointers has been slow and uneven.
Mohammad Asim Nomani et al, 2016 Energy policy, environmental planning and profitable development play a crucial part in sustainable development. Sustainable development requires suitable and strategic programs satisfying multiple and disagreeing objects. Fuzzy thing programming( FGP) is a well known approach in multi criteria decision making for its practical operation. In this composition, a FGP approach is proposed to assay environmental, energy and sustainability pretensions of India by the time 2030 with reference to the crucial profitable sectors of India. The presented model analyses the enhancement openings, demand of sweats and perpetration of the sustainable development plans. Numerical illustration is also handed for confirmation and operation of the proposed model.
ISSN: 2321 9653; IC Value: 45.98; SJ Impact Factor: 7.538 Volume 10 Issue XI Nov 2022 Available at www.ijraset.com
ISSN: 2321 9653; IC Value: 45.98; SJ Impact Factor: 7.538 Volume 10 Issue XI Nov 2022 Available at www.ijraset.com
4973.62 3.11
Kerala 100 18.7 20.5 22.6 9.1 2920.12 2.2 80
Goa 99.94 20.3 19.6 26.7 13.6 2716.68 4.21 78
Lakshadweep 91.1 Null Null 39 Null Null Null 74
Punjab 99.2 19.7 24.3 42 25.9 4693.24 2.57 73 6. Mizoram 99.98 11.3 27.4 26.6 17.9 1688.05 1.14 72 7. Jammu 97.01 13 15.5 38.1 15.8 2339.65 0.88 71 8. Ladakh 99.11 13 15.5 38.1 15.8 2339.65 0.88 71 9. Manipur 100 13 28.9 25.2 10.5 1727.59 0.57 64 10. Nagaland 94.65 16.3 26.2 28.9 8.4 1665.91 0.74 64 11. Delhi 100 28.1 28.8 46.1 29.2 3977.23 2.67 63 12. Uttarakhand 100 18.7 29.9 43.9 15.7 2691.48 0.71 61 13. Puducherry 56.34 Null Null 27.8 Null 3546.34 1.1 59 14. Haryana 99.92 28.8 34.9 55 29.9 4272.42 1.99 58 15. Karnataka 99.79 32 32.5 45.4 17.2 2788.37 0.64 53 16. Rajasthan 100 31.5 36.8 46.6 26 3423.23 0.86 53 17. Maharashtra 100 30.9 34.1 49.3 28.3 1967.9 0.65 44 18. MP Pradesh 100 38.7 39.5 54.6 21.2 2656.57 0.69 43 19. Odisha 94.98 29.2 29.1 47.6 29.5 2003.84 0.44 42 20. Assam 94.27 29.4 32.4 44.8 36.9 2147.44 0.62 41 21. Uttar Pradesh 99.23 36.8 38.8 51 31.6 3158.46 0.59 41 22. Chhattisgarh 98.39 40 35.4 41.5 31.2 1802.58 0.41 37 23. Meghalaya 98.04 30 40.4 49.5 31.8 1821.24 0.55 37 24. Bihar 99.85 38.7 42 58.3 28.1 2374.02 0.29 31 25. Jharkhand 77.8 42.9 36.2 62.6 34 1890.35 0.31 19
ISSN: 2321 9653; IC Value: 45.98; SJ Impact Factor: 7.538 Volume 10 Issue XI Nov 2022 Available at www.ijraset.com
25
113 36 91 177 0.05 10.4 11.56 94.4 13 37 74
Delhi 0 19 92 575 0.15 12.7 7.56 96 9.2 50 90
Gujarat 75 31 87 232 0.05 11.2 10.88 99.5 9.5 41 86
Maharashtra 46 22 100 183 0.07 15.4 11.92 99.3 14.5 43 83 4. Tamilnadu 60 17 84 138 0.04 17.8 13.88 99.9 9.1 65 81 5. Mizoram 0 0 92 237 1.18 5.9 5.27 89.9 9.9 50 79 6. Himachal 0 23 86 235 0.02 8 15.37 92.4 14.4 66 78 7. Karnataka 92 28 94 135 0.02 17.1 16.6 99.9 9.8 70 78 8. Lakshadweep 0 0 92 23 0 0 0 99.8 9.6 0 78 9. AP 65 33 87 189 0.05 12.4 15.26 99.6 13.5 95 77 10. Punjab 129 23 89 196 0.08 7.9 15.41 98.5 13.5 56 77 11. Uttarakhand 99 33 90 227 0.04 4.6 7.75 88.8 12.5 15 77 12. Arunachal 0 0 68 182 0.05 7.4 7.23 89.6 17 22 64 13. MP 173 56 89 226 0.04 15.1 14.35 95.6 12.2 33 62 14. Sikkim 0 0 62 218 0.03 33.1 12.63 99.4 0 25 62 15. Nagaland 0 0 54 233 0.73 1.9 1.02 83 7.9 1 61 16. Chhattisgarh 159 45 95 148 0.1 26.4 17.34 98.3 6.6 15 60 17. Uttar Pradesh 197 47 95 213 0.03 2.4 10.3 87.6 16.6 14 60 18. Assam 215 47 85 141 0.04 6.9 9.43 91.1 12.9 23 59
87.26 17.87 50.14 71.9
ISSN: 2321 9653; IC Value: 45.98; SJ Impact Factor: 7.538 Volume 10 Issue XI Nov 2022 Available at www.ijraset.com
74.6 84.76 82.62
Kerala 92.07 9.14 80.26 86.8 37 24.3 1.4 94.6 99.24 94.53 16 80
Chandigarh 85.78 4.52 83.43 81.6 50.6 37.4 1.54 89.1 100 89.49 12 79 3. Delhi 100 14.93 70.07 67.4 46.3 41 1.16 86.4 100 89.33 29 75 4. Himachal 97.82 7.81 81.79 72.8 39.6 25.6 1.3 84.2 97.59 79.55 9 74 5. Goa 88.26 9.4 71.95 71.7 30.1 32.4 1.33 88.9 99.97 85.7 11 71 6. Uttarakhand 96.38 10.95 66.2 75 39.1 24.7 1 79 87.72 89.78 15 70 7. Puducherry 84.15 12.73 69.78 61.3 46.4 28.6 1.24 89.5 99.93 92.57 11 70 8. Tamilnadu 85.49 13.02 72.32 71.3 49 19.1 0.97 80.7 96.08 93.31 18 69 9. Haryana 89.31 14.79 56.05 71.6 29.2 25.1 1.23 77.3 98.82 89.1 15 64 10. Karnataka 100 23.43 44.4 83.5 28.8 20.9 1.04 75.7 93.8 92.13 15 64 11. Maharashtra 90.92 13.29 68.93 76.3 32 25.7 0.9 80.3 92.74 93.82 22 64 12. Manipur 100 13.03 54.82 72.3 33.7 28.9 1.01 85.6 68.92 55.5 10 63 13. Telangana 93.69 13.47 56.49 69.8 36.2 20.8 1.02 67.4 91.52 90.96 11 63 14. Lakshadweep 75.27 4.56 73.5 65.3 7.4 18 3.4 95.7 100 86.21 7 62 15. Jharkhand 89.15 22.26 38.89 84 19.1 16.9 0.96 67.3 84.75 80.12 51 45 16. MP 81.19 24.85 43.73 70.5 21.5 17.2 0.97 70.5 75.34 81.19 36 45 17. Odisha 71.57 9.52 65.86 71.9 22.1 13.8 0.82 72.5 68.71 75.82 22 45 18. Assam 96.36 31.47 30.94 79.6 18.7 16.8 0.95 84.9 59.51 29.29 11 43 19. Tripura 100 29.55 38.62 71.3 19.2 13.4 0.83 89.9 57.12 45.8 18 42 20. Arunachal 80.98 35.98 38.48 60 29.7 10.3 0.99 79.9 50.94 79.04 14 41 21. Nagaland 67.38 24.08 33.92 61 18.7 11.9 1.11 93.8 63.26 36.03 11 39 22. Bihar 86.54 28.46 26.39 78.3 13.6 18.5 0.79 64.7 88.66 78.44 58 29
0.74 62.4 19.54
ISSN: 2321 9653; IC Value: 45.98; SJ Impact Factor: 7.538 Volume 10 Issue XI Nov 2022 Available at www.ijraset.com
13.96
Andaman 0 0.95 72.2 0.53 0 0.39 0 73 29.8 68
Puducherry 0 0.75 12.1 1.01 13.33 0.41 615 87.1 22.8 66
Chhattisgarh 958 0.64 53.5 5.09 14.44 0.64 250 79.3 13.79 64
Kerala 957 0.84 62.7 17.68 5.71 0.45 241 75.3 22.98 63 5. Himachal 930 0.8 45.4 6.4 7.35 0.8 222 71.7 7.43 62 6. Tamilnadu 908 0.73 15.6 2.06 8.51 0.49 185 83 19.65 59 7. AP 920 0.71 67.9 30.42 8 0.55 208 93.6 30.09 58 8. Sikkim 0 0.88 39.8 0.32 9.38 0.68 0 67.1 6.29 58 9. Chandigarh 0 0.96 95.2 32.78 0 0.35 274 72.5 10.83 58 10. Gujarat 866 0.81 27.1 11.17 7.56 0.28 190 67.4 16.49 49 11. Bihar 895 0.75 32.3 4.58 11.52 0.06 214 51.4 14 48 12. Nagaland 0 0.86 4.1 0 0 0.31 167 43.5 9.85 48 13. Odisha 933 0.65 103.5 12.79 8.9 0.32 206 64.1 4.06 46 14. Uttarakhand 840 0.71 46.5 11.79 8.45 0.29 234 71.6 11.93 46 15. Jammu 927 0.78 47.8 5.42 2.3 0.45 100 66.3 7.6 46 16. Ladakh 927 0.78 47.8 5.42 2.3 0.45 100 66.3 7.6 46 17. Punjab 890 0.67 41.5 11.4 5.13 0.26 190 80.9 1.55 45 18. Haryana 843 0.85 108.5 36.05 10 0.21 236 81.3 14.76 43 19. Manipur 0 0.76 17.2 0.97 3.33 0.36 0 23.6 6.8 41 20. Telangana 901 0.68 99.3 46.1 5.04 0.52 128 88.2 23 41 21. West Bengal 941 0.53 64 36.13 13.61 0.28 166 72.7 3.17 41 22. Rajasthan 871 0.79 110.4 49.03 12 0.43 181 74.3 10.12 39 23. Tripura 0 0.72 54.5 22.94 5 0.23 0 57.2 12.3 39 24. Arunachal 0 0.56 43.3 7.4 5 0.26 0 50 12.07 37 25. Delhi 844 0.75 144 40.76 11.43 0.25 188 69.5 13.65 33 26. Assam 925 0.53 177.8 70.73 6.35 0.17 221 55.6 1.67 25
97.57 100
100 99.87 80.6 63.91 10.08 93 6. AP 68.52 99.81 100 100 97.28 96.82 44.17 6.72 92
Bihar 65.19 96.29 100 100 97.92 96.84 45.74 2.25 91 8. Puducherry 95.17 95.89 100 100 98.74 95.35 75 25 91 9. Maharashtra 64.39 99.7 100 100 96.8 92.36 54.62 3.12 90 10. Chhattisgarh 52.17 99.6 100 100 99.15 90.05 44.47 0 89 11. Kerala 35.29 99.35 100 100 99.28 99.22 51.25 0.66 89 12. Sikkim 37.42 100 100 100 99.34 96.77 0.06 0 89 13. MP 47.95 99.65 100 100 98.5 91.12 54.77 7.03 88 14. Jammu 52.87 99.89 100 100 89.02 97.31 29.23 0 88 15. Manipur 69.55 100 100 100 77.84 100 2.56 0 87 16. Nagaland 40.14 100 100 100 90.33 100 1.01 0 87 17. Tamil Nadu 73.05 99.39 100 100 98.39 98.23 80.93 39.62 87 18. Andaman 88.89 100 100 100 99.28 60 3.03 0 87 19. Odisha 51.73 98.13 100 100 98.04 83.16 42.2 0 86 20. Himachal 76.57 100 100 100 97.87 98.92 84.78 50 85 21. Karnataka 59.47 100 100 100 95.64 87.71 69.91 25.57 85 22. Mizoram 46.17 100 100 100 85.48 97.14 5.26 0 85 23. Uttarakhand 52.46 99.26 100 100 95.36 78.39 56.75 0 85 24. Delhi 0 0 100 100 100 53.44 120 64.71 61 25. Rajasthan 35.25 92.28 100 100 90.44 65.79 139.87 62.71 54
ISSN: 2321 9653; IC Value: 45.98; SJ Impact Factor: 7.538 Volume 10 Issue XI Nov 2022 Available at www.ijraset.com
modern energy
of a State and UT’s towards achieving goal 7 is prognosticated by measuring the countries;
Electrification
S.NO States A B SDG Index Score Target 100 100 100 India 99.99 92.02 92 1. AP 100 101.16 100 2. Goa 100 146.84 100 3. Haryana 100 127.08 100 4. Himachal 100 120.23 100 5. Karnataka 100 108.81 100 6. Kerala 100 110.78 100 7. Maharashtra 100 108.64 100 8. Mizoram 100 114.07 100 9. Punjab 100 141.66 100 10. Rajasthan 100 108.88 100 11. Sikkim 100 104.86 100 12. Tamil Nadu 100 100.29 100 13. Telangana 100 120.43 100 14. Uttar Pradesh 100 106.83 100 15. Uttarakhand 100 115.4 100 16. Assam 100 97.61 98 17. West Bengal 100 98.13 98 18. Puducherry 100 97.9 98 19. Manipur 100 95.64 96 20. Gujarat 100 93.32 94 21. MP 100 85.24 86 22. Arunachal 100 84.05 85 23. Tripura 100 82.4 83 24. Lakshadweep Null 90.91 83 25. Odisha 100 79.52 80 26. Bihar 100 76.55 78 27. Chhattisgarh 99.67 76.87 78 28. Jharkhand 100 75.79 77 29. Nagaland 100 67.59 69 30. Meghalaya 100 47.5 50
all)
3.33 9.4 57.8 23.8
45.78 63.55 44.19 76
Telangana 8.45 48.6 8.8 60.2 62.2 100 15.08 28.93 57.45 73
Sikkim 4.97 0 3.3 66.1 36.2 100 24.55 28.72 50.93 71 5. Tamil Nadu 7.45 13.61 7.2 60.4 45.5 100 16.07 35.47 58.53 71 6. Puducherry 5.83 2.22 8.7 58 37.1 100 17.88 39.83 57.07 68 7. AP 3.84 52.4 5.7 63.5 62.5 100 14.4 21.01 59.31 67 8. Karnataka 6.59 7.82 3.9 56.6 38.5 99.97 16.69 26.73 55.57 66 9. Delhi 5.63 19.17 10.7 53.5 59.9 100 19.26 41.1 47.07 65 10. Chhattisgarh 5.36 28.71 2.6 66.6 50.7 99.98 10.06 12.5 55.65 64 11. Gujarat 7.69 20.19 3.4 54.9 50.8 100 12.99 17.53 50.25 64 12. Meghalaya 7.06 0 2.8 65.2 42.5 100 11.73 12.5 58.38 63 13. Uttarakhand 5.46 19.72 9.5 48.6 40.3 100 20.01 24.64 53.06 63 14. Kerala 6.93 1.11 10.4 55 54.4 100 19.6 27.99 58.83 62 15. Maharashtra 5 17.5 5.4 58.2 43.3 100 11.39 22.3 54.08 62 16. Lakshadweep Null 13.33 32 50.1 14 100 20.59 97.06 52.65 62 17. MP 4.3 43.44 3.7 56.9 61.5 100 8.92 12.54 53.08 60 18. Haryana 5.99 13.24 9.8 50.4 56.1 100 18.39 23.62 49.76 59 19. Ladakh 4.5 5 5.6 58.5 44.4 99.71 24.66 51.69 57.87 59 20. Punjab 4.61 7.61 8 51.9 70.3 100 22.94 24.39 52.32 57 21. Nagaland 5.93 0 18.5 47.8 17.1 99.92 8.87 14.33 54.75 48 22. Odisha 5.49 0 7.6 55.2 54.3 99.85 11.92 15.72 55.48 48 23. Jammu 4.5 5 5.6 58.5 44.4 99.71 13.73 19.42 54.26 47 24. Manipur 0.74 0 10.1 51.5 15.9 99.76 7 11.43 55.87 36
ISSN: 2321 9653; IC Value: 45.98; SJ Impact Factor: 7.538 Volume 10 Issue XI Nov 2022 Available at www.ijraset.com
1. Gujarat 100 3.62 36.74 20.84 23.63 94.71 64.79 72 2. Tamil Nadu 100 3.4 20.58 18.74 37.91 101.75 65.68 71 3. Punjab 100 3.46 13.78 19.39 22.54 122.19 84.32 69 4. Goa 100 2.78 42.5 16.39 24.92 177.45 74.72 68 5. Haryana 100 3.37 20.22 17.6 25.81 112.77 59.33 66 6. Maharashtra 99.03 3.42 19.38 11.24 38.03 101.07 74.72 66 7. Delhi Null 3.36 5.2 22.99 46.6 190.61 199.88 66 8. Karnataka 100 3.37 15.88 11.74 42.5 100.28 69.35 64 9. Himachal 91.89 2.72 29.79 6.48 25.06 145.83 82.63 61 10. Kerala 99.5 3.16 10.76 11.77 30.58 123.01 77.47 60 11. Telangana 99.66 3.22 11.54 12.86 33.23 109.9 65.61 59 12. Puducherry Null 3.28 29.65 20.85 25.23 72.97 Null 59 13. Uttarakhand 84.67 2.85 37.52 12.81 23.5 113.58 38.73 56 14. West Bengal 99.13 2.99 12.34 18.66 21.69 80.99 51.74 53 15. Lakshadweep Null Null Null 4.79 11.71 124.28 Null 40 16. Assam 94.38 3 12.25 10.55 16.38 67.51 41.57 39 17. Jharkhand 99.86 2.88 20.02 7.68 17.12 57.55 30.99 37 18. MP 99.69 3.21 8.85 6.84 20.82 65.29 44.24 37 19. Chhattisgarh 97.15 3.01 12.6 5.46 15.77 67.99 44.24 36 20. Manipur 89.26 2.42 2.42 12.11 22.78 72.97 52.34 35 21. Tripura 95.87 2.95 3.31 6.38 12.84 75.78 52.34 35 22. Mizoram 67.24 2.31 0.64 5.34 16.93 109.73 52.34 32 23. Arunachal 81.75 2.77 3.2 2.05 14.9 84 52.34 31 24. Nagaland 87.16 2.28 1.37 8.11 14.11 74.27 52.34 30 25. Meghalaya 63.18 2.56 8.88 1.27 12.15 70.23 52.34 25 26. Bihar 97.18 2.85 7.21 5.3 14.48 50.65 30.99 24
ISSN: 2321 9653; IC Value: 45.98; SJ Impact Factor: 7.538 Volume 10 Issue XI Nov 2022 Available at www.ijraset.com
10) GOAL 10: REDUCED INEQUALITIES (Reduce inequality within and among countries) Performance of a State and UT’s towards achieving goal 10 is prognosticated by measuring the countries;
Income inequality
Politician inclusion
Seats held by women in Panchayati Raj Institutions
Representation of SC/ST in State legislative Assemblies
Transgender labor force participation
Crimes against SC
Crimes against ST S.NO States
Index Score Target 4.67 50 33 1 0 0 100 India 40 14.39 45.62 28.35 0.64 22.8 7.9 67 1. Meghalaya 46.9 50 0 91.67 1.33 0 0 88 2. Tripura 55.7 50 45.23 50 0 0 0.2 85 3. Himachal 11.7 0 50.13 29.41 1.23 10.9 0.3 78 4. Uttarakhand 23.1 20 56.02 21.43 0.65 4.4 2.7 77 5. Goa 5.6 0 36.72 2.5 0 11.8 1.3 75 6. Lakshadweep 1.2 0 37.27 0 0 0 0 75 7. AP 22.4 16 50 20.57 0.99 24.5 12.5 74 8. Tamil Nadu 19.9 7.89 52.99 19.66 0.74 7.9 3.9 74 9. Chhattisgarh 59 27.27 54.79 43.33 0.81 10.4 5.5 72 10. Delhi 2.3 14.29 0 17.14 0.67 2.7 0 72 11. Maharashtra 26.6 16.67 53.47 18.75 0.65 16.2 5.3 71 12. West Bengal 53.5 26.19 51.42 28.57 0.48 0.6 1.9 71 13. Manipur 41.1 0 50.69 33.33 0 0 0.2 70 14. Arunachal 43.6 0 38.99 98.33 1.39 0 0 69 15. Kerala 3.2 5 52.42 11.43 0.99 28.2 28.9 69 16. Gujarat 25.2 23.08 49.96 21.98 0.39 34.8 3.6 64 17. Mizoram 17 0 23.64 97.5 1.35 0 0.8 64 18. Puducherry 12.7 0 0 16.67 0 2 0 62 19. Sikkim 7.6 0 50.3 43.75 0.07 14.1 1 61 20. MP 54.7 13.79 50 35.65 0.56 46.7 12.5 51 21. Bihar 75.2 7.5 52.02 16.46 0.59 39.5 7.3 48 22. Nagaland 42.9 0 0 98.33 0.44 0 0 46 23. Rajasthan 41.7 12 51.32 29.5 0.36 55.6 19.5 45 24. Uttar Pradesh 54.1 13.75 33.34 21.29 0.42 28.6 63.6 41
B C
ISSN: 2321 9653; IC Value: 45.98; SJ Impact Factor: 7.538 Volume 10 Issue XI Nov 2022 Available at www.ijraset.com
87.6 105 12.2 96.8 68.1 78 38.9
Punjab 0.1 97 102 14.65 99.5 76 93.4 88.8 91
Goa 0 95.6 94.79 5.87 100 70 79.7 80.5 89
Gujarat 1.3 92.6 138 6.07 100 86.7 83.9 56.9 87
Maharashtra 0.2 94.8 112 7.8 90 82.5 86.7 69.9 87 5. Sikkim 1.2 89.3 67 8.7 100 70.7 94.3 92.7 85 6. Haryana 0.2 97.4 93 15.43 93.9 49.9 65 116 81 7. MP 0.8 89.7 112 17.43 100 90 98.5 15.5 81 8. Rajasthan 0.3 89.1 102 13.52 100 77 82 29.6 81 9. Himachal 0.2 92.4 59 43.05 100 98.1 100 98.4 79 10. Tamil Nadu 0.8 86 116 9.17 97 70 85 25.7 79 11. AP 0.7 89.7 126 16.11 100 63.7 96.8 18.6 78 12. Chhattisgarh 0.7 76.9 108 18.17 100 93 100 6.57 78 13. Karnataka 0.5 93.7 112 12.17 100 64.1 65.3 31.9 78 14. Uttar Pradesh 1.4 92.1 107 18.18 99.2 68.3 74.3 41.2 77 15. Telangana 0.3 96.1 92 17.37 100 78 53.2 31.1 76 16. Uttarakhand 0.3 97.4 75 9.97 100 56.5 78.7 26.9 76 17. Puducherry 0.2 83.2 91 2.56 100 12.4 100 44.2 76 18. Kerala 0.2 75.1 126 6.4 85.5 75 100 4.29 75 19. Jharkhand 0.8 75.1 135 18.36 96.2 64 85.6 13 71 20. Odisha 2.8 65.7 104 26 100 80 90 29.5 70 21. Bihar 1.1 87.8 103 21.63 99.4 58.3 52.8 5.62 67 22. Mizoram 1.3 52 18 5.09 100 80.1 87.1 9.8 61 23. Jammu 0.4 94.4 84 6.92 85.1 16.3 12.5 21.4 57 24. Lakshadweep 0 48.1 0 0 0 0 0 0 56 25. Nagaland 0.7 59.5 68 1.14 63.3 67.9 32.5 0 48 26. West Bengal 1.7 68 55 5.73 86 9.1 19 10.5 45 27. Arunachal 8.9 59.4 80 11.76 82.4 24 48.7 0 39
a State and UT’s towards
Fossil Fuel Consumption
Use of NPK
Hazardous waste generation
Hazardous waste recycled/Utilized
Plastic waste generation
Biomedical waste treated
Grid Interactive Bio Power
12
ISSN: 2321 9653; IC Value: 45.98; SJ Impact Factor: 7.538 Volume 10 Issue XI Nov 2022 Available at www.ijraset.com
sustainable consumption
measuring the countries;
patterns)
States
B C
F
Index Score Target 64.1 57 4.04 100 1.27 100 21.81 100 India 157 64.39 8.09 44.89 2.54 86.9 7.62 74 1. Tripura 64 0 0.07 93.17 0.01 100 Null 99 2. Jammu 120 62.49 0.21 1264 2.62 95.5 Null 95 3. Ladakh 120 62.49 0.21 1264 2.62 95.5 Null 95 4. Nagaland 77.9 0 0.01 50 0.13 100 Null 91 5. Karnataka 216 52.62 6.34 54.79 4.17 100 28.4 89 6. Manipur 88.5 52.85 Null Null 4.04 79.4 Null 89 7. Mizoram 127 64.24 0 50 0.01 100 Null 87 8. AP 158 59.58 11.28 75.99 1.27 100 9.64 84 9. Maharashtra 187 50.7 9.24 11.57 3.37 99.6 21 82 10. Uttarakhand 171 78.35 2.17 96.33 2.81 99.1 11.51 82 11. Uttar Pradesh 91.1 73.72 1.12 60.4 1.14 100 9.25 79 12. West Bengal 96.2 50.2 1.92 49.91 3.11 100 3.27 79 13. MP 110 63.04 3.03 67.06 0.89 91.8 1.47 78 14. Tamil Nadu 200 49.22 17.26 48.73 5.32 100 13.38 78 15. Arunachal 180 0 Null Null 2.54 100 0 77 16. Haryana 415 75.84 4.66 177.5 2.42 100 7.25 77 17. Himachal 227 62.89 3.74 65.7 0.51 100 1.25 77 18. Sikkim 207 0 2.23 0 0.01 73.4 Null 76 19. Rajasthan 166 70.63 8.15 99.19 1.37 76 1.54 74 20. Chhattisgarh 161 56.46 8.56 19.75 0.21 28.6 8.38 64 21. Lakshadweep 235 0 0.72 0 2.21 20.9 Null 63 22. Bihar 50.5 68.58 0.14 28.41 0.58 28.8 1.02 59 23. Jharkhand 103 70.08 13 2.06 1.39 52.6 0.11 55 24. Gujarat 351 71.03 50.12 33.1 5.3 100 1.12 50 25. Delhi 292 89.01 2.18 0.05 11.5 100 2.56 50 26. Goa 547 43.63 19.11 4.34 21.2 100 0.22 47
Pollution
States
C
ISSN: 2321 9653; IC Value: 45.98; SJ Impact Factor: 7.538 Volume 10 Issue XI Nov 2022 Available at www.ijraset.com
Index
Target 0 50 40 103.2 1442 100 India 15.4 19.2 36.37 28.24 3469 54 1. Odisha 22.8 22 31.4 120.1 3201 70 2. Kerala 136 24.5 40.16 45.64 1698 69 3. Nagaland 56.2 10.5 53.57 52.6 1408 69 4. Lakshadweep Null 9.5 100 309.4 Null 68 5. Gujarat 10.7 27 34.51 62.16 3102 67 6. Mizoram Null 16.5 65.53 53.09 1585 66 7. Ladakh 23.6 12 73.84 81.41 3029 66 8. Sikkim 45.5 16 84.84 25.45 1620 65 9. AP 15.6 19.5 40.73 43.87 3007 63 10. Jammu 23.6 12 73.84 66.42 3029 63 11. Himachal 472 23 93.96 121.8 2318 62 12. Karnataka 10.2 18 63.2 37.54 2871 62 13. Meghalaya 28.1 16.5 73.66 13.84 1798 62 14. Tamil Nadu 12.9 24.5 51.59 5.97 2412 61 15. Uttarakhand 62.4 19.5 71.52 52.03 3300 60 16. Arunachal 221 11.5 84.78 34.19 1436 58 17. Maharashtra 8.73 27.5 30.18 18.53 2816 58 18. MP 3.81 16.5 33.53 21.78 3809 49 19. Rajasthan 2.22 18.5 46.04 22.64 4528 49 20. Goa Null 13.5 1.06 67.78 1482 44 21. Telangana Null 13 41.12 6.07 2710 43 22. Tripura 55.5 22.5 12.41 27.04 3598 41 23. Uttar Pradesh 4.71 16.5 25.77 11.91 4390 39 24. West Bengal 27.6 19.5 17.76 9.88 3761 39 25. Chhattisgarh 2.46 14 5.94 38.32 3667 38 26. Jharkhand Null 7.5 9.48 37.15 3117 25 27. Puducherry Null 21 2 40.46 Null 23 28. Bihar Null 19.5 7.91 16.65 4308 16
ISSN: 2321 9653; IC Value: 45.98; SJ Impact Factor: 7.538 Volume 10 Issue XI Nov 2022 Available at www.ijraset.com
ISSN: 2321 9653; IC Value: 45.98; SJ Impact Factor: 7.538 Volume 10 Issue XI Nov 2022 Available at www.ijraset.com
16) GOAL 16: PEACE, JUSTICE AND STRONG INSTITUTIONS (Promote peaceful and inclusive societies for sustainable development, provide access to justice for all and build effective, accountable and inclusive institutions at all levels) Performance of a State and UT’s towards achieving goal 16 is prognosticated by measuring the countries; a) Murders reported b) Cognizable crimes against children
Human trafficking
Missing children
Court density
Corruption crimes
Births registered
Aadhaar coverage
States
B C
E F G H
Index Score Target 1 0 0 0 4.25 0.19 100 100 100 India 2.2 33.2 4.95 16.41 1.85 3.17 89.3 93 74 1 Uttarakhand 1.8 31.5 3.22 14 2.73 1.16 100 102 86
Puducherry 1.9 10.8 0 10.21 1.71 0.66 100 98 86
Gujarat 1.5 22.7 0.32 6.96 2.28 3.74 92 100 82 4 Mizoram 1.8 33.7 45 0 5.33 1.67 100 94 81 5 West Bengal 2 21.4 2.7 27.94 1.12 0.09 100 96 81 6 Kerala 0.9 50.9 6.19 23.37 1.66 2.61 97.2 108 80 7 Tripura 3.6 25.1 0.5 13.63 3.1 1.5 100 94 80 8 Nagaland 1.2 8.8 9.26 5.52 1.53 0.46 100 61 79 9 Uttar Pradesh 1.7 21.4 0.61 3.59 1.58 0.59 80.1 90 79 10 AP 1.7 16.1 7.63 17.52 1.21 2.35 90.2 100 77 11 Lakshadweep 0 144.4 0 0 4.29 0 64.6 103 77 12 Karnataka 2 32.2 2.82 4.26 2.13 5.75 94 97 76 13 Punjab 2.3 29.9 0.63 10.19 2.54 5.64 91.7 107 76 14 Jammu 0.9 10.5 0 6.16 2.27 6.06 78.5 82 74 15 Ladakh 0.9 10.5 0 6.16 2.27 6.06 78.5 82 74 16 Bihar 2.6 20.8 2.63 16.3 1.58 0.59 80.3 86 73 17 Himachal 1 34.6 2.32 18.19 2.57 8.47 85.6 108 73 18 Rajasthan 2.1 25.9 8.56 12.81 1.9 5.46 96.6 92 73 19 Meghalaya 2.1 37.8 9.6 10.4 3.13 1.55 100 41 72 20 Sikkim 2.6 80.3 2.99 19 4.18 0 65.2 91 72 29 Arunachal 4 32.7 2.65 9.36 2.72 8.61 100 83 64 30 Goa 2.1 32.1 58.44 5.96 3.25 5.84 79.1 107 63 31 Assam 3.6 55.6 7.21 11.86 1.35 0.52 100 45 62 32 Delhi 2.6 139 30.49 113.48 4.31 0.9 100 125 62 33 Odisha 3.1 49.9 20.03 22.44 2.16 8.07 86 97 59
ISSN: 2321 9653; IC Value: 45.98; SJ Impact Factor: 7.538 Volume 10 Issue XI Nov 2022 Available at www.ijraset.com
S.NO States Ranking 2020 1 Chandigarh 79 2 Kerala 75 3 Himachal Pradesh 74 4 Tamil Nadu 74 5 Andhra Pradesh 72 6 Goa 72 7 Karnataka 72 8 Uttarakhand 72 9 Sikkim 71 10 Maharashtra 70 11 Gujarat 69 12 Telangana 69 13 Mizoram 68 14 Punjab 68 15 Delhi 68 16 Lakshadweep 68 17 Puducherry 68 18 Haryana 67 19 Andaman 67 20 Jammu 66 21 Ladakh 66 22 Tripura 65 23 Manipur 64 24 Madhya Pradesh 62 25 West Bengal 62 26 Dadra 62 27 Daman 62 28 Chhattisgarh 61 29 Nagaland 61 30 Odisha 61 31 Arunachal Pradesh 60 32 Meghalaya 60 33 Rajasthan 60 34 Uttar Pradesh 60 35 Assam 57 36 Jharkhand 56 37 Bihar 52
ISSN: 2321 9653; IC Value: 45.98; SJ Impact Factor: 7.538 Volume 10 Issue XI Nov 2022 Available at www.ijraset.com
270 MILLION people lifted out of multi dimensional poverty.
28.7% households have at least one member covered under HEALTH INSURANCE OR HEALTH SCHEME.
1.
2. GOAL 2
84.44% beneficiaries PROVIDED EMPLOYMENT under MGNREGA in 2019 20.
4.2% households in rural and urban India LIVE IN KATCHA HOUSES.
91.38% eligible beneficiaries received social protection benefits under the PRADHAN MANTRI MATRU VANDANA YOJANA.
99.51% BENEFICIARIES covered under the NATIONAL FOOD SECURITY Act, 2013 in 2019 20.
28.4% ADOLESCENTS aged 10 19 years are ANAEMIC.
33.4% children aged under five are underweight.
34.7% children aged under five are stunted.
2,995 Kg/ha ANNUAL AGRICULTURAL PRODUCE of rice and wheat.
0.71 lakhs GROSS VALUE ADDED (GVA) in agriculture PER WORKER.
3. GOAL 3
113 MATERNAL MORTALITY RATIO per 1,00,000 live births. 36 CHILDREN aged under five years DIE for every 1,000 live births. 37 PHYSICIANS, NURSES AND MIDWIVES per 10,000 population. 177 TUBERCULOSIS CASES notified per 1, 00,000 population. 0.05 HIV INCIDENCE per 1,000 uninfected population in 2019 from 0.07 in 2017. 13% of monthly per capita household consumption EXPENDITURE IS ON HEALTH. 94.4% of TOTAL DELIVERIES reported happen in health institutions. 91% CHILDREN aged 9 11 months IMMUNISED.
4. GOAL 4
87.26% ADJUSTED NET ENROLMENT RATIO at elementary (class 1 8) education. 50.14% GROSS ENROLMENT RATIO for higher secondary education. 26.3% students aged 18 23 years ENROLLED IN HIGHER EDUCATION. 71.9% Class 8 students achieved MINIMUM PROFICIENCY IN LANGUAGE AND MATHEMATICS. 74.6% LITERACY LEVEL among persons aged 15 years and above. 19.3% PERSONS WITH DISABILITIES (15 years and above) completed at least secondary education. 1 GENDER PARITY INDEX 1 implies parity between females and males in Higher Education (18 23 years). 84.76% schools had ACCESS TO ELECTRICITY AND DRINKING WATER. 83% TRAINED TEACHERS in secondary schools. 21 PUPIL TEACHER RATIO at secondary level.
GOAL 5
8.46% seats in the STATE LEGISLATIVE ASSEMBLIES held by women. 0.33 Ratio of Female to Male LABOUR FORCE Participation Rate as against 1
5.
6. GOAL 6
ISSN: 2321 9653; IC Value: 45.98; SJ Impact Factor: 7.538 Volume 10 Issue XI Nov 2022 Available at www.ijraset.com
899 SEX RATIO AT BIRTH (females per 1,000 males)
72% of married women have their demand for FAMILY PLANNING met by modern methods.
62 cases of CRIME AGAINST WOMEN ARE REGISTERED for every 1,00,000 female population.
190 among every 1,000 persons in MANAGERIAL POSITIONS are women.
13.96 % OPERATIONAL LANDHOLDERS are female.
33% HIGHER WAGES FOR MEN THAN women in rural and urban India.
100% districts verified as OPEN DEFECATION FREE (ODF).
100% IHHL constructed against target (SBM G).
95% schools have SEPARATE TOILET FACILITIES FOR GIRLS.
51.36% rural population receives SAFE AND ADEQUATE DRINKING WATER through piped water supply.
97.44% rural population have access to IMPROVED SOURCE OF DRINKING WATER. 88.4% polluting industries COMPLY WITH Central Pollution Control Board NORMS FOR WASTE WATER TREATMENT. 7. GOAL 7 99.99% of households have ACCESS TO ELECTRICITY
8. GOAL 8 5.1% annual growth rate of India’s GDP PER CAPITA at constant prices in 2018 19. 6.2% UNEMPLOYMENT RATE. 53.6% LABOUR FORCE PARTICIPATION Rate.
52% salaried employees in nonagricultural sector have NO SOCIAL SECURITY COVER. 99.99% households have BANK ACCOUNTS under PMJDY against the target. 55.3% Pradhan Mantri Jan Dhan Yojana ACCOUNTS HELD BY WOMEN. 12 Banking outlet per 100000 population. 17 ATM per 100000 population. 9. GOAL 9
India's rank among 131 countries in the GLOBAL INNOVATION INDEX, 2020, by WIPO 48th . 98% TARGETED HABITATIONS COVERED with all weather roads under PMGSY HAVE A MOBILE CONNECTION HAVE INTERNET SUBSCRIPTION. 16.1% of total GROSS VALUE ADDED is from MANUFACTURING SECTOR. 12.07% of TOTAL WORKFORCE EMPLOYED in the manufacturing sector. 84 Have mobile / 100 55 Have Internet subscription / 100
GOAL 10
10.
64% TRANSGENDER LABOUR FORCE PARTICIPATION rate as compared to the male labor force participation rate. 45.62% SEATS of Panchayati Raj Institutions HELD BY WOMEN. 14.39% total SEATS in Lok Sabha elections WON BY WOMEN. 28.35% REPRESENTATION of SC/ST persons IN STATE LEGISLATIVE ASSEMBLIES. 39% INSTALLED SEWAGE TREATMENT CAPACITY as a proportion of sewage generated in urban areas.
ISSN: 2321 9653; IC Value: 45.98; SJ Impact Factor: 7.538 Volume 10 Issue XI Nov 2022 Available at www.ijraset.com
11. GOAL 11 87.6% URBAN HOUSEHOLDS have DRAINAGE FACILITY. 97% wards have 100% DOOR TO DOOR WASTE COLLECTION. 78.03% wards have 100% SOURCE SEGREGATION. 68.1% of the MUNICIPAL SOLID WASTE generated gets PROCESSED.
0.8% of urban households LIVE IN KATCHA HOUSES. 12 persons were killed in ROAD ACCIDENTS in urban areas for every 1,00,000 population.
12. GOAL 12
157.3 KG of FOSSIL FUEL CONSUMED per capita. 7.62 MW installed capacity of GRID INTERACTIVE BIO POWER per one million population. 2.5 TONNES of PLASTIC WASTE per annum GENERATED per 1,000 population. 87% of the BIOMEDICAL WASTE GENERATED treated. 8.09 TONNES per annum HAZARDOUS WASTE GENERATED per 1,000 population.
44.89% HAZARDOUS WASTE RECYCLED/UTILIZED of total hazardous waste generated. 13. GOAL 13
15 lives lost DUE TO EXTREME WEATHER EVENTS in 2018 to 2019 per 10 million people. 3469 DISABILITY ADJUSTED LIFE YEAR RATE (per 1,00,000 population): Years of healthy life lost to premature death or ill health due to air pollution. 36.37% ELECTRICITY GENERATION is FROM RENEWABLE ENERGY. 38.6 mt CO2 SAVED by switching to LED BULBS. 14. GOAL 14 4975 sq km AREA UNDER MANGROVES. 30% of 0.53 million hectares brackish water area DEVELOPED FOR AQUACULTURE. 15. GOAL 15
25% geographical area UNDER FOREST AND TREE COVER. 1.7 million hectares are covered under AFFORESTATION SCHEMES. 28% of the TOTAL LAND AREA is DEGRADED. 296 WILDLIFE CRIME cases reported in 2019. 15 Wildlife crime CASES PER MILLION HECTARES of protected area
16. GOAL 16
3.17 CASES of CORRUPTION CRIMES REPORTED per one million population. 93.24% of the POPULATION is UNDER AADHAAR coverage. 1.85 COURTS per one lakh population. 89.3% BIRTHS REGISTERED in 2018. 5 PERSONS per 10 lakh population VICTIM OF HUMAN TRAFFICKING. 2.2 MURDERS per 1,00,000 population. 33 CASES per 1,00,000 children COGNIZABLE CRIMES AGAINST CHILDREN. 16 CHILDREN MISSING per 1,00,000 child population.
India isn't placed well to achieve the United Nations commanded Sustainable Development Goals( SDG) and its preparedness has worsened over the times in comparison with other countries.
ISSN: 2321 9653; IC Value: 45.98; SJ Impact Factor: 7.538
Volume 10 Issue XI Nov 2022 Available at www.ijraset.com
1) The country continues to face major challenges in achieving 11 of the 17 SDGs, which has pushed down its global ranking on SDG preparedness.
2) Ensuring decent work( SDG 8) has come more grueling .
3) According to the report, India is on track to achieving SDG 13 on climate action. still, The State of India’s Environment, 2022 flagged that the country was facing major challenges in this area. India’s performance on climate action ( SDG) 13 has slipped from 2019 2020.
4) This decline in India’s overall performance is primarily due to eight countries Bihar, Telangana, Rajasthan, Uttar Pradesh, Karnataka, AP Pradesh, Punjab and Jharkhand whose scores have dipped under SDG 13 in the two times.
1) The progress in around 10 of these pretensions is analogous to those in 2021.
2) These include SDG 2 on ending hunger, SDG 3 on good health and good and SDG 6 on clean water and sanitation.
1) New hookups and inventions should be Gauged up.
2) New Hookups and inventions that surfaced during the Covid 19 epidemic, including in scientific cooperation and data, should be gauged up to support the SDGs.
1) Science, technological inventions, and data systems can help identify results in times of heads and can give decisive benefactions to address the major challenges of our times.
2) These call for increased and dragged investments in statistical capacities, Research & Development and education and chops.
1) Achieving the SDGs is unnaturally an investment docket in physical structure( including renewable energy, digital technologies) and mortal capital( including health, education).
2) Yet the poorest half of the world lacks request access to capital on respectable terms.
3) Poor and vulnerable countries have been hit hard by the multiple heads and their slip overs.
[1] Chromeextension://efaidnbmnnnibpcajpcglclefindmkaj/https://www.niti.gov.in/writereaddata/files/SDG_3.0_Final_04.03.2021_Web_Spreads.pdf http://www.niti.gov.in/