
10 X October 2022 https://doi.org/10.22214/ijraset.2022.47038
ISSN: 2321 9653; IC Value: 45.98; SJ Impact Factor: 7.538
Volume 10 Issue X Oct 2022 Available at www.ijraset.com

ISSN: 2321 9653; IC Value: 45.98; SJ Impact Factor: 7.538
Volume 10 Issue X Oct 2022 Available at www.ijraset.com
Malloju Madhuyella1, Dr. Daniel2
1Student (MBA), School of Management & Commerce, MallaReddy University, Hyderabad
2Professor (MBA), School of Management & Commerce, MallaReddy University, Hyderabad

Abstract: The study is to examine the impact of digital marketing on the customer buying behavior and to find out the customers are sensible of digital marketing and the digital channel’s impact on their purchase decision. The study is carried out through checks from 148 respondents and Responses from the client. The rating scale was used to get the respondents' final results from the questionnaire. The questionnaires were distributed to 180+ and got 148 responses from respondents. The Rate scale will be used to measure a person's perception and attitude or opinion. The results are interpreted to show the impact of digital marketing on customer buying behavior. The findings revealed that customers are apprehensive of digital marketing and prefer to book site visits through digital channels in their buying actions. The study is performed in a particular geographical area, particularly residential real estate customers or leads and this may be considered as a limitation to judge the purchase opinion of varied regions. As the world moves towards a digital period, the various digital channels play a vital place in the increase of sales of any company’s products or generating leads for the Business. So, the present study attempted to reveal the impact of digital marketing on customer buying behavior- Residential Real Estate. This result helps us to change the Digital Marketing Strategy plan Developed for the Residential Real Estate (Vue Residences).
Keywords: Digital marketing, customer behavior, Residential Real Estate (VUE Residences), online customer buying behavior.
1) To Understand Customer Behaviour towards Residential Real Estate.
2) To Understand the influence of digital marketing channels on “customer buying behavior” towards Residential Real Estate.
1) Understanding Customer’s Perception & Attitude or Opinion.
2) According to the customer’s perception, making changes in digital marketing strategy and generating more Quality Leads.
The suggestion from the study is based on the responses given by the customers or leads of Vue Residences. This study will help get an insight into the impact of digital marketing on customer buying decisions.

Out of a total sample of 148 people who responded, 16.7 % were female, and 83.3% were male. A wide majority of respondents were between 31 40 years of age (53.1%) and between 26 and 30 years of age (29.1%). Most of the respondents are highly educated which helps in getting proper responses. The majority of respondents are professionals (75%) (The term professional refers to anyone who earns their living from performing an activity that requires a certain level of education, skill, or training). Almost every person involved in this survey is earning a good amount. Descriptive statistics are displayed in Table 1 Descriptive statistics of the respondents’ demographic characteristics (Frequency tables)
ISSN: 2321 9653; IC Value: 45.98; SJ Impact Factor: 7.538 Volume 10 Issue X Oct 2022 Available at www.ijraset.com
Above 40 16 12.2%
GENDER
Male
Female 125 23 83.3% 16.7%
Educational Qualification
Graduation
Post Graduation
PhD
Others
Occupation
Business People
Professionals
Retired
Others
Monthly Income
<30,000

30,000 60,000
60,000 90,000
>90,000
86 49 9 4
35 111 2 0
1 23 60 64
Descriptive Statistics
58.19% 33.1% 6.1% 2.7%

23.7% 75% 1.4% 0%
0.7% 15.5% 40.5% 43.3%
The above graph and table show how respondents are aware of Vue Residences. Through Digital Marketing, 66.4% of site visitors got to know about the Vue Residences and 33.6% of site visitors got to know about the Vue Residences through Traditional Marketing. So, Digital Marketing has a double impact on reaching Customers in this competitive Market.
ISSN: 2321 9653; IC Value: 45.98; SJ Impact Factor: 7.538 Volume 10 Issue X Oct 2022 Available at www.ijraset.com
2) Which Approach created interest in Vue Residences?


Which Approach created interest in Vue Residences? percentage
Traditional Marketing 19.3% 29 Digital Marketing 80.7% 119
No of Respondents
The above graph and table show which Approach created the interest in Vue Residences. With the help of Digital Marketing, 80.7% of site visitors were attracted to visit the Vue Residences and 19.3% of site visitors were attracted to visit the Vue Residences through Traditional Marketing. So, Digital Marketing has a higher impact on making the Customers visit the site in this competitive Market.
3) Did you Book a Site Visit for Vue Residences Online?
Descriptive Statistics

Did you Book a Site Visit for Vue Residences Online? percentage
YES 82.7% 123 NO 17.3% 25

No of Respondents
The above graph and table show how many customers booked online site visits. 82.7% of customers booked site visits online by filling out a form provided on the website and 17.3% of customers booked site visits through phone calls or other ways. So, the number of online site visits is more than offline site visits.
ISSN: 2321 9653; IC Value: 45.98; SJ Impact Factor: 7.538
Volume 10 Issue X Oct 2022 Available at www.ijraset.com
4) In the past, have you Brought any Real Estate Property (I.e., apartments, houses, villas, etc.)?
In the past, have you Brought any Real Estate Property (i.e., apartments, houses, villas, etc.)?
percentage No of Respondents
YES 31.3% 46 NO 68.7% 102
The above graph and table show, in the past customers, brought any real estate property or not. 68.7% of customers or site visitors have not brought any real estate property in past, whereas 31.3% of customers or site visitors have brought real estate property in past. So, the number of customers or site visitors is new to this market.
5) Which mode of Digital Marketing created interest in you?
Which Mode of Digital Marketing created interest in you? percentage


Google & Youtube ADS 51.3% 76


Facebook & Instagram ADS 28% 41 Others 20.7% 31
No of Respondents
The above graph and table show that the mode of Digital Marketing created interest in customers to visit the site. Google Ads & Youtube Ads created interest in 51.3% of customers to book a site visit to Vue Residences and Facebook Ads & Instagram Ads created interest in 28% of customers to book a site visit. So, a Maximum number of site visitors visit the site through the interest created by the advertisements running on Google, Youtube, Facebook & Instagram platforms.
6) What kind of Advertisements makes people visit the Website?
ISSN: 2321 9653; IC Value: 45.98; SJ Impact Factor: 7.538 Volume 10 Issue X Oct 2022 Available at www.ijraset.com
What Kind of Advertisements makes people visit the Website? percentage No of Respondents

Image AD 38.7% 57 Video AD 61.3% 91


The above graph and table show that kind of Advertisements makes people visit the Website. Among 148 respondents, Image Ads made 38.7% of respondents land on the website and Video ads made 61.3% of respondents land on the website. So, a Maximum number of respondents are landed on the website through a video Ad.
7) Do you ever consider the advertisement displayed on your phone?
Descriptive Statistics
Do you ever consider the Advertisement displayed on your phone? percentage No of Respondents
YES 86% 127 NO 14% 21
As shown in the Graph and Table among 148 Respondents, 86% of respondents consider the Advertisements displayed on their phones, and 14% of respondents don’t consider the Advertisements displayed on their phones.
ISSN: 2321 9653; IC Value: 45.98; SJ Impact Factor: 7.538
Volume 10 Issue X Oct 2022 Available at www.ijraset.com
Do you use the internet? Respondents
1 star 2 stars 3 stars 4 stars 5 stars
Total Respondents Mean
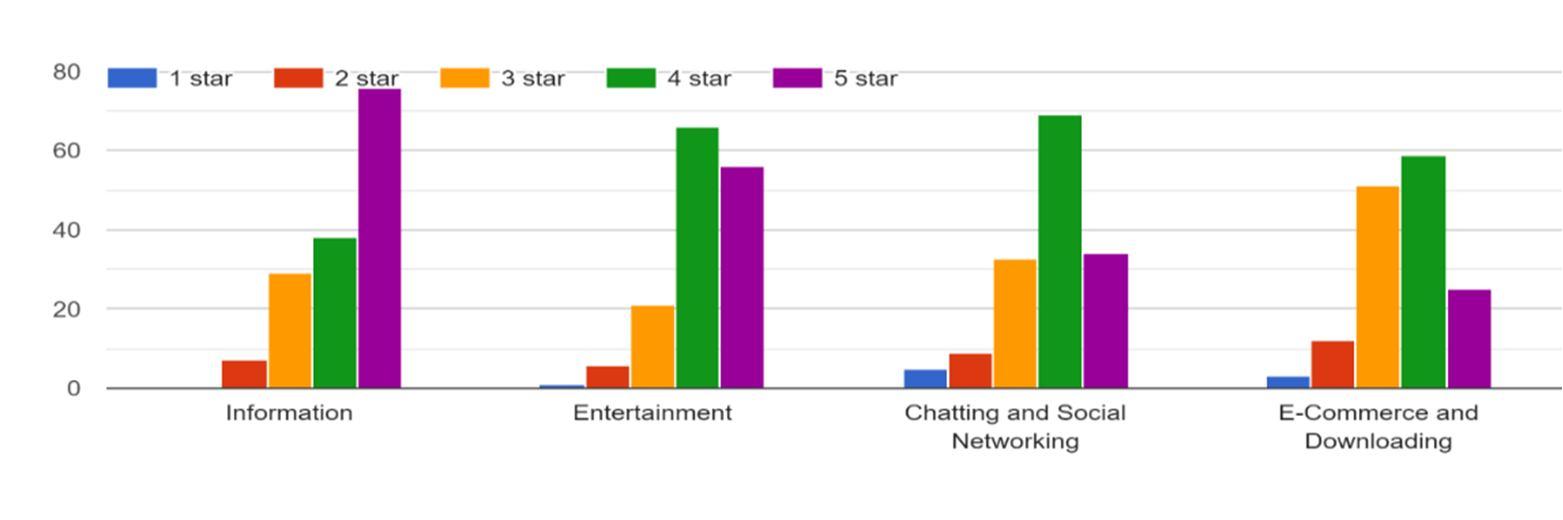
Information 0 7 29 37 75 148 4.2 Entertainment 1 6 21 65 55 148 4.1 Chatting and Social Networking 5 9 33 67 34 148 3.8 E Commerce and Downloading 3 12 51 57 25 148 3.6
Note: 1star = 1, 2star = 2, 3star = 3, 4star = 4, 5star = 5
The five point Likert scale is considering an interval scale. The mean is very significant. From 1 to 1.8, it means 1star. From 1.8 to 2.6, it means 2star. From 2.6 to 3.4, it means 3star. From 3.4 to 4.2, it means 4star. From 4.2 to 5, it means 5star. The above graph and table show the purpose of utilizing the internet by the respondents. The mean of the first statement is 4.2, which means that the majority of the respondents rated Information with 5 stars. The mean of the second statement is 4.1, which means that the majority of the respondents rated Entertainment with 4 stars. The mean of the third statement is 3.8, which means that the majority of the respondents rated Chatting and Social media networking with 4 stars. The mean of the fourth statement is 3.6, which means that the majority of the respondents rated e Commerce and Downloading with 4 stars. So, Respondents using the internet mostly to get information and entertainment and also use the internet for chatting, social networking, e Commerce, and downloading but not much as compared with information and entertainment. 9)
Descriptive Statistics
Platforms Respondents
ISSN: 2321 9653; IC Value: 45.98; SJ Impact Factor: 7.538 Volume 10 Issue X Oct 2022 Available at www.ijraset.com
Total Respondents Mean
1 star 2 stars 3 stars 4 stars 5 stars
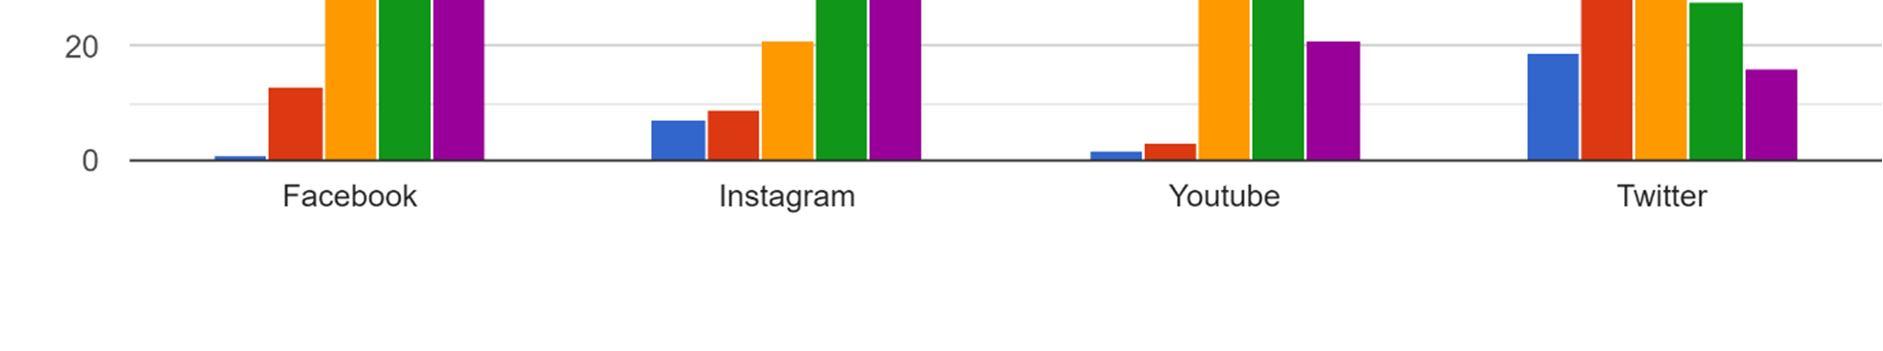
Facebook 1 13 48 50 36 148 3.72
Instagram 7 9 21 45 66 148 4.04 Youtube 2 3 46 76 21 148 3.75 Twitter 19 40 45 28 16 148 2.88
Note: 1star = 1, 2star = 2, 3star = 3, 4star = 4, 5star = 5
The five point Likert scale is considering an interval scale. The mean is very significant. From 1 to 1.8, it means 1star. From 1.8 to 2.6, it means 2star. From 2.6 to 3.4, it means 3star. From 3.4 to 4.2, it means 4star. From 4.2 to 5, it means 5star. The above graph and table show the rating of the social media platforms provided by the respondents. The mean of the first statement is 3.7, which means that the majority of the respondents rated Facebook with 4 stars. The mean of the second statement is 4, which means that the majority of the respondents rated Instagram with 4 stars. The mean of the third statement is 3.8, which means that the majority of the respondents rated Youtube with 4 stars. The mean of the fourth statement is 2.9, which means that the majority of the respondents rated Twitter with 3 stars. So, Instagram & Facebook is the most rated social media platform by the respondents, followed by YouTube. Twitter is the less rated social media platform by the respondents.
Descriptive Statistics
Search Engines Respondents
1 star 2 stars 3 stars 4 stars 5 stars
Total Respondents Mean
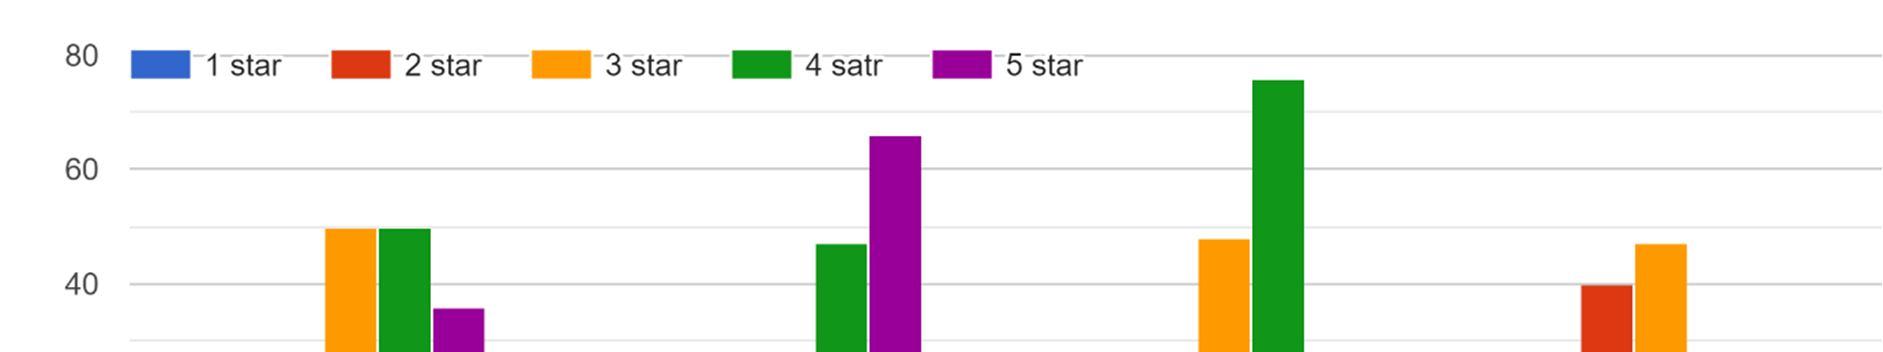
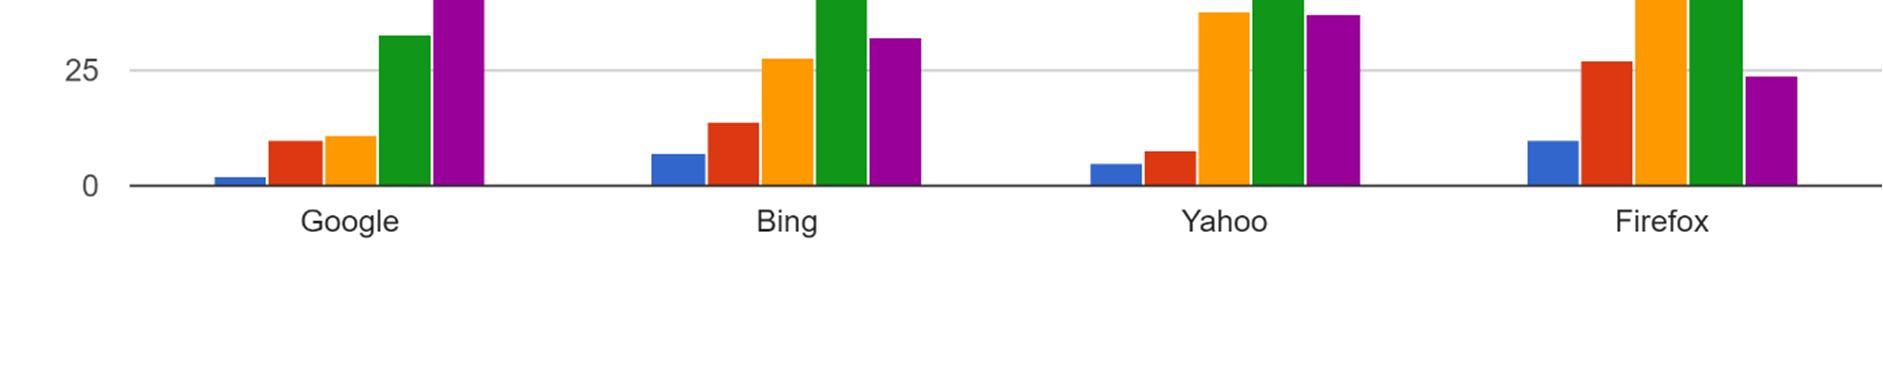
Google 2 10 9 33 94 148 4.4
Bing 7 14 28 69 30 148 3.68 Yahoo 5 8 38 60 37 148 3.78 Firefox 10 27 45 42 24 148 3.29
Note: 1star = 1, 2star = 2, 3star = 3, 4star = 4, 5star = 5
ISSN: 2321 9653; IC Value: 45.98; SJ Impact Factor: 7.538 Volume 10 Issue X Oct 2022 Available at www.ijraset.com
The five point Likert scale is considering an interval scale. The mean is very significant. From 1 to 1.8, it means 1star. From 1.8 to 2.6, it means 2star. From 2.6 to 3.4, it means 3star. From 3.4 to 4.2, it means 4star. From 4.2 to 5, it means 5star. The above graph and table show the rating of the search engines provided by the Respondents. The mean of the first statement is 4.4, which means that the majority of the respondents rated Google with 5 stars. The mean of the second statement is 3.7, which means that the majority of the respondents rated Bing with 4 stars. The mean of the third statement is 3.8, which means that the majority of the respondents rated Yahoo with 4 stars. The mean of the fourth statement is 3.3, which means that the majority of the respondents rated Firefox with 3 stars. So, Google is the most rated Search engine by the respondents, followed by Yahoo and Bing. Firefox is the less rated Search engine by the respondents.
11) Where you come Across a lot of Advertisements while using Apps
Descriptive Statistics
Where you come across a lot of Advertisements while using Apps?
Respondents Total Respondents Mean 1 star 2 stars 3 stars 4 stars 5 stars
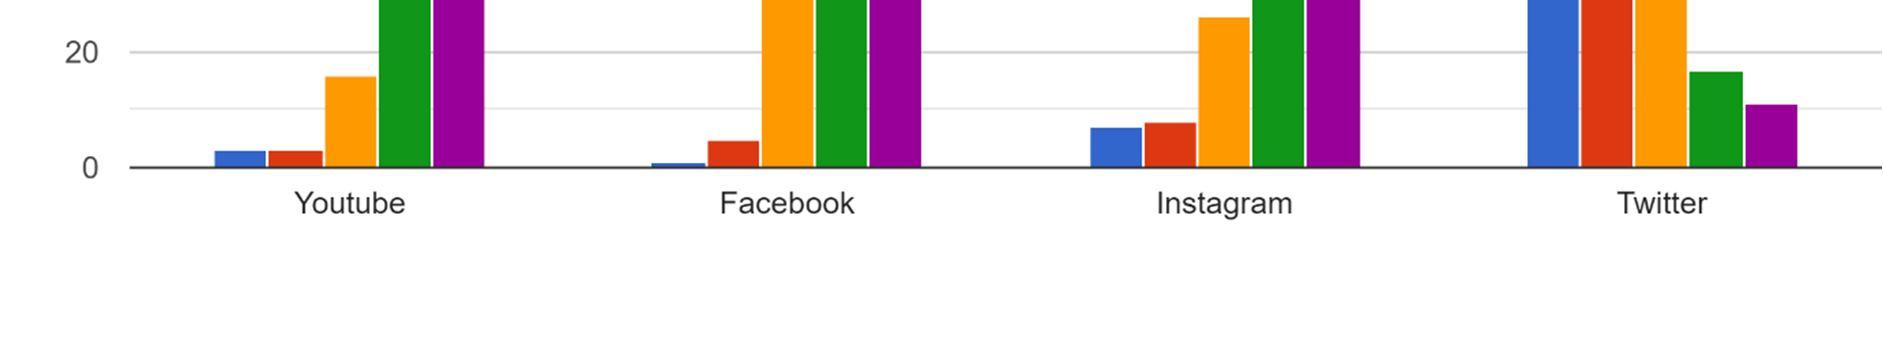
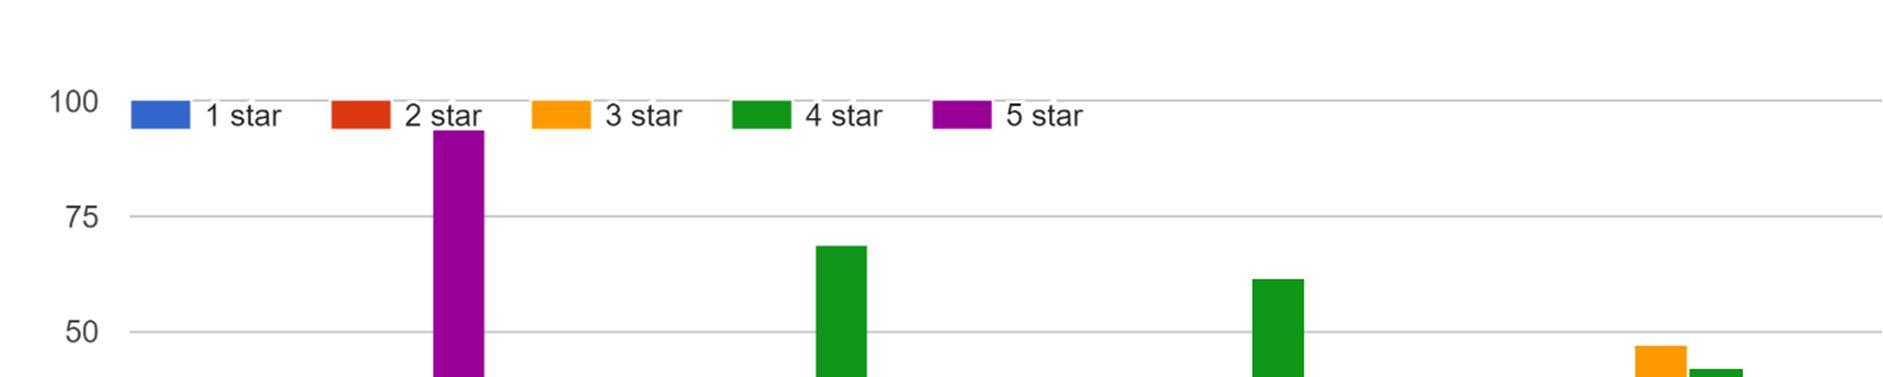
Youtube 3 3 16 53 73 148 4.28 Facebook 1 5 65 45 32 148 3.69 Instagram 7 8 24 62 47 148 3.91 Twitter 33 59 28 17 13 148 2.49
Note: 1star = 1, 2star = 2, 3star = 3, 4star = 4, 5star = 5
The five point Likert scale is considering an interval scale. The mean is very significant. From 1 to 1.8, it means 1star. From 1.8 to 2.6, it means 2star. From 2.6 to 3.4, it means 3star. From 3.4 to 4.2, it means 4star. From 4.2 to 5, it means 5star. The above graph and table show Respondents come across a lot of advertisements while using Apps. The mean of the first statement is 4.3, which means that the majority of the respondents rated Youtube with 5 stars. The mean of the second statement is 3.7, which means that the majority of the respondents rated Facebook with 4 stars. The mean of the third statement is 3.9, which means that the majority of the respondents rated Instagram with 4 stars. The mean of the fourth statement is 2.5, which means that the majority of the respondents rated Twitter with 2 stars. So, most of the respondents come across a lot of advertisements while using youtube, followed by Instagram, and Facebook, and there come across fewer advertisements while using Twitter.
ISSN: 2321 9653; IC Value: 45.98; SJ Impact Factor: 7.538
Volume 10 Issue X Oct 2022 Available at www.ijraset.com
12) Are you satisfied with the Specifications and Amenities provided by the company?
Are you Satisfied with the Specifications and Amenities Provided by the Company?

percentage No of Respondents
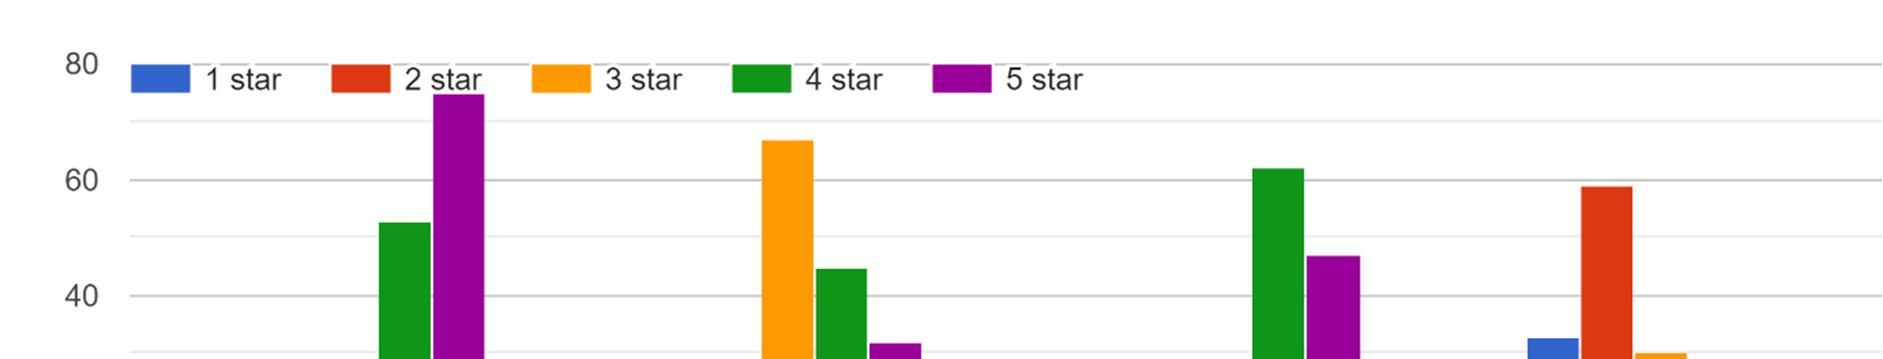
Very satisfied 26% 38 Satisfied 46.7% 69 Neutral 22.7% 34 Dissatisfied 4.7% 7 Very dissatisfied 0% 0


Note: Strongly Agree 1, Agree 2, Neutral 3, Disagree 4, Strongly Disagree 5
Mean 2.067568
The five point Likert scale is considering an interval scale. The mean is very significant. From 1 to 1.8, it means very satisfied. From 1.8 to 2.6, it means satisfied. From 2.6 to 3.4, it means neutral. From 3.4 to 4.2, it means dissatisfaction. From 4.2 to 5, it means strongly dissatisfied. The above graph and table show customers’ satisfaction with the Specifications and Amenities provided by the company. Among 148 respondents, 38 respondents are very satisfied and 69 respondents are satisfied with the Specifications and Amenities provided by the company and 34 respondents are neutral and 7 respondents are dissatisfied with the Specifications and Amenities provided by the company.
Mean 2.1 is close to Satisfied, so we can say that Majority of the respondents are satisfied with the Specifications and Amenities provided by the Company.
13) Informative Content should be displayed in the Advertisements!
ISSN: 2321 9653; IC Value: 45.98; SJ Impact Factor: 7.538 Volume 10 Issue X Oct 2022 Available at www.ijraset.com
Descriptive Statistics
Informative Content should be displayed in the Advertisements! percentage No of Respondents
Strongly Agree 30% 44 Agree 46.7% 69 Neutral 21.3% 32 Disagree 2% 3 Strongly disagree 0% 0
Note: Strongly Agree 1, Agree 2, Neutral 3, Disagree 4, Strongly Disagree 5 Mean 1.959459
The five point Likert scale is considering an interval scale. The mean is very significant. From 1 to 1.8, it means strongly agree. From 1.8 to 2.6, it means agree. From 2.6 to 3.4, it means neutral. From 3.4 to 4.2, it means disagree. From 4.2 to 5, it means strongly agree.
The above graph and table show customers’ perception of the statement “Informative content should be displayed in the advertisements”. Among 148 respondents, 113 respondents are satisfied with the statement and 32 respondents are neutral about the statement.
Mean 2 is close to Agree, so we can say that most of the respondents agree with the Statement.
14) Digital channels will change your Opinion toward Buying Decisions.
Descriptive Statistics
Digital channels will change your opinion toward the buying decisions
percentage No of Respondents
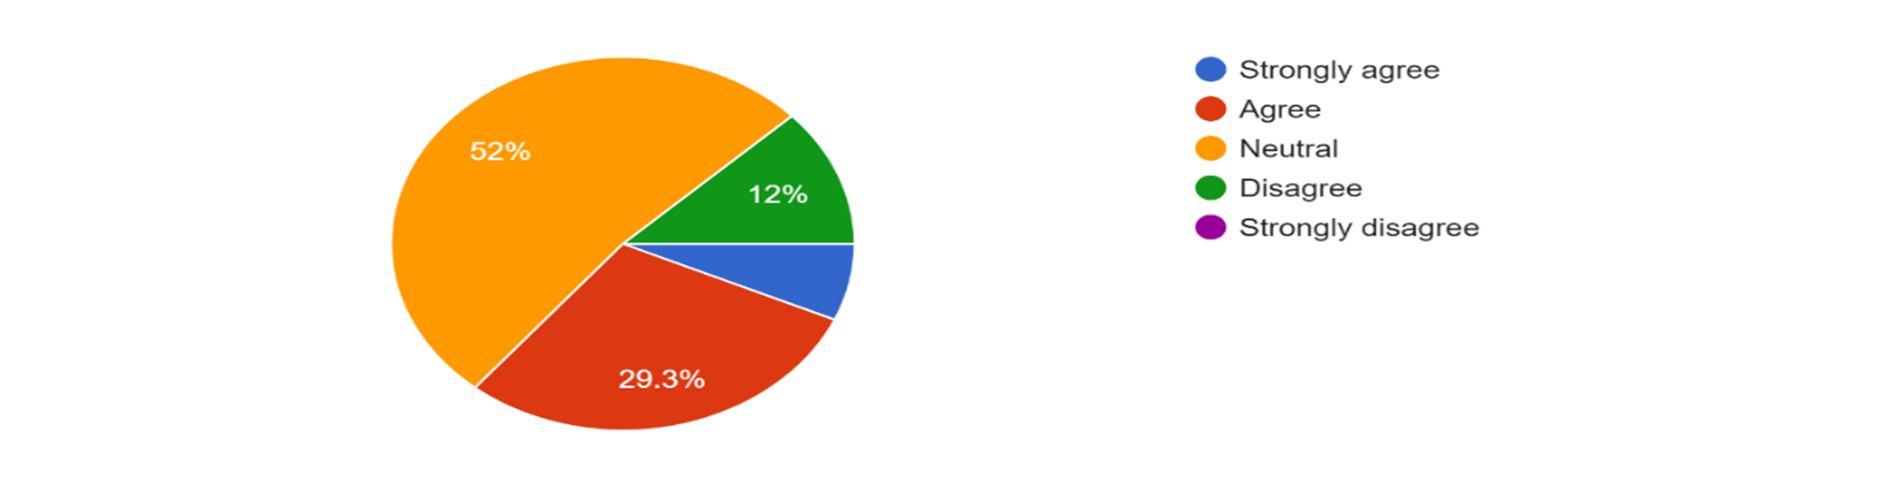
Strongly Agree 6.7% 10 Agree 29.3% 44 Neutral 52% 77 Disagree 12% 17 Strongly disagree 0% 0
Note: Strongly Agree 1, Agree 2, Neutral 3, Disagree 4, Strongly Disagree 5
Mean 2.682432
The five point Likert scale is considering an interval scale. The mean is very significant. From 1 to 1.8, it means strongly agree. From 1.8 to 2.6, it means agree. From 2.6 to 3.4, it means neutral. From 3.4 to 4.2, it means disagree. From 4.2 to 5, it means strongly agree.
ISSN: 2321 9653; IC Value: 45.98; SJ Impact Factor: 7.538
Volume 10 Issue X Oct 2022 Available at www.ijraset.com
The above graph and table show that digital channels influence customer buying behavior. Among 148 respondents, 54 respondents are agreeing and 77 respondents are neutral and 17 respondents are disagreeing that digital channels change the opinion towards buying decisions. Mean 2.7 is close to Neutral, so we can say that most of the respondents are Neutral about the Statement.
A. Digital marketing has a greater future in the present market.
B. Ratio of male customers is very high in visiting Vue residences is 83.3%.
C. Income of respondents mainly falls in the range of Rs. 60,000 to Rs. 90,000 that is 40.5% & above 90,000 that is 43.3%.
D. The majority of respondents are professionals (75%) and business people (23.7%).
E. Digital Marketing has a double impact on reaching Customers in this competitive Market.
F. With the help of Digital Marketing, 80.7% of site visitors were attracted to visit the Vue Residences and 19.3% of site visitors were attracted to visit the Vue Residences through Traditional Marketing. So, Digital Marketing has a higher impact on making the Customers visit the site in this competitive Market.
G. 68.7% of customers or site visitors have not brought anyreal estate propertyin past. So, the number of customers or site visitors are new to this market.
H. Maximum number of site visitors visit the site through the interest created by the advertisements running on Google, Youtube, Facebook & Instagram platforms.
I. Video ads are more effective than image ads.
J. 86% of respondents consider the Advertisements displayed on their phones.
K. Respondents using the internet mostly to get information and entertainment and also use the internet for chatting, social networking, e Commerce, and downloading but not much as compared with information and entertainment.
L. Instagram & Facebook is the most rated social media platform by the respondents, followed by YouTube. Twitter is the less rated social media platform by the respondents.
M. Google is the most rated Search engine by the respondents, followed by Yahoo and Bing. Firefox is the less rated Search engine by the respondents.
N. Most of the respondents come across a lot of advertisements while using youtube, followed by Instagram, and Facebook, and there come across fewer advertisements while using Twitter.
O. Majority of the respondents are satisfied with the Specifications and Amenities provided by the Company.
P. Most of the respondents agree with the Statement i.e., informative content should be displayed in advertisements.
Q. Most of the respondents are Neutral about the Statement i.e., digital channels change your opinion toward the buying decisions.
A. Improve technical advancement in the promotion of Vue residences.
B. Collect and implement the feedback provided by the customer in the right way.
C. Provide a transparent and good service to the customer.
D. Creating more awareness campaigns to reach more people.
E. Complete description needs to provide about the projects on the Vue residences website to the online visitors.
F. Should target more professional and business people.
G. Should concentrate more on video ads in order to attract more site visits.
H. Run more campaigns on Google and Facebook.
I. Should focus on the Ad Copy (content) used for the Advertisements.
This study helps to understand the customer perception towards residential real estate and the targeted audience. Digital marketing methods influence more on customers. It’s very helpful to make changes in the digital marketing strategy developed for Vue residences. Digital marketing plays a vital role in order to promote any business and it has more impact on customer behavior. Every business should go for business marketing in order to promote their business because internet users are increasing day by day, which improved the importance of digital marketing. The look is made in a particular geographical vicinity the outcomes of the look at famous that humans are aware of the virtual channels InSite in their educational qualification, clients use to prefer virtual channels to buy any sought merchandise, not a good deal role of monthly earnings of human beings performs a position deciding on a type product purchase through digital channels.