
10 VIII August 2022 https://doi.org/10.22214/ijraset.2022.46184

1Research Scholar, 3Professor, Department of Civil Engineering, Puducherry Technological University, Puducherry, India.
Abstract: In the recent years, settlement along the coastal stretch of Puducherry region are quiet in an alarming state which has degraded the entire coastal and the marine environment due to enormous anthropogenic activities carried out by the settlements for their livelihood beneficiaries .One of the major problem identified along the coastal areas of the Puducherry region at macro level are seawater intrusion at major settlement zones were erroneous pumping of ground water were done to meet out the demands of the settlements, which in turn has led to serious contamination by dissolved salts mixing into the available fresh water resources such as coastal aquifers which further demands sophisticated treatment processes. The aim of the present study is to analyze the collected water samples with respect to the seasonal variations from various identified aquifers of different geological formation and for its geo hydro chemistry and physico chemical parameters by acceptable procedures. From the results obtained, it was found that, dominant major and minor ions were present in the majority of aquifers in and around the Puducherry region. The presences of ions in the aquifers of Pondicherry coastal region are been represented in an ascending order such as: Na>Ca>Mg>K and HCO3>CL>SO4. Moreover, the characteristic Fluoride (F), Nitrate .
International Journal for Research in Applied Science & Engineering Technology (IJRASET) ISSN: 2321 9653; IC Value: 45.98; SJ Impact Factor: 7.538 Volume 10 Issue VIII August 2022 Available at www.ijraset.com 414©IJRASET: All Rights are Reserved | SJ Impact Factor 7.538 | ISRA Journal Impact Factor 7.894 |
Hydro and Geochemical Characteristics of Ground Water Assessment in Puducherry Coastal Stretch, Puducherry Region
Fresh water for human consumption has become a mirage in the recent times due to depletion of finite resource. The demand for fresh water increases with the growth in the human population. The only source for the fulfillment of potable water demand is the ground water which in the recent has been contaminated by various pollutants either directly or indirectly. Hence, it has become a prime requisite for the assessment of the ground water quality which helps to identify the significant parameters of getting better information about source of pollution (Vetrimurugan et al 2018).Moreover, the diversion of fresh water supply to agriculture, industrial and domestic needs stretches the hydrological systems to the maximum limitation. The compete for the fresh water demand within a nation varies both seasonally and geographically.
Considering the Indian Sub continent, the average climate of the regions are categorized as humid and tropical and receives an average annual rainfall of 1254 mm (1960 2010) which are mostly contributed by north east monsoon. Ground water occurrence in the region are as confined and unconfined conditions and are extracted by means of dug wells, dug cum bore wells and tube wells.
The concentration of industries and population in the urban area has led to heavy pollution in the coastal aquifers of the Puducherry region due to inadequate application of water management tool.
Keywords: Groundwater, Pysio chemical, Trace elemnt I. INTRODUCTION
C. Rajakannan1 , Dr. R. Suresh2 , Dr.Vijayakumar3
Ground Water is the backbone of Indian agriculture, drinking water security which contributes nearly 62% for irrigation, 85 % for rural water supply and 45% urban water demand. Groundwater an important resource requisite for the industrial sector in a large scale and if left unregulated may lead to serious inter sectorial conflicts. Hence growth in both agriculture and industry are the requirements for the growth of our nation and the system for proper regulated management of the groundwater resources has become a mandate, particularly the aquifers in different parts of the country. A serious groundwater crisis prevails currently in India due to excessive over extraction and groundwater contamination which covers nearly 60 percent of all districts in India and posing a risk to drinking water security of the population. In addition to over extraction, biological and chemical contamination and water logging also creates a serious problem in many regions, impacting livelihood security on the large sections of the society. The acute problems relating to groundwater warrant a change in both the perspective on our aquifers as well as the approach in the use and management of groundwater resources. It is necessary to acknowledge the hydrogeological Characteristics of groundwater and its integral link to land, vegetation and surface water resources and perceive it as a ‘resource’ rather than a ‘source’.
2Senior Scientific Officer, National Institute of Ocean Technology, Ministry of Earth Science, Government of India.

International Journal for Research in Applied Science & Engineering Technology (IJRASET) ISSN: 2321 9653; IC Value: 45.98; SJ Impact Factor: 7.538 Volume 10 Issue VIII August 2022 Available at www.ijraset.com 415©IJRASET: All Rights are Reserved | SJ Impact Factor 7.538 | ISRA Journal Impact Factor 7.894 | Agriculture being the major economic activity of rural population, it also has its imprint on the ground water quality pertaining to this Scantregion.attention has been so far carried out on ground water quality and quantity of Puducherry region. The aquifer of this region from the past few decades has been over stressed in order to meet the increase in demand for fresh water due to the non availability of surface water sources. The consequence of the above addressed problem has depleted the ground water resources and made a way to the increase in major trace element concentrations and salinity in ground water due to human interference, by means of industrial and agricultural activities. Reduction in the over exploitation of groundwater on the coastal well field will help to mitigate the seawater intrusion (Mohsen sheriff et al., (2011).Many wells have been terminated and numerous farms have been abounded during the last several years in the coastal area of the Puducherry region. The groundwater head due to pumping termination reached an average of about 30 m during dry seasons and about 10 m during wet seasons in this region. Various model studies (SWAT) were conducted on regions facing water quality problem to determine the sediments, and nutrient levels in watersheds (santhil et al., 2002).
From the observation on investigations made by several experts on the coastal water pollution it was reported that there is a vast deviation in the values of physico chemical characteristics of Groundwater (Francis Andrade et al., 2011).The reason for coastal aquifer pollution is mainly due to over exploitation which has pushed the water table to negative peizometric head and routed the sea water intrusion leading to increased salt content in the ground water and contaminates the source thereby making it abandoned .add on to the above phenomenon, the ground water contamination in this region are also due to the presence of the water sources in alluvial formation. Hence before reaching an alarming stage in the ground water source, proper planning is essential in this juncture to preserve the fragile ecosystem (Chidambaram et al., 2011).
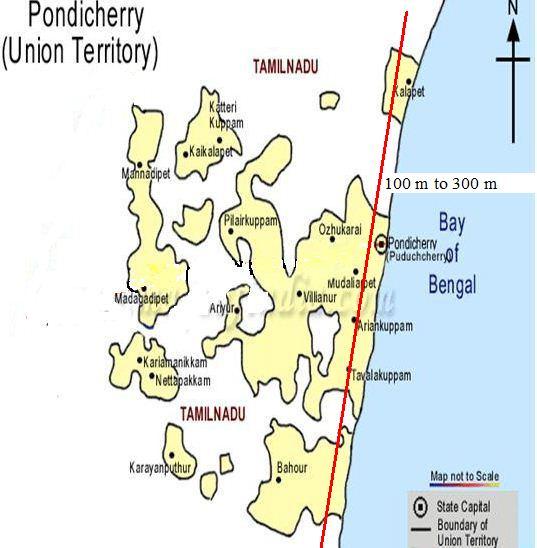
The Pondicherry Region located on the east coast of India forming enclaves within the Cuddalore District of Tamil Nadu. It is bounded by north latitudes 11° 45′ and 12° 03′ and east longitudes 79° 37′ and 79° 53′. The region is 293 km2 in extent consisting of 2 Municipalities, 5 commune pancayat and 179 villages. Gingee and Pennaiyar are the major rivers in Pondicherry region .The average annual rainfall in Pondicherry is 1254 mm. The groundwater level data collected from various monitoring wells in the study area during Pre Monsoon shows that the water level ranges between 5.18 m below ground level and 33 m deeper groundwater levels were observed in the central, north west and south western parts of the study area. Similar trend were also noticed during the Post Monsoon, except for the variation in groundwater level, which ranges between 4 m and 30 m.
II. STUDY AREA
A. Objective 1) To assess the spatial dispersion, migration and temporal variation of major elements in ground water of Puducherry region. 2) Establish the geochemical pattern of ground water. Fig. 1: Location of the water samples in Puducherry Coastal stretch.
results of
Fig. 2: Geological Map (source Chidambaram et al., 2011)
International Journal for Research in Applied Science & Engineering Technology (IJRASET) ISSN: 2321 9653; IC Value: 45.98; SJ Impact Factor: 7.538 Volume 10 Issue VIII August 2022 Available at www.ijraset.com 416©IJRASET: All Rights are Reserved | SJ Impact Factor 7.538 | ISRA Journal Impact Factor 7.894 |
TABLE I Chemical
The Puducherry region in general is a flat pen plain with an average elevation of 15 m above mean sea level. The terrain becomes a little undulating with prominent high grounds varying from 30 to 100m above mean sea level towards northwest and northeastern parts of the region. Three major physiographic units are generally observed, viz., (i) Coastal plain, (ii) Alluvial plain and (iii) Uplands. The coastal plain extends as a narrow stretch for about 22 km and of four to six hundred meters width on the eastern part of the region along the Bay of Bengal. The major part of the coastal plain comprises gently sloping land with a chain of sand dunes extending all along the coast.Fig.2 III. METHODOLOGY
samples for pre and post monsoon season Parameter Post Monsoon Pre Monsoon Maximum Minimum Maximum Minimum pH 8.88 6.92 7.85 5.00 TDS (mg/L) 1984 210 1887 135 EC (µS/cm) 3835 400 2900 342 Na (mg/L) 478 10 923 253 K (mg/L) 23 1 39 3 Mg (mg/L) 30 2 36 4 Ca (mg/L) 327 22 478 52 Cl (mg/L) 450 17 511 28 SO4 (mg/L) 948 18 523 15 HCO3 (mg/L) 2452 118 988 16 Hardness (mg/L) 1307 80 721 120 Fluoride (mg/L) 0.98 0.15 0.80 0.23 Iron (mg/l) 5.2 0.1 3.3 0.01 nitrate 47 1 38 2
Groundwater samples were collected from bore wells of the study area during pre monsoon and post monsoon of the year 2018 and 2019. Water samples are collected in polythene containers (washed thoroughly by using MilliQ water) from the selected zones of the study area. The samples were collected after pumping the wells for about 10 15 min and filtered as per standard APHA procedure (John and Dickerson 1993). pH, Electrical conductivity (EC), Salinity, and Total Dissolved solids are measured onsite using Hanna Water Analyzer. The collected water samples are brought to the laboratory and measured for chemical parameters like anions chloride (Cl), bicarbonate (HCO3), sulfate (SO4 ) and cations like sodium (Na), potassium (K), calcium (Ca) and magnesium (Mg). Ions such Na, K, Ca, Mg, Cl, F, Fe, NO3 and SO4 were analyzed. Quality of the data analyzed was done by analyzing blanks, standards and duplicates in between the sample analysis. 80% of samples were collected from the alluvium aquifer, the depth various from 90 m to 300 m. analysis water
B. Geology Of Area
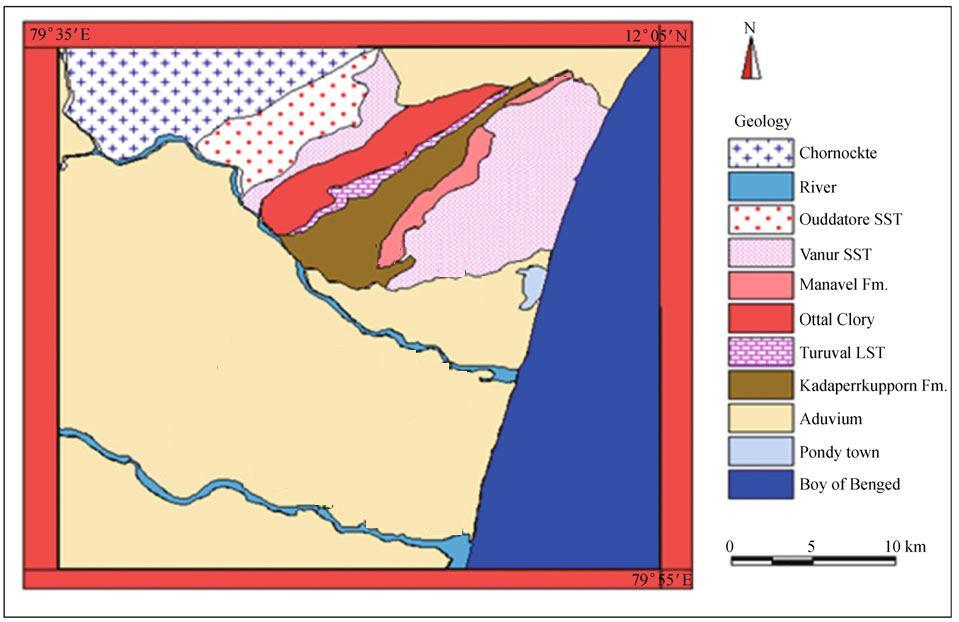
International Journal for Research in Applied Science & Engineering Technology (IJRASET) ISSN: 2321 9653; IC Value: 45.98; SJ Impact Factor: 7.538 Volume 10 Issue VIII August 2022 Available at www.ijraset.com 417©IJRASET: All Rights are Reserved | SJ Impact Factor 7.538 | ISRA Journal Impact Factor 7.894 | TABLE II Comparison of groundwater samples with BIS and WHO standards: Source WHO20117 and IS 10500 (2012) IV. RESULT AND DISCUSSION Source: CPWD report 1993, 2007. Parameter WHO Standards BIS standards pH 6.5 8.5 6.5 8.5 TDS (mg/l) 500 1,000 500 1000 Calcium (mg/l) 100 75 Magnesium (mg/l) 50 30 Chloride (mg/l) 250 200 Sulphate (mg/l) 250 200 Sodium (mg/l) 200 200 Potassium (mg/l) 20 20 Bicarbonate (mg/l) 125 350 125 350 Fluoride (mg/l) 1.0 1.5 Iron (mg/l) 0.1 1.0 Nitrates (mg/l) 45 45 Era Period Epoch Formations Lithology Cenozoic Quaternary Recent Alluvium, laterite Sands, clays ,silts, kankar and gravels, laterite. Unconformity Cenozoic Tertiary Palaeocene Manaveli Formation Yellow & yellowish brown, grey calcareous siltstones and claystone& shale with thin bands of limestone KadaperikuppamFormation Yellowish white to dirty white sand. Hard Fossiliferrous limestone, calcareous sandstone and clays Unconformity Mesozoic CretaceousUpper Thuruvai Formation Highly fossiliferous limestone, conglomerate at places, calcareous sandstone and clays OttaiClaystone Grey to grayish green claystones, silts with thin bands of sandy limestone and fine grained calcareous sandstone CretaceousLower Vanur Sandstone Quartzitic sandstone, hard coarse grained, occasionally feldspathic or calcareous with minor clays RamanathapuramFormation Black carbonaceous silty clays and fine to medium grained sands with bands of lignite and medium to coarse grained sandstone Unconformity Archaean Eastern Ghat complex Charnockite and Biotite hornblende gneisses
E. Total Hardness
F. Sodium And Potassium (Na And K)
D. Total Dissolved Solids (Tds)
The maximum permissible limit for sodium in groundwater is 200 mg/L as per WHO and BIS standard. (SarathPrasanth et al. 2012);(Ramesh and Elango2011). The concentration of sodium varied from 10 to 478 and 253 to 923 mg/L in pre monsoon and post monsoon respectively, in the area of interest (Table 1; Fig. 9).
B. pH. The acidic and alkaline properties of water are studied to evaluate the interaction of rock or other material with ground water. The permissible limit for pH as prescribed by WHO and Indian bureau standards for drinking water is 6.5 8. The pH in the collected samples of the study area ranges between 6.92 and 8.88 in pre monsoon (Table 1; Fig. 3) and between 5.00 and 7.85 in post monsoon.
A. Drinking Water Quality Water is one of the important sources for the diseases causing to human when consumed in its contaminated stage. For a sound mind and healthy body, water that we intake has to be in a good condition as per the accepted standards of potable water. In nature, water is composed of major and minor ions, dissolved gases and microorganisms. When these major and minor ions, dissolved gases and the disease causing microorganisms exceeded a permissible limit than the water is said to be unfit for drinking and other domestic purposes. This limit for individual parameters has been fixed based on its effect when it is excess or less in concentration as suggested by World Health Organization (WHO 2017) and Bureau of Indian standards 10500 2012 (Table 2).
C. Electrical Conductivity (Ec) The Electrical conductance of water increases with increase in concentration of Total dissolved solid in water. In the study area, EC measured ranges from 400 to 3835 µS/cm and 342 to 2900 µS/cm in pre monsoon and post monsoon, respectively (Table 1; Fig. 4).
The total hardness for water samples was determined using the expression Total hardness = 2.5 Ca + 4.1 Mg Based on TDS, the groundwater suitability for various purposes has been classified as in (Table 3; Fig. 5). Thepermissible level for TDS in groundwater is 1000 mg/ L as suggested by WHO and BIS standards for water samples (WHO, 2017 and BIS, 2012). 90 and 86.4% of samples were suitable for drinking in pre monsoon and post monsoon respectively; 6 and 11.8% of samples were under permissible level and suitable for drinking purposes; 4 and 7.5% of samples were not suitable for drinking. TDS varies from 210 to 1984 mg/L in pre monsoon and from 135 to 1887 mg/L in post monsoon. Higher Total Dissolved solids content may be due to improper sewage disposal, lesser pH with higher mineral dissolution, seawater intrusion (SarathPrasanth et al. 2012; SubbaRao2001); senthil et al 2017.
The above methodology, the groundwater samples have been collected and analysed for different parameters to evaluate the Safe drinking water is required for all usual domestic purposes, including drinking, food preparation and personal hygiene. The results obtained are discussed in Table 1.
The total hardness of the water samples ranges from 80 to 1353 and 120 to 721 mg/L in both the seasons (Table 1; Fig. 12). The water samples have been classified as soft, moderately hard, hard and very hard as mentioned in the table above. Among the water samples collected, 2 and 1% of water samples are harder in pre and post monsoon. Karasur, Aryankuppam, velrampetThengaithittu, ECR lawspetMannadipet and kalapet are the locations showing high hardness above the permissible limit. Most of the water samples of the area of study were soft with hardness less than 500 mg/L
The WHO and BIS standard for EC is 1500 µS/cm to 3000 µS/cm (WHO, 2017 and BIS 2012). The 68.4 and 70% of groundwater samples are less than 1300 µS/cm in pre monsoon and post monsoon respectively, indicating type 1 where the salt enrichment is low. Totally, 30.6 and 33.33% of samples EC were in medium range between 1400 and 3000 µS/cm in pre monsoon and post monsoon respectively, falling in type 2 category indicating medium salt enrichment (SarathPrasanth et al. 2012). And 8.2 and 13.33% of pre and post monsoon samples fall under type 3 indicating very high salt enrichment. Samples falling under type 2 and type 3 category show that medium to high enrichment of salts with higher EC may be due to seawater intrusion, effect of pH and intense long term agricultural practices in the area of study (SarathPrasanth et al. 2012).
International Journal for Research in Applied Science & Engineering Technology (IJRASET) ISSN: 2321 9653; IC Value: 45.98; SJ Impact Factor: 7.538 Volume 10 Issue VIII August 2022 Available at www.ijraset.com 418©IJRASET: All Rights are Reserved | SJ Impact Factor 7.538 | ISRA Journal Impact Factor 7.894 |
K. Fluoride (F) It ranges from 0.8 to 0.02 mg/l as per WHO and BIS standard the permissible level of fluoride in drinking water is 1.0 to 1.5 mg/l. but the water sample is within the limit. It will increase by the human and natural activities in the ground water. Based on the geological condition of the aquifer. It seems higher in the mentioned areas in both seasons Odiyabpet. Villiyanur, Velrampet, Thengaithiittu.
H. Chloride (Cl2 )
L. Iron (Fe) “Iron is the second most abundant metal in the earth's crust. Dissolved iron in water, causes the water to taste metallic”.The water may also be discolored due to suspended solids containing minerals of iron that appearbrownish in color. It ranges in 5.2 to 0 mg/l and 3.8 to 0.01 mg/l in both the seasons. Velrampet, Thengaithittu, Veerammpaittenam, Pillaichavady. These area were higher in the both the season. Fig: 3 Fig: 4
International Journal for Research in Applied Science & Engineering Technology (IJRASET) ISSN: 2321 9653; IC Value: 45.98; SJ Impact Factor: 7.538 Volume 10 Issue VIII August 2022 Available at www.ijraset.com 419©IJRASET: All Rights are Reserved | SJ Impact Factor 7.538 | ISRA Journal Impact Factor 7.894 | Mattupalayam, Molakulam, Manadipet, Thengaithittu, kalapet and Pudukuppam are the locations where concentration of sodium is higher than the prescribed standards both in pre monsoon and post monsoon, respectively. The concentration of sodium above permissible level leads to salty taste and health hazards like blood pressure, kidney stones, arteriosclerosis, edema and Potassiumhyperosmolarityisgenerally
J. Bicarbonate (HCO3 ) The HCO3 concentrations in the study area were found 118 to 2452 mg/L in the pre monsoon and 16 to 988 mg/L in the post monsoon. The excess amount of bicarbonate shown in the study area was denoted that the amount of bicarbonate producing mineral presented in the aquifer (Table 1; Fig.13).
G. Calcium And Magnesium (Ca2+ & Mg2+) It ranges from 327 to 22 and 478 to 52 mg/L in pre monsoon and post monsoon season (Table 1; Fig. 7) of the study site. in pre monsoon and Pillaichavady and Radhakrishnan nagar, in post monsoon are the two locations exceeding the permissible limit and Thengaithittu, Velrampet, villinur. The maximum permissible level for calcium in groundwater is 75 mg/L as per WHO and BIS standards for groundwater. The many intention of magnesium in the water samples is presents of ferromagnesian minerals due to the existing formation. Concentration of magnesium level in water sample were 2 to 30 and 4 to 36 mg/L in pre monsoon and post monsoon. In these seasons(Table 1; Fig. 8) most of the samples exceeded from the guide values in the code. Magnesium in higher level will give to unpleasant taste to the water samples.
Chloride concentration in the study area was found 17 to 450 mg/L in the pre monsoon and 28 to 511 mg/L in the post monsoon (Table 1; Fig. 11). As per WHO and BIS the desirable limit of chloride is 250 mg/L and permissible level is 1000 mg/L. some of the place the chloride concentration were found higher from the permissible limits show that salt water intrusion.
I. Sulphate (SO4 )
very low in groundwater samples and there is no separate permissible limit for it. It ranges from 1 to 23 mg/L and 3 to 39 mg/L in both pre monsoon and post monsoon respectively (Table 1; Fig. 10).
Sulfate concentration in the study area was found 18 to 948 mg/L in the pre monsoon and 15 to 523 mg/L in the post monsoon (Table 1; Fig.13). As per WHO and BIS the desirable limit of sulfate is 200 mg/L and permissible level is 400 mg/L. some of the place the sulfate level were found higher than the permissible limits it denoted the improper disposable of wastewater and availability sulphide minerals in the groundwater.
International Journal for Research in Applied Science & Engineering Technology (IJRASET) ISSN: 2321 9653; IC Value: 45.98; SJ Impact Factor: 7.538 Volume 10 Issue VIII August 2022 Available at www.ijraset.com 420©IJRASET: All Rights are Reserved | SJ Impact Factor 7.538 | ISRA Journal Impact Factor 7.894 | Fig: 5 Fig: 6 Fig: 7 Fig: 8 Fig: 9 Fig: 10 Fig: 11 Fig: 12
[5] BIS standard 10500 2012.
This forms part of an ongoing research of the first author, under the guidance of the senior authors. The cooperation and facilities extended by the department and institution are gratefully acknowledged.
[3] Ahmad ZaharinAris, et al, “The Influence of Seawater on the Chemical Composition of Groundwater in a Small Island: The Example of Manukan Island, East Malaysia”, Journal of Coastal Research, 28 1 64 75 West Palm Beach, Florida January 2012.
The superiority of groundwater for inland and cultivated purposes of Puducherry coastal stretch bore water. From the above study, it is inferred that the abundance of major and minor ions was in the order of Na>Ca>Mg>K = Cl>SO4>HCO3 in pre monsoon and post monsoon. The concentration of major and minor ions was found to be very complex than the permissible limit which may be due to saltwater intrusion, inorganic suspension, extreme agricultural observes and inadequate sewage disposal. The electrical conductivity and total dissolved solids of the water samples were permissible for drinking purposes. The hardness of the water samples was less than 80 mg/L specifying soft the aquifer water is safe to consumption. Totally the groundwater is mostly safe and suitable for consumption and domestic drives but in few locations. The Fluoride (F) level seem little higher in some of the bore hole sample near the coastal stretch. The level of fluoride is 0.8 mg/l to 0.02 mg/l. The Natural contamination of groundwater by fluoride causes irreparable damage to plant and human health. High oral intake of fluoride results in physiological disorders, skeletal and dental fluorosis, thyroxin changes and kidney damage in humans. The level of Iron is higher than the permissible limit near the coastal stretch 5.2 mg/l to 0.01 mg/l. chronic iron overload results primarily from a genetic disorder (hemochromatosis) characterized by increased iron absorption and from diseases that require frequent transfusions.
[2] Abdul Jameelet al, “Studies on heavy metal pollution of ground water sources between Tamilnadu and Pondicherry, India”, Advances in Applied Science Research, 2012, 3 (1):424 429
VI. ACKNOWLEDGMENT
[1] APHA (2017) Standard Methods for the Examination of Water manual 23rd edition.
REFERENCES
International Journal for Research in Applied Science & Engineering Technology (IJRASET) ISSN: 2321 9653; IC Value: 45.98; SJ Impact Factor: 7.538 Volume 10 Issue VIII August 2022 Available at www.ijraset.com 421©IJRASET: All Rights are Reserved | SJ Impact Factor 7.538 | ISRA Journal Impact Factor 7.894 | Fig: 13 Fig. 14 Fig. 16 V. CONCLUSIONS
[4] Alexandra Gemitzi, et al, “Seawater intrusion into groundwater aquifer through a coastal lake complex interaction characterised by water isotopes 2H and 18O”, Isotopes in Environmental and Health Studies, 2014 Vol. 50, No. 1, 74 87.
[33] Vijayakumar.G, et al,”Studies on the pollution level in Ariyankuppam back water Puducherry region”, International Journal of Science, Environment and Technology, Vol. 1, No 5, 2012.
[6] Central Ground Water Board (CGWB) report 2017.
International Journal for Research in Applied Science & Engineering Technology (IJRASET)
[8] Deepthi. K, Ushanatesan et al,”Geochemical characteristics and depositional environment of kalpakkam, south east coast of India”Nov 2012.
[25] Srinivasamoorthy, et al, “Characterisation of Groundwater Chemistry in an Eastern Coastal Area of Cuddalore District, Tamil Nadu”, Journal Geological Society Of India, Vol.78, December 2011, Pp.549 558.
[30] Suresh Nathan, et al, “Spatial Variability of Ground Water Quality Using HCA, PCA and MANOVA at Lawspet,Puducherry in India” ISSN Online: 2168 1570ISSN Print: 2168 1562.
[34] WHO (2017) Guidelines for drinking water quality, 4th edn. 1st addendum, World Health Organization, Geneva.
[23] Solai. A, et al, ”Implications of physical parameters and trace elements in surface water off Pondicherry, Bay of Bengal ,South East coast of India,”2010.
422
[16] Palanisamy, et al, ”Assessment of the levels of coastal marine pollution of Chennai city, Southern India”, Water Resour Manage 11269 006 9075 6, July. 2007. and Francisco Batl [17] Prabir Kumar, et al,” Methodology for ground water extraction in the coastal aquifers of purbamidnapur district of west Bengal in India under the constraint of saline water intrusion “, mar 2017.
[7] Chandrasekar. A, et al, ”Assessment of heavy metal distribution pattern in the sediments of tamirabharani river and estuary, east coast of Tamil Nadu, India” August 2014.
[11] Francis, et al, ”Studies on mangalore coastal water pollution and its sources”May 2011.
[18] SanthaSophiya, et al,”Assessment of vulnerability to sea water intrusion and potential remediation measures for coastal aquifers:A case study from eastern India”.December 2012. [19] SarathPrasanth, et al, “Evaluation of groundwater quality and its suitability for drinking and agricultural use in the coastal stretch of Alappuzha District, Kerala, India”, Appl Water Sci (2012) 2:165 175 DOI 10.1007/s13201 012 0042 5.
[10] D.M. Han, et al, “Chemical and isotopic constraints on evolution of groundwater salinization in the coastal plain aquifer of Laizhou Bay, China”, Journal of Hydrology 508 (2014) 12 27.
[22] Singaraja. C, et al,”A study on the status of salt water intrusion in the coastal hard rock aquifer of south India” June 2014
[24] Sridharan. M, “Ground water quality assessment for domestic and agriculture purpose in Pondicherry region”, mar 2017.
[14] Logachandirane.R, et al, ”Studies on the Pollution Status of Thengaithittu Fishing Harbour, Puducherry, India” International Journal for Scientific Research & Development Vol. 5, Issue 02, 2017 [15] Melloul. A.J, and L.C.Goldenberg,”Monitoring of sea water intrusion in coastal aquifers:Basics and local concerns”May 1997.
[20] Senthilnathan.D, et al, ”Trace elements in ground water of coastal aquifers of Pondicherry region, India”, Journal of Environment (2012), Vol. 01, Issue 04, pp. 111 118
[21] Shomar. B, ”Ground water contaminations and health perspectives in developing world case study :Gaza strip”June 2010.
[27] Srivastava. B.J, et al, ”Geomagnetic coast and other effects deduced from the new observatory at visakhapatnam,India”September 2000.
[9] Duraisamy.A and S.Latha,”Impact of pollution on marine environment A case study of coastal chennai”, 2011.
[31] Thilagavathi. et al,” A study on ground water geochemistry and water quality in layered aquifers system of Pondicherry region, south east India”, Appl Water Sci 2:253 269 May 2012.
[29] S. Suma Latha, etal, “Fluoride contamination status of groundwater in Karnataka”http://www.iisc.ernet.in/currsci/mar25/articles13.htm 20 March 2011.
ISSN: 2321 9653; IC Value: 45.98; SJ Impact Factor: 7.538 Volume 10 Issue VIII August 2022 Available at www.ijraset.com ©IJRASET: All Rights are Reserved | SJ Impact Factor 7.538 | ISRA Journal Impact Factor 7.894 |
[12] HAROLD, HENRY, “Salt Intrusion into Fresh Water Aquifers”, Journal Of Geophysical Research Volume 64, No. 11 November, 1959 [13] Kalyanasundaram.V, et al, ”Vulnerability assessment of sea water intrusion and effect of artificial recharge in Pondicherry coastal region using GIS”. Indian Journal of Science and Technology Vol.1 No 7 (Dec. 2008)
[26] Srinivasamoorthyet al, “Hydrochemistry of groundwater in a coastal region of Cuddalore district, Tamilnadu, India:implication for quality assessment”, Arab J Geosci DOI 10.1007/s12517 011 0351 2.
[28] Subrao, et al, “Geochemistry of groundwater in parts of Guntur district, Andhra Pradesh, India. Springer Verlag 14 November 2001.
[32] VetrimuruganElumalai, et al,”Spatial interpolation methods and geostatisticsfor mapping groundwater contamination in a coastal area”, Environ SciPollut DOI 10.1007/s11356 017 8681 6.