
10 VIII August 2022 https://doi.org/10.22214/ijraset.2022.46293

A. Deforestation Due To Rapid Urbanization
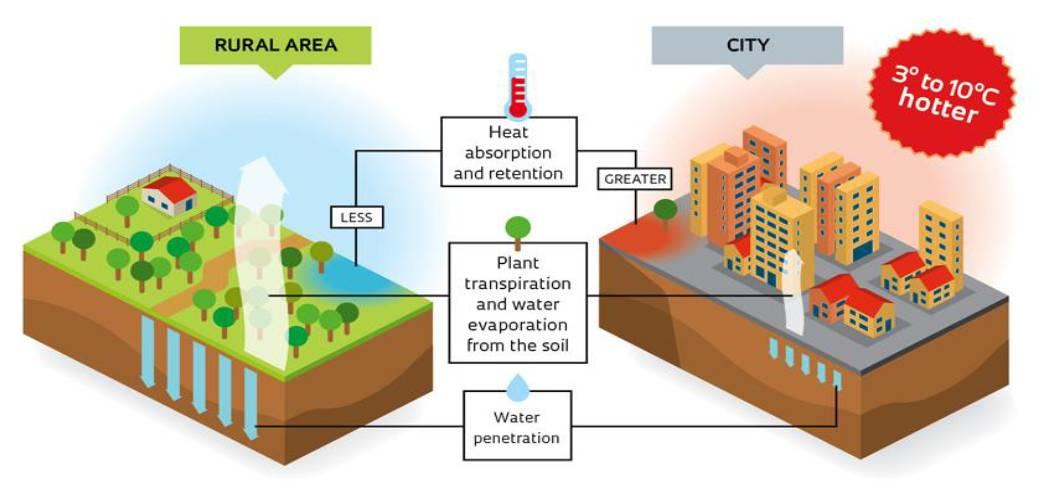
Fig. 1: How green cover loss increase urban heat.
Keywords: Heat Stress, Land Surface Temperature, Inhabitants, Urbanization. Public Health, Land cover I. INTRODUCTION
Building attractions in urban areas and widespread deforestation are both results of urbanization. Urban heat islands are caused mostly by emissions, an increase in built up hard surfaces and a decrease in urban green cover. With the help of their ability to shade and evapotranspiration, trees can reduce temperature.
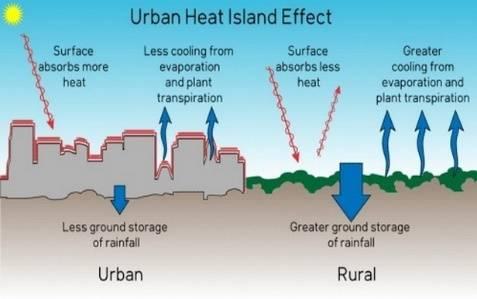
B. Urban Heat Due To Urban Surface
Urban surfaces replicate, absorb, and reemit solar energy; as a result, urban surface attributes like as thermal capacity, emittance, thermal absorbance, and reflectance have a substantial effect on UHI generation. Unlike rural areas, urban areas often feature low albedo surfaces such as roads, rooftops, and pavements that are significantly less effective in reflecting solar heat. As a result, city surfaces absorb a lot of heat, resulting in higher floor temperatures and the formation of surface urban heat.
Reduced green cover results in reduced shade, which causes exposed surfaces to absorb more heat that is later released into the atmosphere. Because there is less evaporation, there is less moisture available to cool the air, which keeps the temperature higher.
International Journal for Research in Applied Science & Engineering Technology (IJRASET) ISSN: 2321 9653; IC Value: 45.98; SJ Impact Factor: 7.538 Volume 10 Issue VIII August 2022 Available at www.ijraset.com 848©IJRASET: All Rights are Reserved | SJ Impact Factor 7.538 | ISRA Journal Impact Factor 7.894 | Heat Stress & Its Negative Impact on the City and its Inhabitants: A Case Study of Bhubaneswar Sandipta Kumar Samal1 , Bhabani Sankar Sa 2 , Parna Sarkhel 3 1M. plan Student, 2Assistant Professor, 3Lecturer, Odisha University of Technology and Research, Bhubaneswar Abstract: This paper aims to analyse how rapid urbanization helps in increasing urban temperature and how urban population suffering due to rise in temperature. Heat stress happens when the body's capability of controlling its inner temperature begins to fail. Temperature rise is of the main reason led to warmness stress. This heat stress related issues are mostly being seen among urban workers and urban poor. Usually, urban areas experience higher temperature than its peri urban & rural areas. These higher temperatures have negative human health impact like respiratory disorder, cardiovascular and heat stroke as well. Therefore, it is important to lower heat risk from urban environment. Deaths & Health hazards due to heat stress can be avoid easily. We just need to identify the high heat risk areas and with the help of proper planning and prevention we can prevent health related issues. Rapid Urbanization & increase of built up surface is one of the major causes increasing urban heat.
Now a days urban heat is a common issue in Indian cities. Considering the extreme variation in temperature for last couple of years it is going to be a big issue in near future. Urban heat is a result of environmental changes created by humans. Concrete, brick, asphalt, and metal are used in place of plant, soil, and water to minimize evapotranspiration, increase the storage and transfer of sensible heat, and reduce air movement. Some other contributing factors to the heat in cities are:

The Odisha district of Khorda is where Bhubaneswar is located. It is located next to the Eastern Ghats Mountain range's axis on the coastal plains of Japan. Southwest of the Mahanadi River, it is located. The city is 148 feet above sea level on average. The location is 20.27°N 85.84°E. The Chandaka Wildlife Sanctuary and Nandankanan Zoo are located in the western and northern regions of Bhubaneswar, respectively.
International Journal for Research in Applied Science & Engineering Technology (IJRASET) ISSN: 2321 9653; IC Value: 45.98; SJ Impact Factor: 7.538 Volume 10 Issue VIII August 2022 Available at www.ijraset.com 849©IJRASET: All Rights are Reserved | SJ Impact Factor 7.538 | ISRA Journal Impact Factor 7.894 |
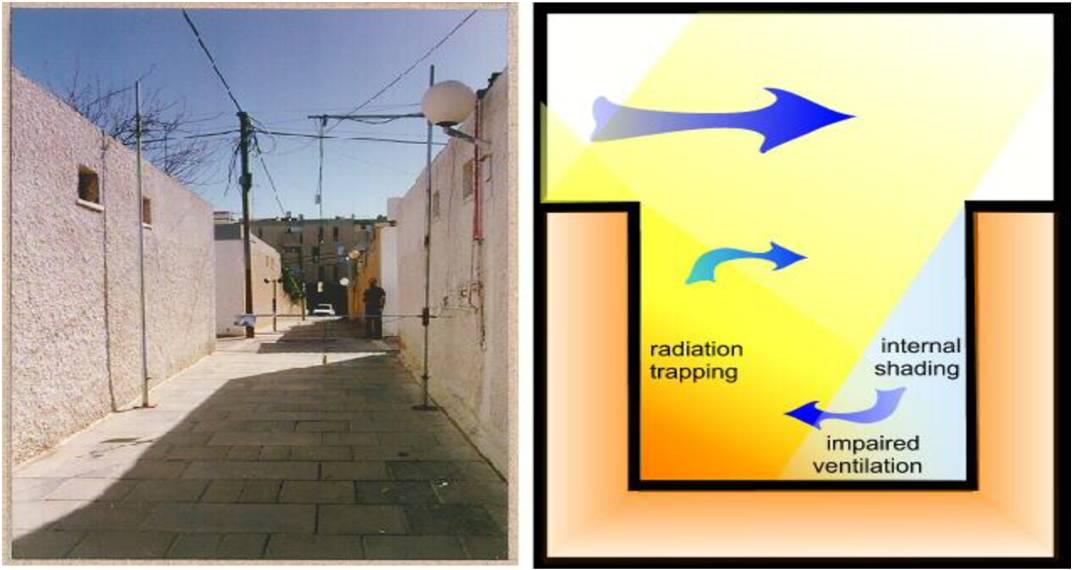
C. Urban Canyon Form Due To Urban Geometry
The impact, known as UHI, is most noticeable in city canyons, which are urban enclosures formed by thin roadways and towering buildings on each side. On the one hand, towering structures may color the canyon during the day, decreasing surface temperature, but on the other hand, the surfaces of these tall structures can reflect and absorb heat, resulting to prolonged air temperatures.
II. STUDYAREA
The city is bordered to the south and east by the Daya River and the Kuakhai River, respectively. The research area is 186 square kilometres in size, with 67 administrative wards and 46 income villages. having an 8.40 lakh population and a density of 6228 people per square kilometre
Fig. 3: Formation of Urban Canyons.
Fig. 2: Heat absorb by Urban & Rural surface.
The proportions of the developed surroundings for a certain metropolitan area are provided by urban geometry. It may also have an effect on wind movement, shading patterns, warmth absorption, and a surface's capacity to radiate long wave radiation downward back into space.
Table 1. Study area profile STUDY AREA PROFILE Study Area 186 sqkm No. of wards 67 Total Population (Census8,40,8342011) Population Density 6228 /sqkm
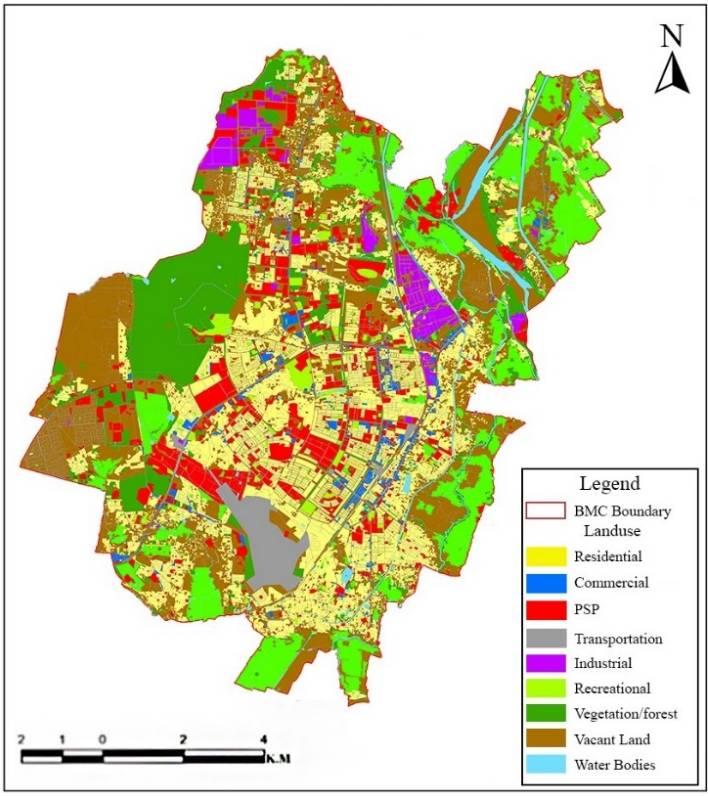
International Journal for Research in Applied Science & Engineering Technology (IJRASET) ISSN: 2321 9653; IC Value: 45.98; SJ Impact Factor: 7.538 Volume 10 Issue VIII August 2022 Available at www.ijraset.com 850©IJRASET: All Rights are Reserved | SJ Impact Factor 7.538 | ISRA Journal Impact Factor 7.894 | Residential, 21.85 Commercial, PSP3.32,Transport8, 8.8 Industrial, Recreational2.4,1.86 Vegetation, 24.05 Vacant Land, 27.2 Waterbodies, 2.52 0 5 10 15 20 25 30 VacantRecreationalCommercialResidentialPSPTransportIndustrialVegetationLandWaterbodies LANDUSE PERCENTAGE Table 2. Bhubaneswar climatology BHUBANESWAR CLIMATOLOGY Climate Tropical climate Avg. Annual Maximum Temp. 32 °C Avg. Annual Minimum Temp. 27 °C Avg. Annual rainfall 1505mm Avg. Annual Humidity 70% The climate in Bhubaneswar is tropical savanna. Monthly average temperatures range from 22 to 32 °C, with an annual mean of 27.4 °C. The low 30 °C summers (March to June) are warm and muggy; during dry periods, maximum temperatures frequently surpass 40 °C in May and June. Map 1: Land Use Land Cover of Bhubaneswar City Residential area has 22%. While commercial, PSP, Transport, Industrial, Recreational, Vegetation, Vacant Land, Waterbodies have 3%, 8%, 9%, 2%, 2%, 24%, 27%, 3% of land use respectively. Urbanization has a detrimental effect on the environment, especially because it causes pollution, changes the physical and chemical composition of the atmosphere, and covers the soil's surface Fig. 4: Land use Percentage

is,
we
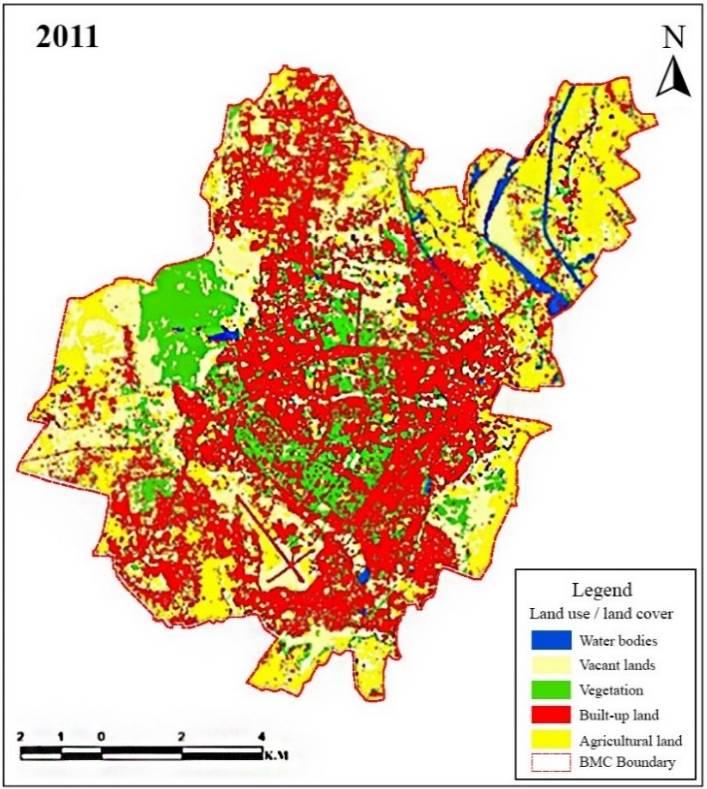
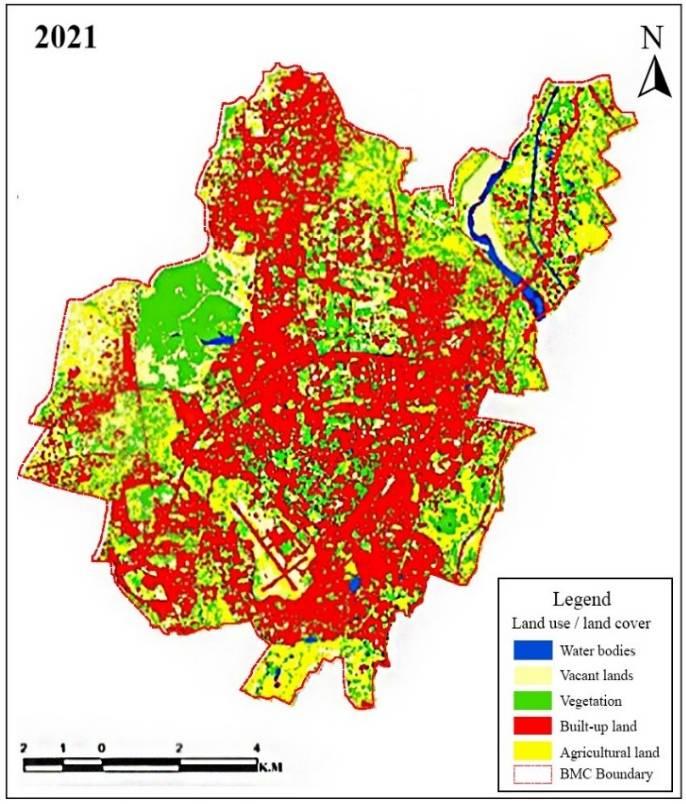
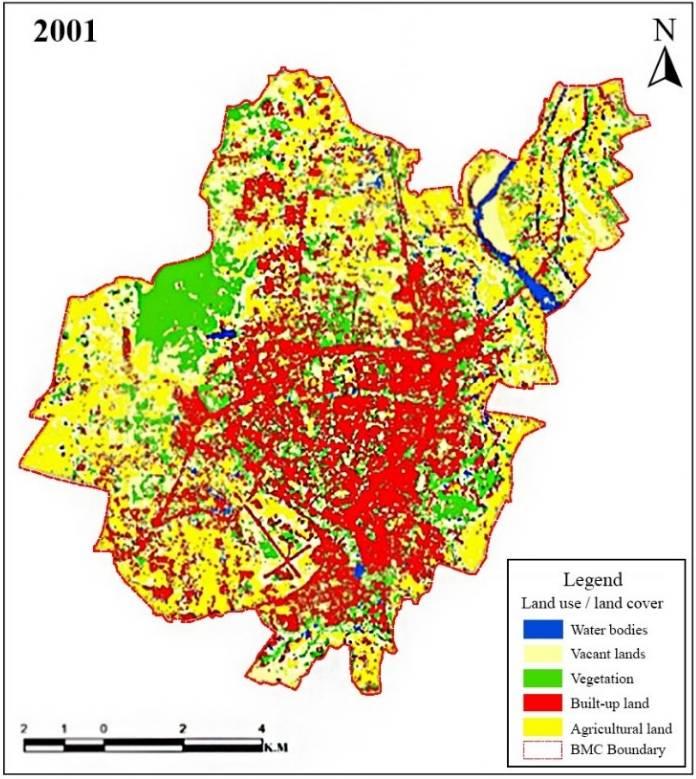
To know the temperature difference in last three decades and to know the major area affected due to increase in built up area which causing Land Surface Temperature (LST). With the help of USGS data built up changes map and Land Surface Temperature (LST) map have been prepared for the year 2001, 2011, 2021
it
By selecting 25 workers from each of these 5 categories, the sample was randomly selected. The survey was conducted in higher temperature IV. DATACOLLECTION&ANALYSIS
International Journal for Research in Applied Science & Engineering Technology (IJRASET) ISSN: 2321 9653; IC Value: 45.98; SJ Impact Factor: 7.538 Volume 10 Issue VIII August 2022 Available at www.ijraset.com 851©IJRASET: All Rights are Reserved | SJ Impact Factor 7.538 | ISRA Journal Impact Factor 7.894 | 39.439.238.838.638.438.237.83839 2017 2018 2019 2020 2021 2022 AVG. SUMMER TEMPERATURE IN BHUBNESWAR Avg. Summer Temperature in Bhubneswar
increasing year
1) Built up Changes: Vegetation showed the biggest reduction. The maps below show how the land cover change significantly in the South, North West, South West area of the Bhubaneswar municipal corporation. (BMC)
III.
in
Fig.
B. Primary Survey
Reason to select Bhubaneswar as study area: Main reason to take BMC area as study area if observe the avg. summer temperature of Bhubaneswar for last six years. The avg. temperature to the extreme variation in temperature for last couple of years is going to be a big issue near future. 4: Avg. Summer Temperature in BBSR for last six year METHODOLOGY
year Considering
To accomplish the study two types of techniques have been used for data collection and analysis.
A. Remote Sensing Data
To know, how the urban inhabitants suffer due to increase of temperature and to study how their social, educational and professional life hamper due to heat stress. A purposeful random sampling was carried out in Bhubaneswar to get data on how underprivileged urban workers cope with heat stress. Vegetable/fruit vendors, construction workers, porters, taxi drivers, and stall owners are five examples of low wage urban employees who spend most of their time outdoors. Since the workers in these locations are impoverished, the sample was selected from rather busy and underdeveloped market areas of the cities, such as those near to train stations, bus stops, etc.
A. Remote Sensing Data
International Journal for Research in Applied Science & Engineering Technology (IJRASET) ISSN: 2321 9653; IC Value: 45.98; SJ Impact Factor: 7.538 Volume 10 Issue VIII August 2022 Available at www.ijraset.com 852©IJRASET: All Rights are Reserved | SJ Impact Factor 7.538 | ISRA Journal Impact Factor 7.894 | 36.9342.1544.27 20.56 36.78 57.54 31.5717.819.66 62.6 30.1632.6 0 20 40 60 80 AgricultureBuiltupVegetationlandlandWaterbody 2021 2011 2001 Map 2: Increasing Built up area from 2001 2021 Fig. 5: Percentage of Built up change from 2001 21. Agricultural land, vegetation, and wasteland are being seen in decreasing direction between 2001 & 2021, while Built up land and water body are being in increasing direction. As per the data built up land covered the most land in BMC (28.79% in 2001, 42.76% in 2021), and water bodies (14.04% in 2001, 22.27% in 2021). The greatest decline was found in vegetation that is 26.47 square kilometres of loss was observed in the study area during the study period (2001 2021), with a decreasing rate of 0.89 square kilometres per year. With a total loss of 5.36 square kilometres between 2001 and 2021, agricultural land likewise shown a definite downward trend, shrinking at a pace of 0.22 square kilometres each year.
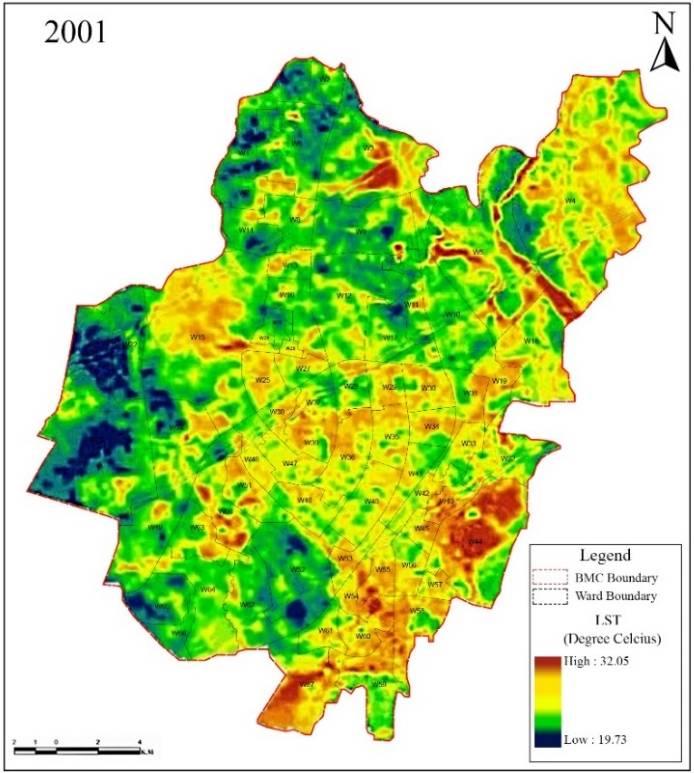
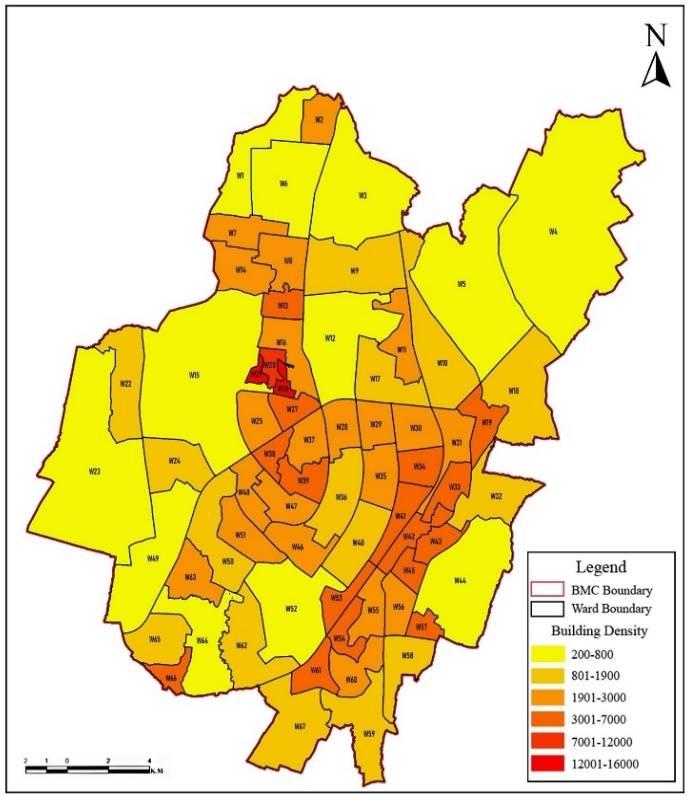
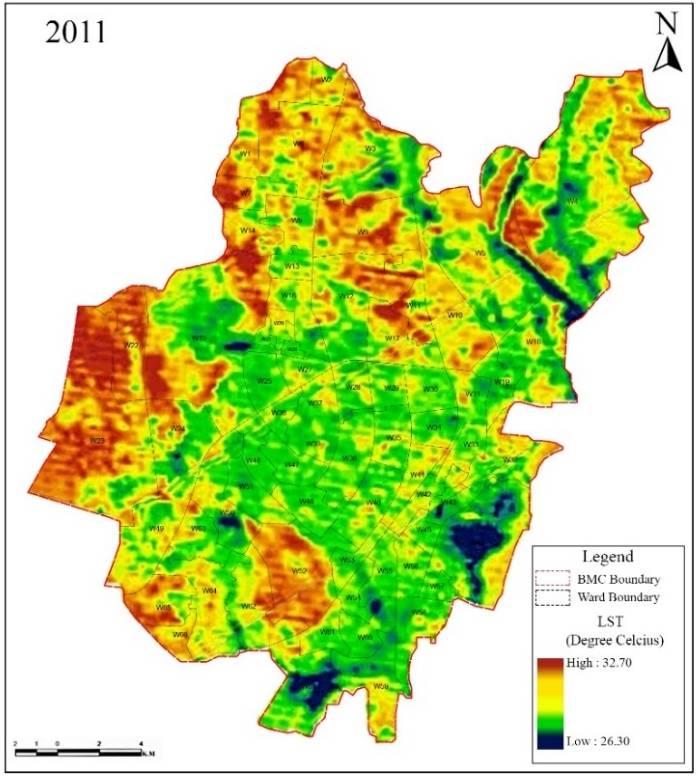
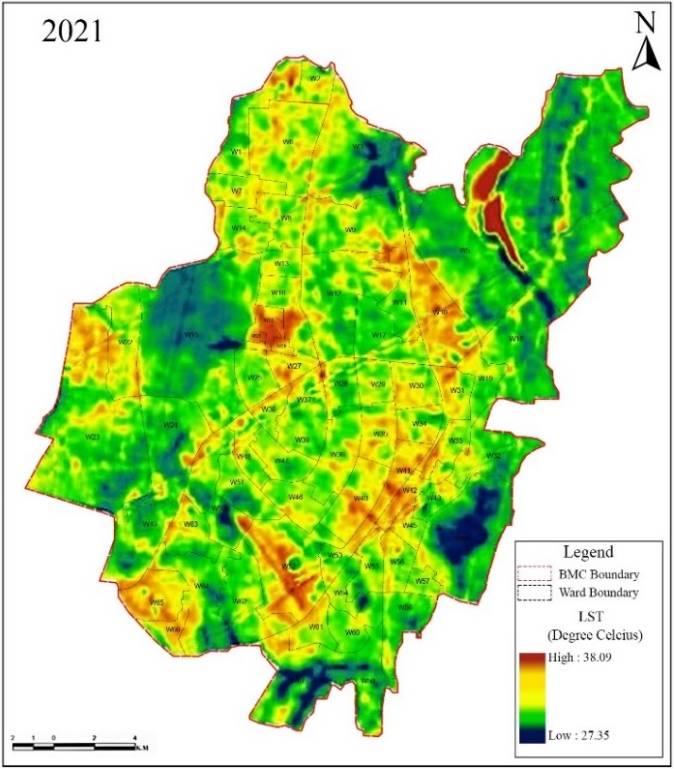
International Journal for Research in Applied Science & Engineering Technology (IJRASET) ISSN: 2321 9653; IC Value: 45.98; SJ Impact Factor: 7.538 Volume 10 Issue VIII August 2022 Available at www.ijraset.com 853©IJRASET: All Rights are Reserved | SJ Impact Factor 7.538 | ISRA Journal Impact Factor 7.894 | 2) Building Density & LST Map 3: Ward wise Built up density map Map 4: LST map of BBSR 2021 From the above Map it is observed that highest amount of Built up density is in Wards W20, W26, W21, W34 and W48. The population here also high which makes the population density in these wards denser as compared to the other wards. It is observed that these areas are in major risk of Urban heat phenomena due to higher value of land surface temperature. 3) Land Surface Temperature Map 5: LST map of BBSR 2001 Map 6: LST map of BBSR 2011

8.26
The outcome shows that between 2001 and 2021, the mean LST grew from 25.64 °C to 31.76 °C. From 2011 to 2021, the mean LST did not vary considerably. The wasteland (31.08 °C) and vegetation (28.45 °C) had the greatest and lowest LST, respectively. Wasteland's surface temperature climbed by 6.06 °C between 2001 and 2021, whereas built up land's LST sharply increased by 7.02 °C between 2001 and 2011. According to the data, building and urban infrastructure projects are generally linked to the biggest increase in LST. On the other hand, vegetation cover is linked to the lowest rise in LST.
Build
for
Apart from built up form, roads are also major `to increase Land Surface Temperature (LST). As Bhubaneswar is having total road length of 1642KM and more of these roads are made with concrete and asphalted materials which has a low albedo(α) value of 0.13 with high emissivity( value of 0.97
ε)
Vegetation
International Journal for Research in Applied Science & Engineering Technology (IJRASET) ISSN: 2321 9653; IC Value: 45.98; SJ Impact Factor: 7.538 Volume 10 Issue VIII August 2022 Available at www.ijraset.com 854©IJRASET: All Rights are Reserved | SJ Impact Factor 7.538 | ISRA Journal Impact Factor 7.894 | 35302520151050 2001 2011 2021 Mean Temperaturein °C Mean Temperature in °C Map 7: LST map of BBSR 2021 Fig. 6: Trend of LST during 2001 2021
BMC during
Wastelands
Water
The city's northern and westernmost regions, where there is a lot of greenery, have the highest levels of vegetation. LST is somewhat less in those areas. Urban areas with impermeable structures and major roads made of metal, asphalt, and concrete, however, are associated with higherTabletemperatures.3.MeanLST each class for 2001 2021 LULC type Mean LST (°C) Mean Difference 2001 2011 2021 2001 2021 Agricultural land 27.09 32.44 30.06 2.97 up land 24.4 31.42 32.74 8.34 24.38 30.38 30.6 6.22 27.27 32.64 33.33 6.06 body 21.21 27.68 29.47
issues,
blurred
ache
(17%). Fig.
them a
International Journal for Research in Applied Science & Engineering Technology (IJRASET) ISSN: 2321 9653; IC Value: 45.98; SJ Impact Factor: 7.538 Volume 10 Issue VIII August 2022 Available at www.ijraset.com 855©IJRASET: All Rights are Reserved | SJ Impact Factor 7.538 | ISRA Journal Impact Factor 7.894 | 121086420 CONSTRUCTIONWORKERS TAXI DRIVERS PORTERS STALL OWNERS VEGETABLESELLERS WORK TIME LOSS ON LOW-INCOME CATEGORY Normal Days in Hours Heatwave Days in Hours 24%19% 13% 8% 13%7% 16% HEALTH ISSUES OF URBAN WORKERS DUE HEAT STRESS RespiratoryTirednessFever problem Getting unconsious Blured vision Body FeelingacheofNausea B. Primary Survey Due to excessive heat stress people are suffering different types of problems. Old age people facing problems in both physical and social life, adults are facing problems in their professional life due to work time loss and Children’s education disrupted due to School closed. Accessibility to schools affected due to extreme heat. To access how urban worker affected due to heat a survey was done.
1) Health Related Issue Due To Urban Heat: Even though the majority of the workers had no prior history of health some claimed that heat waves caused variety of health including fever (24%), (19%), respiratory problems getting unconscious (8%), vision body (7%), and feeling of nausea 7: Health issues of urban workers due to heat stress
issues,
2) Work Time Loss Due to Urban Heat: The time lost was smaller for temporary stall owners 0.55 h and vegetable vendors. Porters lost the greatest work time of 1.65 h, construction workers 1.6 h, taxi drivers 1.55 h and the work loss of vegetable sellers is 0.75h. This demonstrates unequivocally that the lowest economic groups comprise the majority of heat attack casualties. Due to heat stress, some of them also alter their line of work. 8: Work time loss on low income
tiredness
category
(13%),
(13%),
Fig.


International Journal for Research in Applied Science & Engineering Technology (IJRASET) ISSN: 2321 9653; IC Value: 45.98; SJ Impact Factor: 7.538 Volume 10 Issue VIII August 2022 Available at www.ijraset.com 856©IJRASET: All Rights are Reserved | SJ Impact Factor 7.538 | ISRA Journal Impact Factor 7.894 | V. RESULTANDRECOMMENDATIONS A. Results
c) Mandatory Permeable surfaces road in local road and collector road. Initiating an Early Warning System and Inter Agency Coordination. e) Cool Roofs Program implementation. CONCLUSION
d)
3)
1) Mitigation strategy Promoting green cover and vegetation, installation of green roofs, vertical garden or green walls, permeable road surface, shaded street and shaded parking lot. Area having high H/W (Building height and Road width) ratio must be covered with green cover to reduce urban heat effect.
a) Recommendations for cool walls to be mandatory in Commercial Locations and offices to mitigate heat.
2) Policy related interventions
b) Recommendations for implementing of cool and green roofs in houses/buildings near high traffic density.
REFERENCES [1] https://en.wikipedia.org/wiki/Bhubaneswar [2] Final Report on Urban Planning Characteristics to Mitigate Climate Change in Context of
1)
B. Recommendations
4)
As major contributing factor of urban heat is due Land surface temperature (Which is caused due to rapid urbanization) To mitigate urban heat, it is necessary to reduce LST. It can be reduced by applying different preventive measures and mitigation strategy and policies.
Heat stress affect urban inhabitants a lot, especially urban poor as they cannot afford air conditioner. It is also estimated that for every 0.6°C rise in temperature, there is an increase in electricity consumption of about 2%. Most urban worker income also hamper dure to heat stress in their working field. So, it is necessary to mitigate urban heat in urban areas, but in the same way it is also impossible to stop rapid urbanization, so preventive measures and mitigation strategy can be taken to prevent urban heat. Urban Heat Island
Effect TERI [3] https://www.bmc.gov.in/about/profile [4] https://weatherspark.com/h/m/111018/2018/5/Historical Weather in May 2018 in Bhubaneshwar India#Figures Temperature [5] Bhubaneswar CDP Report 2010, https://www.bda.gov.in/cdp executive summary [6] https://earthexplorer.usgs.gov/ [7] ng_remote_sensing_and_GIS_techniques_a_case_study_of_Bhubaneswar_city_Eastern_India_1991https://www.researchgate.net/publication/356220632_Spatiotemporal_pattern_of_land_use_and_land_cover_and_its_effects_on_land_surface_temperature_usi2021
5)
Vegetation, which is one of the main causes of the rise in land surface temperature, showed the highest loss in the study area. Major built up density is in Wards W20, W26, W21, W34 and W48. Apartments forming urban canyon in these area and Huts in this area are having tin roof which absorbs more heat. Ward 20, W21, W26, W10, W52, W41, W41, W10 are having higher Land surface temperature than others. Most of the roads are constructed asphalt material which have low albedo value and high emissivity and most of the roads are not having shading or direct expose to direct sun. Heat stress reduce the worktime of people, it also hampers the education of children and the social life of senior citizen.
2)
VI.