
ISSN: 2321 9653; IC Value: 45.98; SJ Impact Factor: 7.538

Volume 10 Issue XI Nov 2022 Available at www.ijraset.com


ISSN: 2321 9653; IC Value: 45.98; SJ Impact Factor: 7.538

Volume 10 Issue XI Nov 2022 Available at www.ijraset.com

Shantanu Metkar1 , Abhishek Ahirrao2 , Abhishek Avhad3
1Nashik District Maratha Vidya Prasarak Samaj’s KBT college of engineering & Gangapur Road, Igatpuri, Udaipur Maratha Boarding Campus, Nashik, Maharashtra 422013
2Nashik District Maratha Vidya Prasarak Samaj’s KBT college of engineering & Gangapur Road, Igatpuri, Udaipur Maratha Boarding Campus, Nashik, Maharashtra 422013
3Professor: Vishal Shinde, Department of Mechanical Engineering , Nashik District Maratha Vidya Prasarak Samaj’s KBT college of engineering, Maharashtra, India
Abstract: Misalignment and unbalance are the most probably common cause of machine vibration. Vibration monitoring is a useful technique for application to rotating machinery and provides valuable information regarding symptoms of machinery failure which may avoid costly breakdown. Understanding and practicing the fundamentals of rotating shaft parameter is the firststep in reducing unwanted vibration. Experimental studies were performed on two rotor dynamic test apparatus to predict the vibration spectrum for different faults. The experimental test rig was designed and tested for misalignment and unbalance condition. The rotor shaft accelerations were measured at 1000 rpm speed using four channel vibration FFT (Fast Fourier Transform) analyzer. The experimental frequency spectra were obtained for misalignment and unbalanced condition leading to reliable diagnostic information.
Keywords: two rotor system, unbalance, misalignment, FFT
Vibration analysis can identify improper maintenance or repair practices. These can include improper bearing installation and replacement,inaccurate shaft alignment or imprecise rotor balancing Vibration analysis is used to determine the operating and mechanical condition ofequipment. A major advantage is that vibration analysis can identify developing problems before they become too serious and cause unscheduled downtime. This with the equivalent theoretical forces due to faults. The fault condition and location of faults were can be achieved by conducting regular monitoring of machine vibrations either on continuous basis or at scheduled intervals. Regular vibration monitoring can detectdefective bearings, mechanical looseness and wornor broken gears. Vibration analysis can also detectmisalignment and unbalance before theseconditions result in bearing or shaft deterioration. All rotating machines produce vibrations that are afunction of the machine dynamics, such as thealignment and balance of the rotating parts.Measuring the amplitude of vibration at certainfrequencies can provide valuable information aboutthe accuracy of shaft alignment and balance, thecondition of bearings or gears, and the effect on theMachine due to resonance from the housings,piping and other structures.
Vibration measurement is an effective, non intrusive method to monitor machine conditionduring start ups, shutdowns and normal operation. Vibration analysis is used primarily on rotating equipment such as steam and gas turbines, pumps, motors, compressors, paper machines, rolling mills,machine tools and gear boxes. Interpreting the vibration signal obtained is a complex process that requires specialized training and experience. One commonly employed technique is to examine the individual frequencies present in the signal. These frequencies correspond to certain mechanical components such as the various pieces that make up a rolling element bearing or certain functions such as shaft unbalance or misalignment. By examining these frequencies and their harmonics, the analyst can often identify the location and type of problem, and sometimes theroot cause as well.
Abdullah M et al [1] investigated the relationship between Acoustic Emission r.m.s,amplitude and kurtosis for a range of different speed and load conditions for rolling element bearings.
A.W. Lees [2007] [3] observed the effects of rotor misalignments in rigidly coupled rotor and showed that excitation at twice synchronous speed was developed. Arun Kr .Jalan and A.R. Mohanty [2009] [7] used a model based technique for fault diagnosis of rotor bearing system by generating residual vibrations for the rotor bearing system subject to misalignment and unbalance, and then the residual forces due to presence of faults were calculated. These residual forces were compared successfully detected by this model based technique.
Tejas H. Patel, Ashish K. Darpe [2009] [5]Misalignment effect at coupling location of rotorFE model is simulated using nodal force vector. Effect of the types of misalignment (parallel and angular) on the vibration behavior of the coupled rotor is examined.
ISSN: 2321 9653; IC Value: 45.98; SJ Impact Factor: 7.538 Volume 10 Issue XI Nov 2022 Available at www.ijraset.com

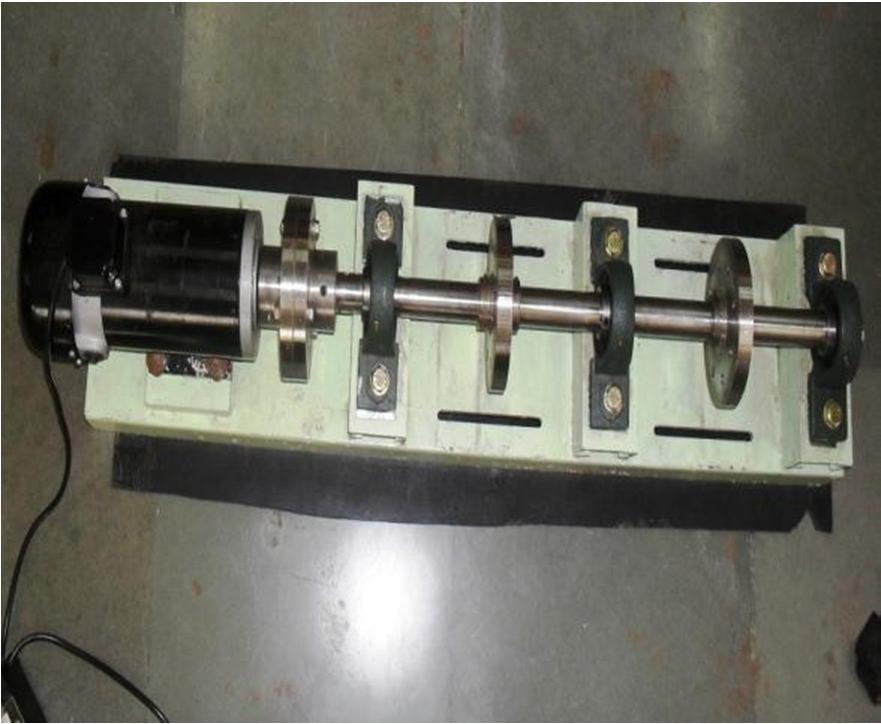
The experimental test rig used for this work is shown in fig 1.
Table No.1 List of Designed Parts of Systems Shaft

Diameter ,d 30 mm Length L 700 mm Material Mild steel Densityof Material 7860 / 3 Young Modulus 2.1 X 10¹¹ / 2 Key 7.5X7.5X45 Hub
Outside diameter of hub ,D 60 mm Length of hub, lh 45 mm Pitch circle diameter for pin 90 mm Bearing 6006 Disc Diameter 130mm Thickness 18mm Material Mild steel Densityof Material 7860 / 3
The test rig consists of a shaft with two rotor disc, which is supported on three ballbearings. A dc motor coupled by a flexible coupling drives the shaft. The parameters used in studies are given in table 1. The actual rotor rig is also shown in fig 1 this rig consist of a shaft of 30 mm diameter and 600 mm length mounted in between the three SKF single row groove ball bearing. Two disc of 130 mm diameter and 18 mm thick is fixed at the mid span of the two bearing each. The disc consists of 4drilled holes on the periphery at a radius of 45 mm to fix the balancing mass. The rotor rig is driven by1 HP motor running at a speed of 300 RPM. A coupling connects the driver and driven shaft. The measuring instruments used in the experimental set up. An accelerometer is mounted with a stud on the ball bearing housing. The output of the accelerometer is connected to the FFT.
ISSN: 2321 9653; IC Value: 45.98; SJ Impact Factor: 7.538 Volume 10 Issue XI Nov 2022 Available at www.ijraset.com

Experimental facility as shown in Figure 1 is used for unbalance and misalignment test. First the setup is run for few minutes to settle down allminor vibrations. Before creating the unbalanced, the shaft is checked for any misalignment and unbalance. Two dial gauge method is used to checkthe proper alignment and balancing. After this an unbalance has been created by placing a mass of 30 gram in the rotor at a radius of 45 mm. Accelerometer along with the FFT analyzer is used to acquire the vibration signals. Ch no. 1 of FFT is connected to vertical direction on drive end motor ch. no 2 of FFT is connected to horizontal directionon the same drive end as shown in figure 2. B&K 4384 charge type accelerometers are used. Rotor speed is also measured with a B&K photoelectric tachometer probe. The Calibrated accelerometer is fitted over the motor and connected to the FFT. Vibration signals are measured at 1000 rpm.
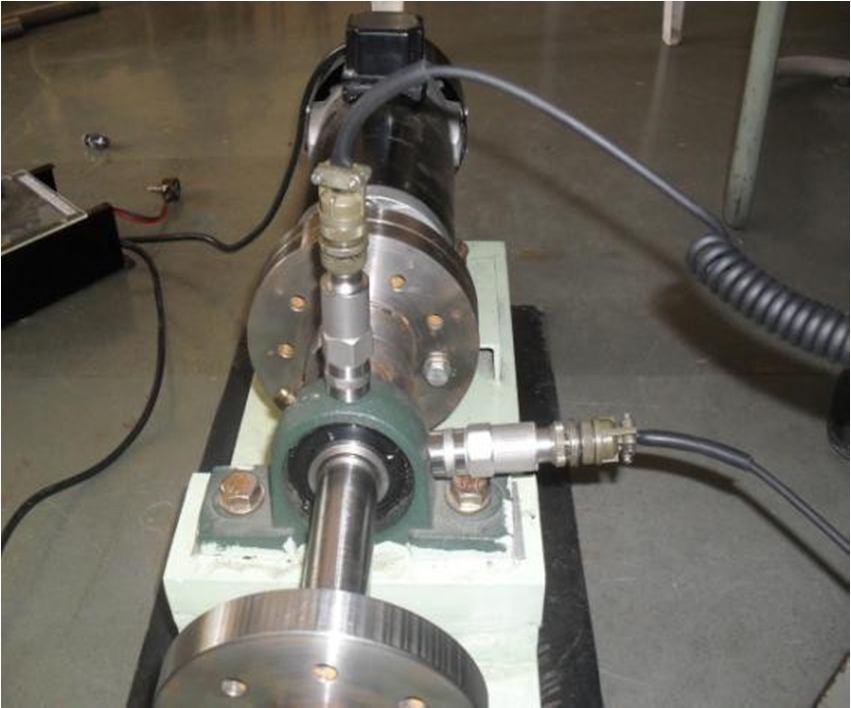
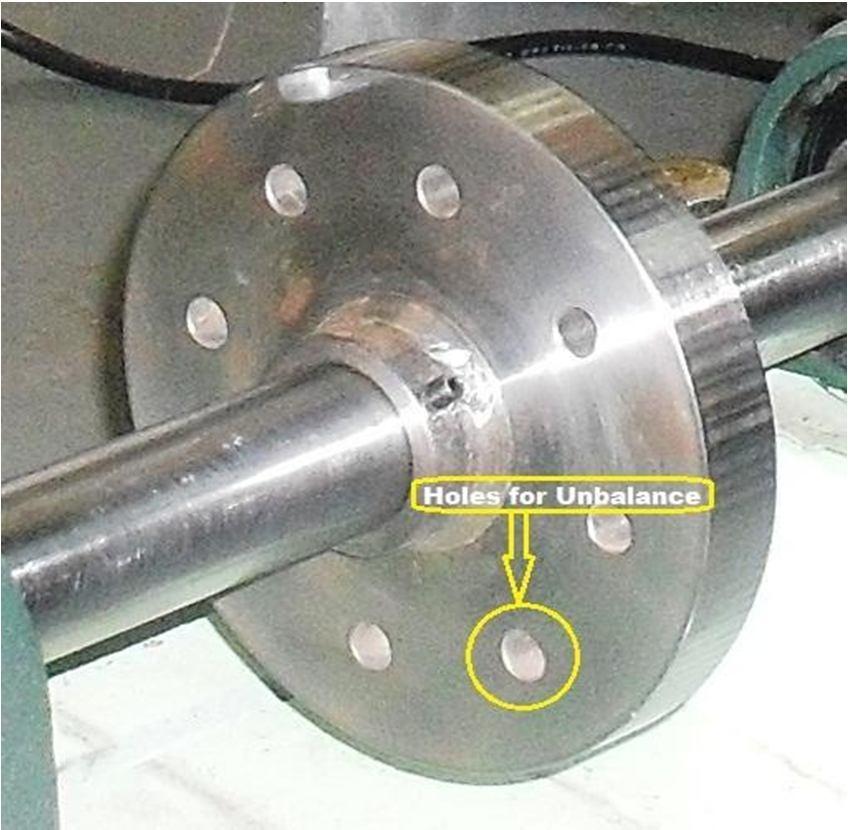

Fig 2 Accelerometer Placed on Bearing, Ch no. 1 of FFT is connected to vertical direction and Ch no 2 of FFT is connected to horizontal direction
The generation of unbalance condition is done asshown in Figure 3
Fig.3 Generation of unbalance in healthysystem
Shaft alignment is the process to align two or more shafts with each other to within a tolerated margin. Any misalignment between the two increases the stress on the shafts and will almost certainly result in excessive wear and premature breakdown of the equipment. This can be very costly. When the equipment is down, production might be down.
ISSN: 2321 9653; IC Value: 45.98; SJ Impact Factor: 7.538 Volume 10 Issue XI Nov 2022 Available at www.ijraset.com

1) Parallel Misalignment: Parallel misalignment with, the center lines of both shafts are parallel but they are offset as shownin fig
4 The parallel misalignment can be further divided up in horizontal and vertical misalignment. Horizontal misalignment is misalignment of the shafts in the horizontal plane and vertical misalignment is misalignment of the shafts in the vertical plane. Parallel horizontal misalignment is where the motor shaft is moved horizontally away from the pump shaft, but both shafts are still in the same horizontal plane and parallel. Parallel vertical misalignment is where the motor shaft is moved vertically away from the pump shaft, but both shafts are still in the same vertical plane and parallel.
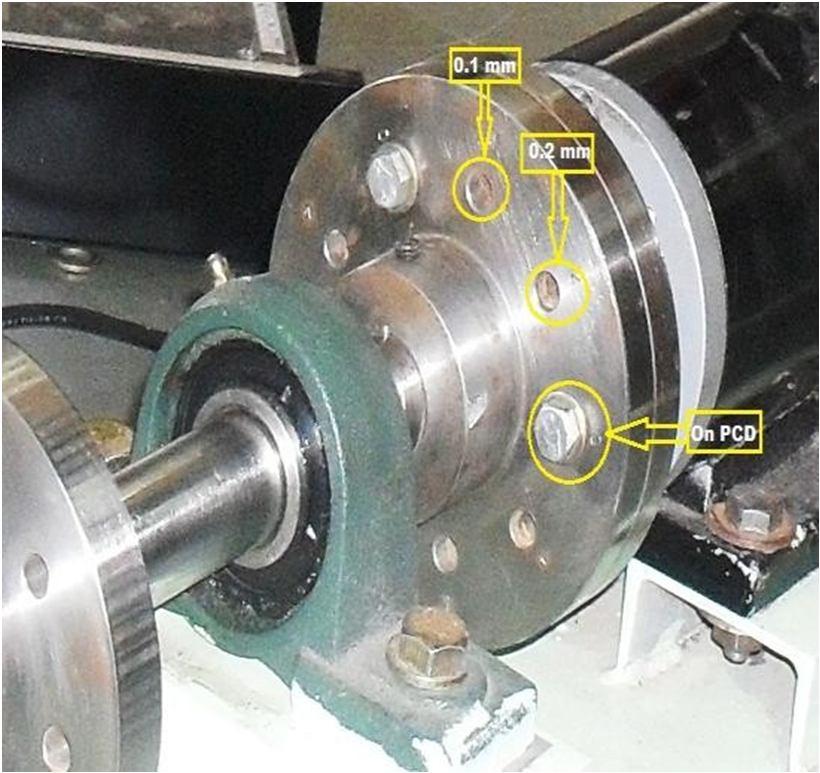
Fig.4 Generation of parallel misalignment
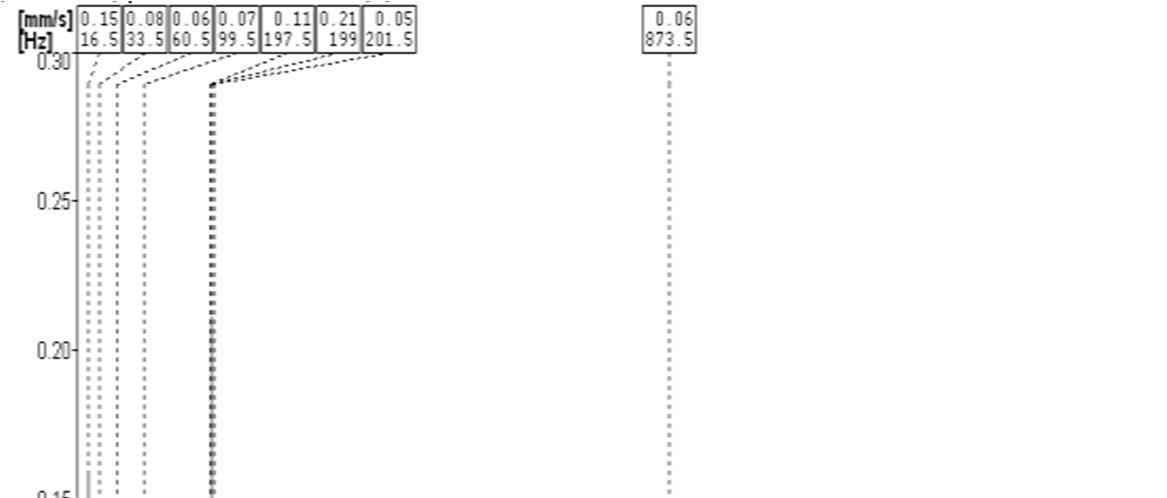

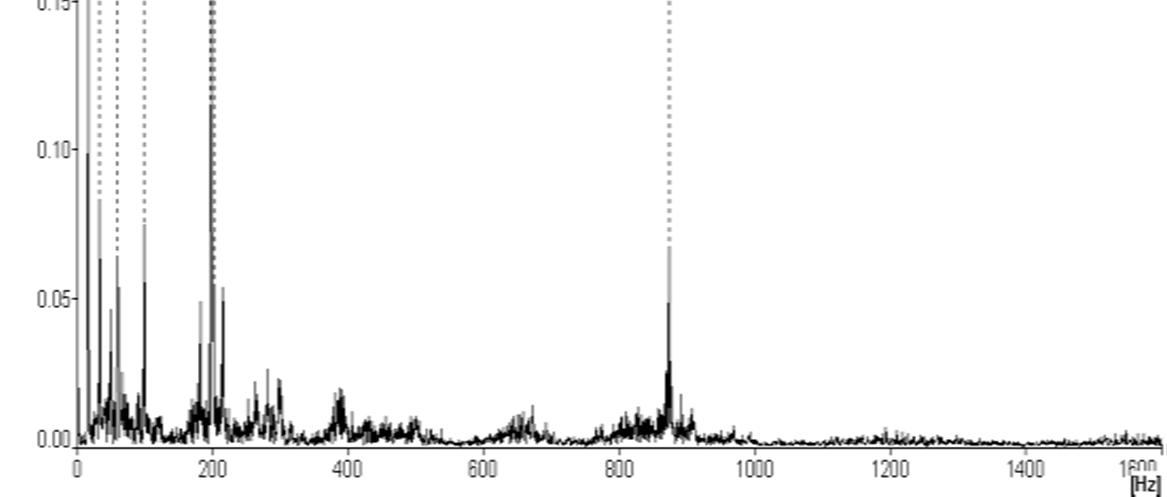
The experimental frequency spectra were obtained to baseline condition. The perfect aligned and balance cannot be achieved in practice Thus, a baseline case is presented first to show the residual unbalance. The measured amplitude of a well balanced system at drive end (DE) with the self designed 3 pin type coupling at speed 1000 rpm shown in Figure 5 and 6 on CH. NO.1 and CH. NO.2 respectively. The base line spectrum is measured experimentally using four channel FFT analyzer.
Fig 5 Graph of overall acceleration vs. Frequency of healthy system on CH.NO.1 for N=1000rpm (vertical direction)
ISSN: 2321 9653; IC Value: 45.98; SJ Impact Factor: 7.538 Volume 10 Issue XI Nov 2022 Available at www.ijraset.com

In a healthy system the FFT spectrum displays a single 1X frequency peak. As the speed increases the amplitude at 1X is also increases
Table No.2 Values of overall Amplitude (mm/s) of healthy system.
Amplitude mm/s
Speed RPM
Vertical direction Axial direction (Ch No.1) (Ch No.2) 1000 0.11 0.40

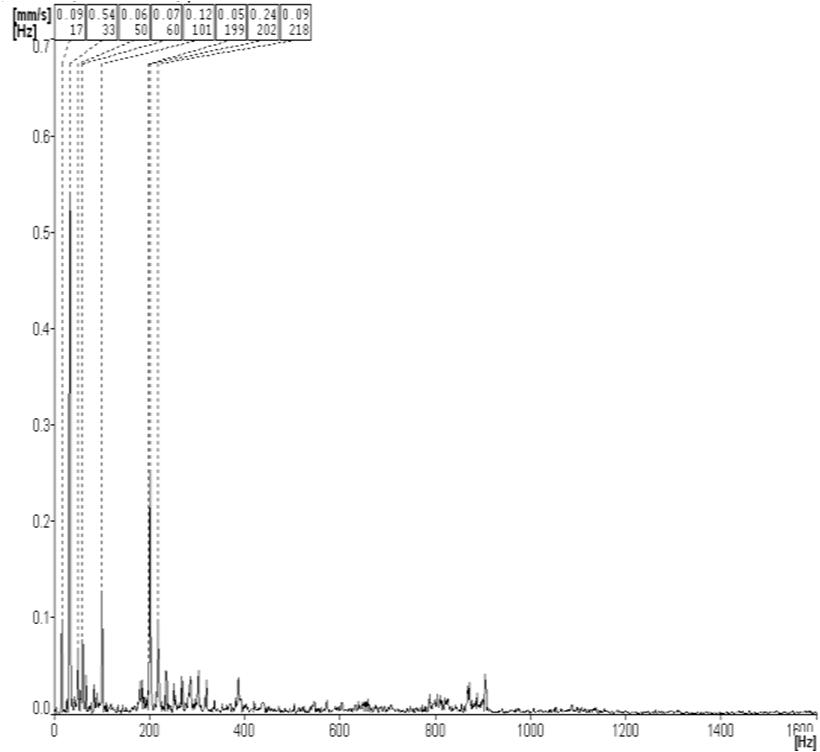
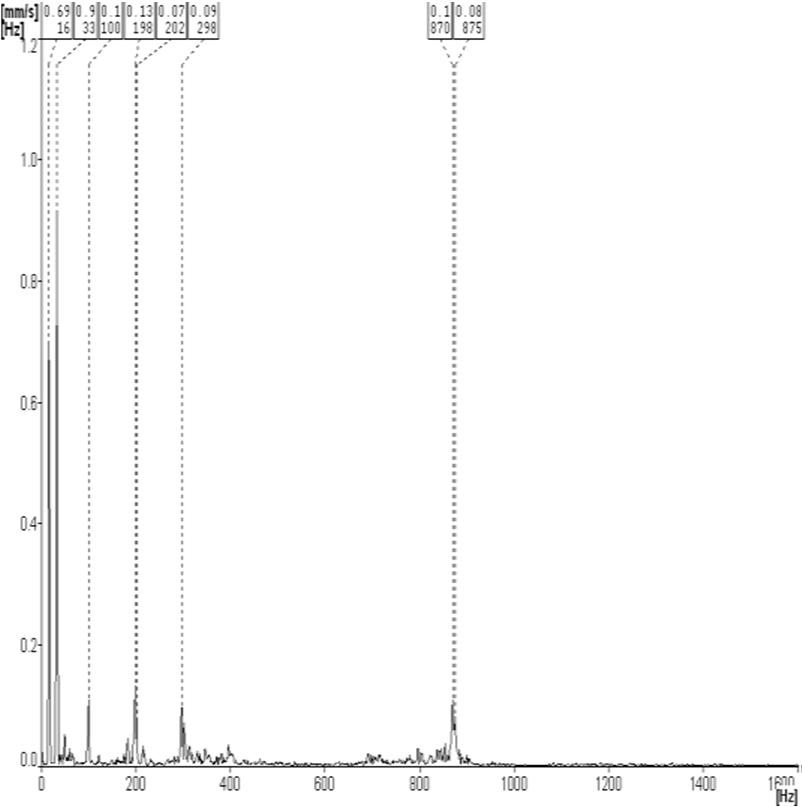
The unbalance has been created by placing a mass of 30 gram in the rotor at a radius of 45 mm.Accelerometer along with the FFT analyzer is used to acquire the vibration signals. Ch no. 1 of FFT is connected to vertical direction on drive end motor Ch no 2 of FFT is connected to horizontal directionon the same drive end.
ISSN: 2321 9653; IC Value: 45.98; SJ Impact Factor: 7.538 Volume 10 Issue XI Nov 2022 Available at www.ijraset.com

The Calibrated accelerometer is fitted over the motor and connected to the FFT. Fig 7 , shows frequency spectrum at 1000RPM in vertical direction (CH 1).Fig,8 shows the experiment vibration amplitude in mm/sec of DE at different speeds in horizontal direction (CH 2).
1) Frequency Spectrum of Unbalance of 30Gram at a Radius of 45 mm in Rotor

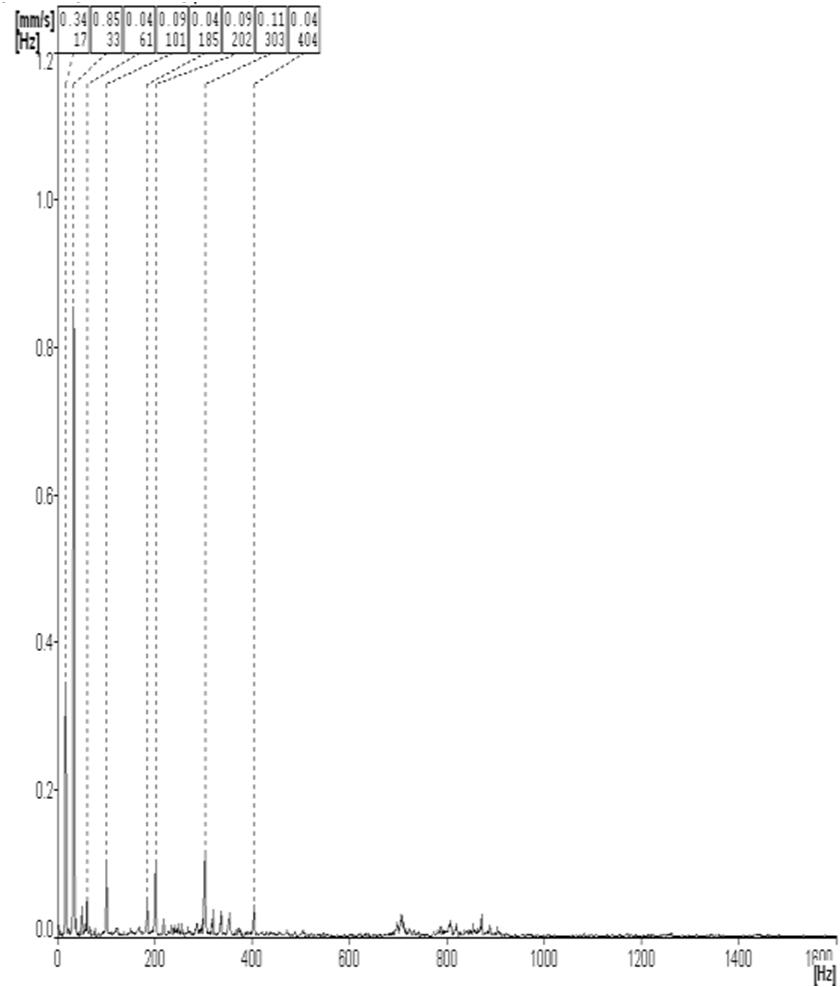
Fig 8 Horizontal vibrations (mm/sec) Vs Frequency(Hz), (N=1000 rpm, 30 grams)
2) Frequency Spectrum of Unbalance of 42Gram at a Radius of 45 mm in Rotor
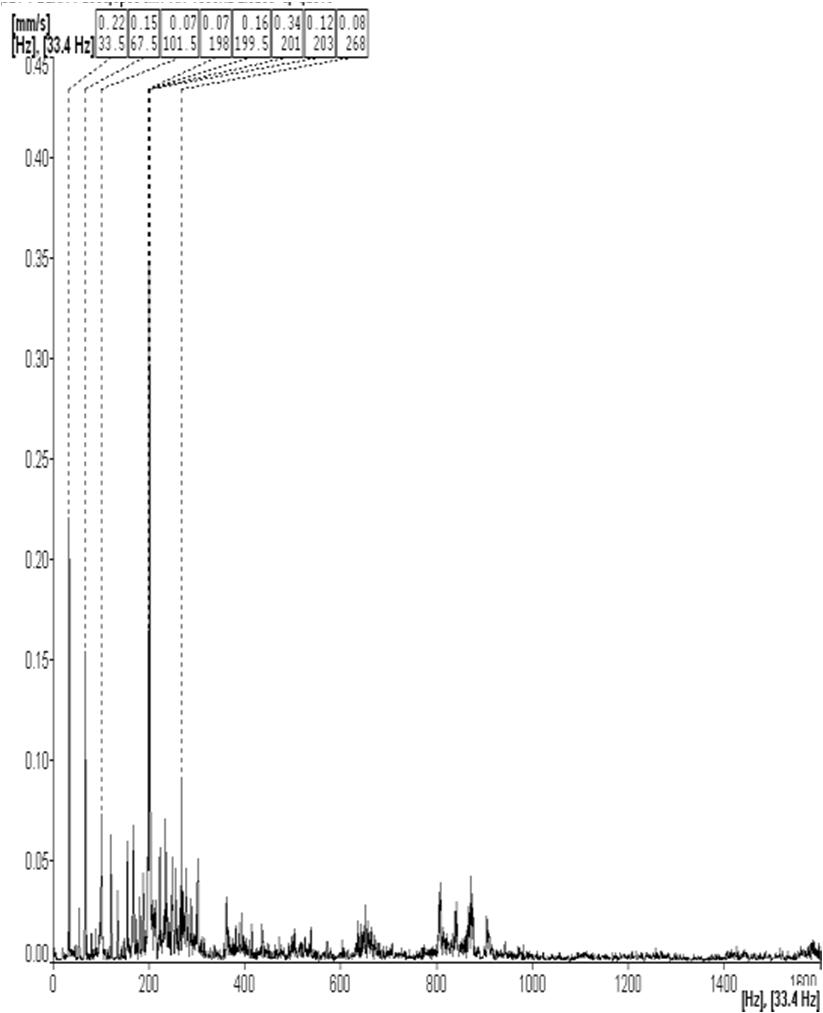
The unbalance has been created by placing a mass of 42 gram in the rotor at a radius of 45 mm.Accelerometer along with the FFT analyzer is used to acquire the vibration signals. Ch no. 1 of FFT is connected to vertical direction on drive end motor Ch no 2 of FFT is connected to horizontal directionon the same drive end.
Fig 9 Vertical vibrations (mm/sec) Vs Frequency(Hz), (N=1000 rpm, 42 grams)
ISSN: 2321 9653; IC Value: 45.98; SJ Impact Factor: 7.538 Volume 10 Issue XI Nov 2022 Available at www.ijraset.com

rpm, 42 grams)
In an unbalance fault the FFT spectrum displays a single 1Xrpm frequency peak. This defect may cause high horizontal direction than vertical direction. From that table if increase the unbalance mass the amplitude at 1X is alsoincreases FFT gives more predictable results for unbalance fault.
Table No.3 Values of overall amplitude (mm/s) in vertical and horizontal directions of unbalanced mass 30 and 42 gram at a Radius of 45 mm in Rotor at 1000RPM Unbalances mass in Speed (RPM) Amplitude mm/s Gram
Vertical 1X (Ch No.1)
Horizontal 1X (Ch No.2) 30 1000 0.16 0.33 42 1000 0.17 0.87
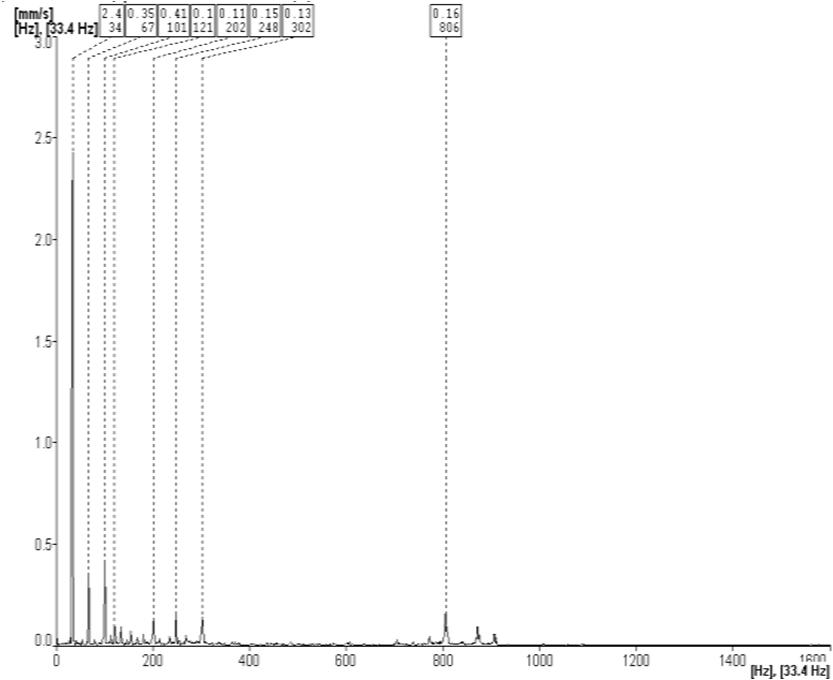
For generation of parallel misalignment inthe healthy setup three holes for bolt on the output flange of the coupling are shifted on either side of the axis of coupling. Offset is 0.1 mm& 0.2 mm forparallel misalignment of 0.1mm and 0.2 mm respectively

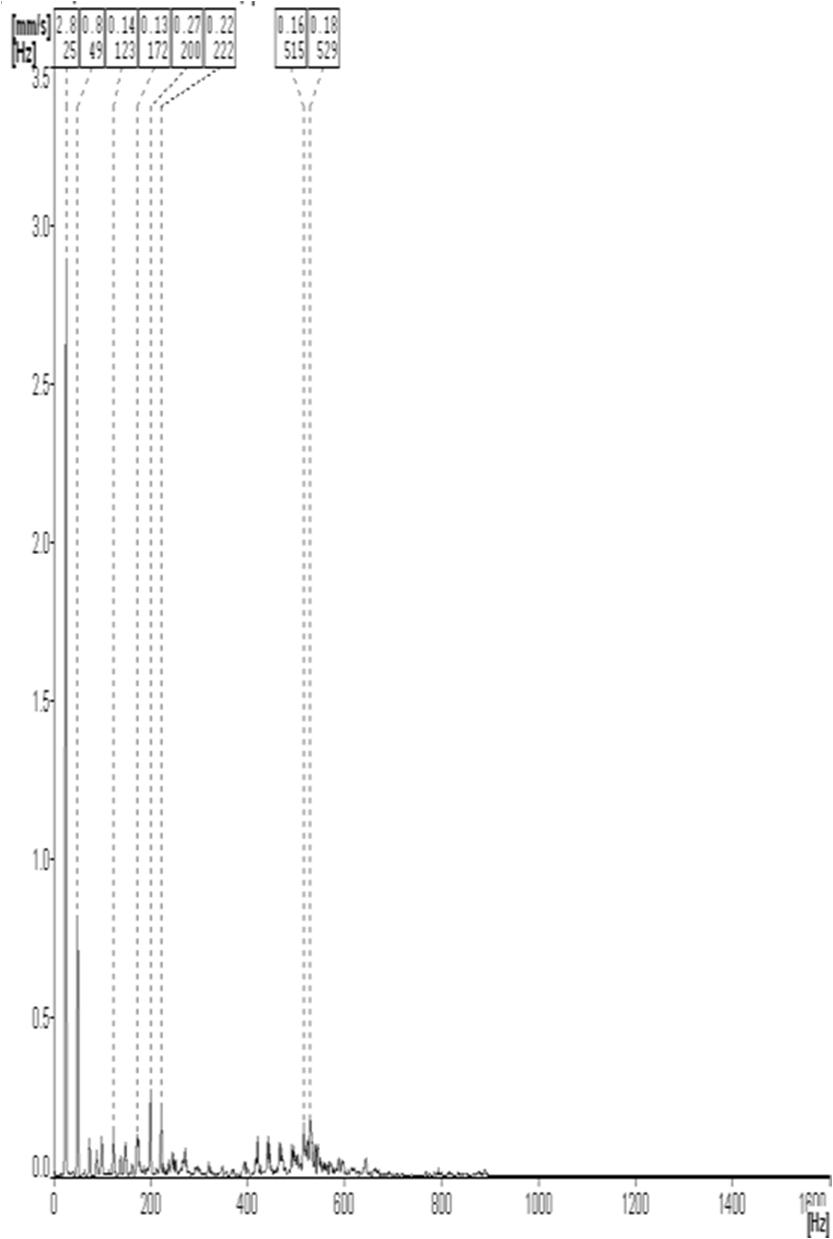
1) Frequency Spectrum of Misalignment of 0.1mm Condition
Fig 11 Experimental spectrum misaligned 0.1 mmat 1000 RPM at CH.No.1 (vertical direction)

ISSN: 2321 9653; IC Value: 45.98; SJ Impact Factor: 7.538 Volume 10 Issue XI Nov 2022 Available at www.ijraset.com
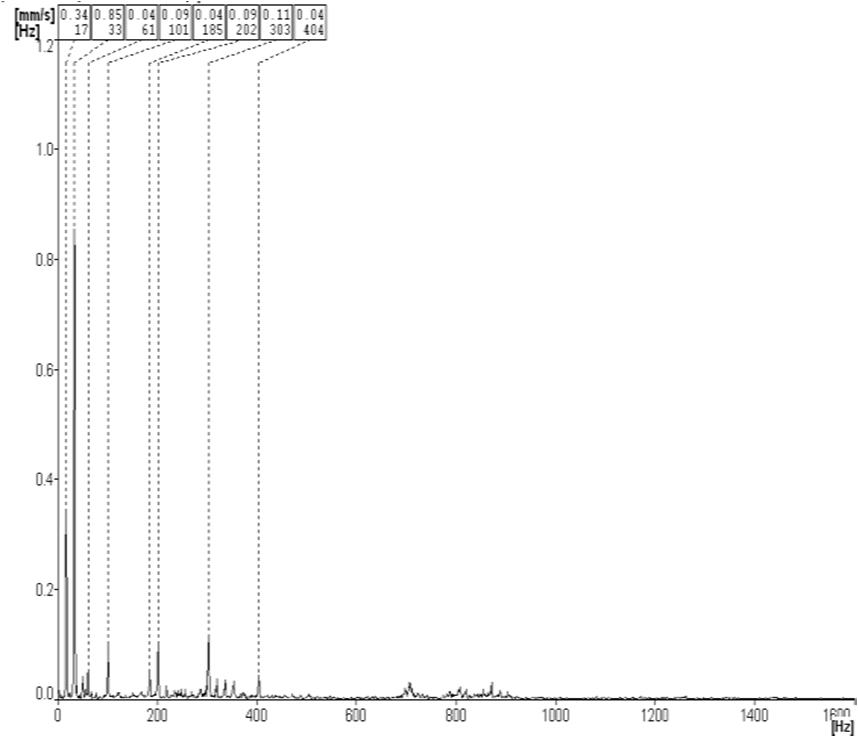
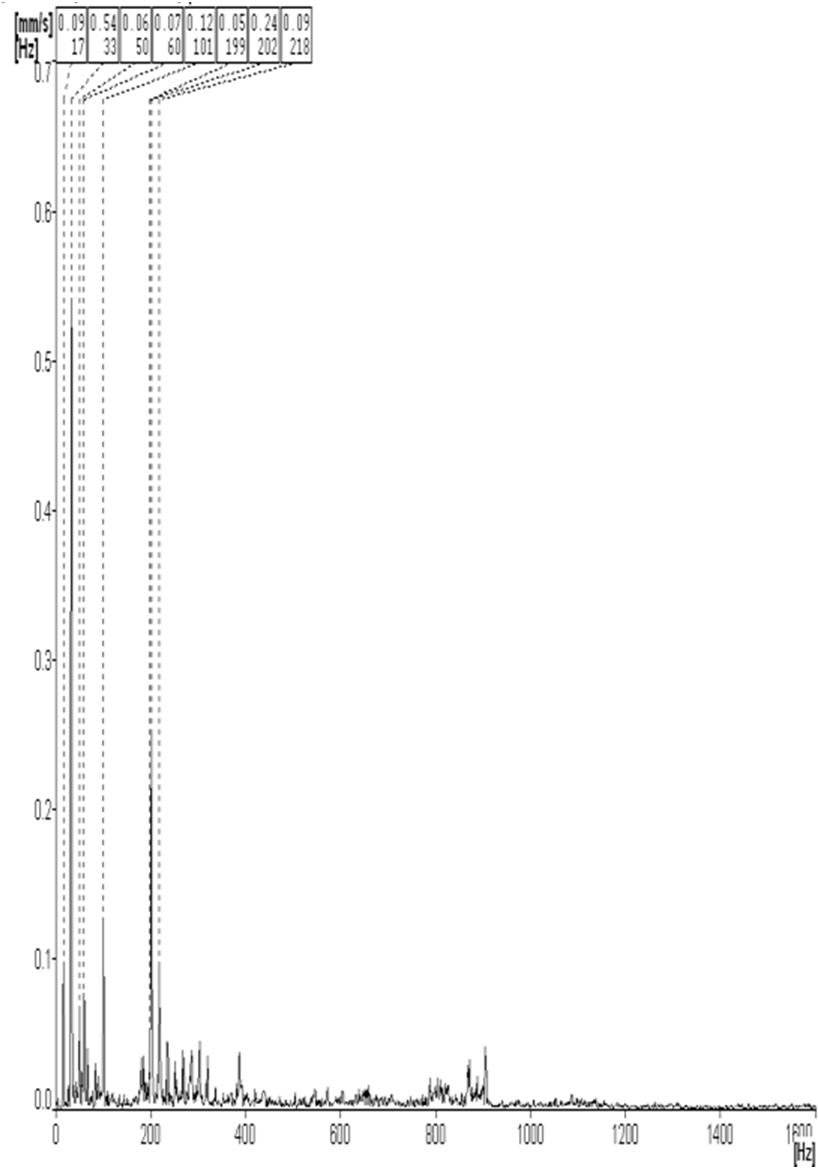
Fig 12 Experimental spectrum misaligned 0.1 mmat 1000 RPM at CH.No.2 (Axial direction)

2) Frequency Spectrum of Misalignment of 0.2mm Condition
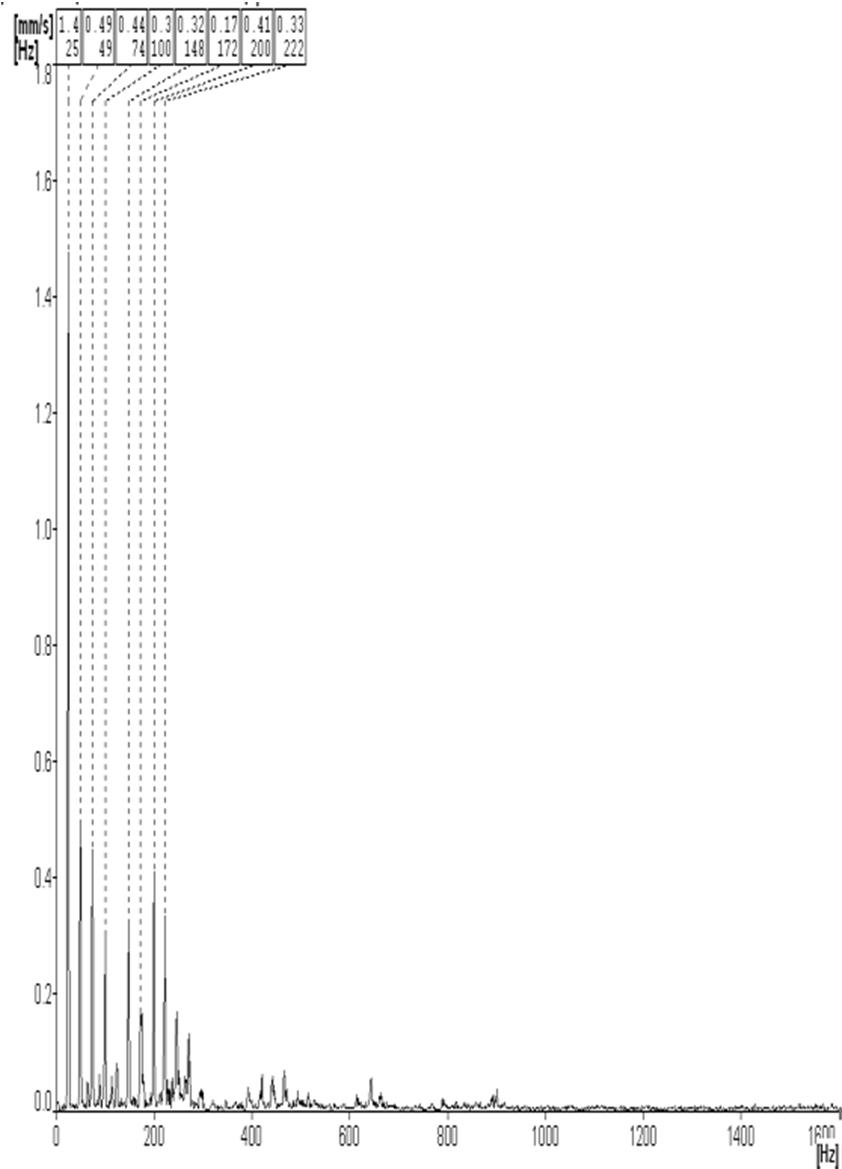
Fig 13 Experimental spectrum misaligned 0.2 mmat 1000 RPM at CH.No.1 (vertical direction)
ISSN: 2321 9653; IC Value: 45.98; SJ Impact Factor: 7.538 Volume 10 Issue XI Nov 2022 Available at www.ijraset.com

Fig 14 Experimental spectrum misaligned 0.2 mm at 1000 RPM at CH.No.2 (Axial direction)
Table No.4 Values of overall amplitude (mm/s) in vertical and axial directions of different values of different parallel misalignments of rotor speed at 1000 RPM of Drive end Parallel misalignment Speed (RPM) Amplitude mm/s
Grams Vertical1X (ChNo.1) Axial 1X (Ch No.2)
0.1 1000 0.33 0.22 0.2 1000 1.04 0.60
The maximum vibration amplitudes are obtained at second harmonics (2X) at speed (1000 rpm).This is indeed a good indication of the shaft misalignment. This defect may cause high axialvibration than vertical vibration. If we increase the misalignment the second harmonics (2X) has been increase. . If we increase the speed some external forces acts on rotor and it is somewhat unbalance condition. Experimental analysis can be used inpredictive maintenance to monitor the parallel misalignment conditions. FFT gives more predictable results for parallel misalignment fault.
In case of unbalance, the amplitudes are measured at drive end in vertical and horizontal directions. The highest value of overall amplitude is produced in horizontal direction. It has been found that the amplitudes are higher in horizontal direction in the drive end and increased when unbalance increased
In case of parallel misalignment the amplitudes are measured at drive end in vertical and Axial Directions. The highest value of overall amplitude is produced in vertical direction. It isobserved that the amplitudes are higher in vertical direction in the drive end and increased when misalignments are increased

ISSN: 2321 9653; IC Value: 45.98; SJ Impact Factor: 7.538 Volume 10 Issue XI Nov 2022 Available at www.ijraset.com

[1] Yunkai Wu,Bin Jiang,Yulong Wang,Incipient winding fault detection and diagnosis for squirrel cage induction motors equipped on CRH trains(2019),ISA Transactions Elsevier
[2] Tomas,Garcia Calva,Daniel Morinigo Sotelo,Vanessa Fernandez Cavero and Rene Romero Troncoso, Early Detection of Faults in Induction Motors (2022),Energies MDP
[3] Garcia, M.; Panagiotou, P.A.; Antonino Daviu, J.A.; Gyftakis, K.N. Efficiency Assessment of Induction Motors Operating UnderDifferent Faulty Conditions(2019). IEEE Trans. Ind. Electron
[4] Sumislawska, M.; Gyftakis, K.N.; Kavanagh, D.F.; McCulloch, M.D.; Burnham, K.J.; Howey, D.A. The Impact of ThermalDegradation on Properties of Electrical Machine Winding Insulation Material. (2016)IEEE Trans. Ind. Appl.
[5] Gangsar, P.; Tiwari, R. Comparative investigation of vibration and current monitoring for prediction of mechanical and electricalfaults in induction motor based on multiclass support vector machine algorithms.(2017) Mech. Syst. Signal Process.
[6] V. Hariharan and PSS. Srinivasan (2009), Vibration analysis of misaligned shaft ball bearing system, Indian Journal of Science and Technology, Vol.2, 45 51

[7] Arun Kr. Jalan, A.R. Mohanty (2009), Model based fault diagnosis of a rotor bearing system for misalignment and unbalance under steady state condition, Journal of Sound and Vibration 327, 604 622.
[8] Vaggeeram Hariharan, and PSS Srinivasan (2011) Vibration analysis of parallel misaligned shaft with ball bearing system, Songklanakarin J. Sci. Technol.62 33 (1), 61 68
[9] Xuejun Li, Ke Wang and Lingli Jiang (2012) Rotor Crack Detection by UsingMulti vibration Signal from the Basement,JOURNAL OF SOFTWARE, VOL. 7, NO.5 959 965.
[10] Jigang Wu, Xuejun Li and Kuanfang He(2012), Rotor Crack Fault Diagnosis based on Base and Multi sensor Adaptive Weighted Information Fusion, JOURNAL OF SOFTWARE, VOL. 7, NO. 7, 1585 1592
[11] Practical machinery vibration analysis andpredictive maintenance, Paresh Girdhar and C.Scheffer, Newnes publication Elsevier, First edition, 2004
