10 IX September 2022 https://doi.org/10.22214/ijraset.2022.46725

Anees Ahmad1, Jamal Ahmed Khan2, Azeem Ullah Shah3
Research Scholar, 2Lecturer, 3Research Scholar, Department of Civil Engineering, UET Taxila, Pakistan

Abstract: Urban traffic congestion is one of the major problems of the developing countries. Growing volumes of through traffic are often attributed to traffic flow challenges. Bypass roads are constructed to reduce congestion in the city center. Bypass diverts through traffic away from town centers leaving local streets to local traffic. Often these bypasses are built to accommodate increasing volumes of traffic particularly truck traffic. The aim of this research is how to improve travel time on bypass roads and to study various traffic congestion management approaches in big cities. Traffic volume, travel time, vehicle specifications and geometric parameters were determined in the field as input for the microsimulation model. Different facilities were incorporated on bypass road to improve travel time. Calibration and validation of the model were done, and results of traffic volume and travel time were compared with actual field data. The results obtained shows that in most of the cases congestion was found near the intersections. The options of a flyover, bus bays, pedestrian overhead bridge and slip lines were assumed in the analysis; in result highest travel time decrease on bypass road due to provision of slip lines.
Keywords: Congestion, Bypass Road, Travel Time, PTV Vissim Software, Micro-Simulation
Bypass roads are constructed to shift heavy traffic from the city centre to reduce traffic congestion. It is very effective in reducing traffic congestion as heavy loaded vehicles diverted to an alternate route reducing burden in the main city center route as a result travel time on both routes decreased. Besides bypass roads, there are many alternatives which are used by other countries to reduce traffic congestion. Stockholm introduces congestion pricing in 30 km2 area Traffic across the cordon dropped immediately, leading to dramatic congestion reduction all over the city [1]. Heavy engineering actions like ring road development, building new roads etc. Push and Pull strategies including promoting public transportation, biking, and walking as well as reducing the use of cars. For managing traffic congestion, a combination of push and pull techniques as well as heavy engineering solutions is recommended [2] In order to boost revenue, reduce congestion, and improve the environment, Gothenburg implemented a time of day dependent cordon based congestion pricing scheme which results in reducing traffic congestion and environmental pollution [3]. Avissawella and Mawanella constructed new bypass road which attracts residential land uses and gradually the bypass road was also able to attract commercial land use. The potential for attracting vehicle flow is comparable for existing and bypass roads [4]. Free public bus transport was introduced in the Hasselt, the urban busses are free for everybody (not only inhabitants of Hasselt) which increased the use of public transport and decrease the use of private vehicles [5]. In order to enter an 8 km2 region of the city core, Milan established a pricing system. Ecopass, a pass to enhance the quality of the urban environment, is the name given to the program. The following are excluded from fees: motorcycles, public transportation, handicapped vehicles, army and police vehicles, vehicles used for public services, and ambulances. More than the environmental advantages, the biggest social advantages seem to be associated with less traffic and a drop in accidents [6] There is a tendency for equilibrium to be maintained by traffic congestion. There comes a point where traffic congestion makes it difficult to make further journeys during peak hours. Increasing road capacity enables more vehicle movement, which causes renewed congestion with increased traffic levels [7]. Bypassing areas with heavy traffic, expanding the capacity of streets and roads, and enhancing driving conditions (by eliminating gridlock, raising speeds to the lowest possible levels for pollution, and promoting smoother driving), it is possible to reduce fuel consumption and the release of gases that contribute to the greenhouse effect [8]. Bypass roads alters land use, travel behavior by diverting traffic from city center to increase the flow, reduce travel times, improve accessibility & road safety, reduce noise and overall improve the environment in metropolitan areas [9] Oslo has improved public transportation to reduce congestion by segregating it from other traffic, giving it priority at crossings, maximizing stop distances, reducing the amount of parking spaces, relocating parking spaces, implementing a digital ticketing system, and raising parking prices by 50% [10]. PTV Vissim, one of the most often used microscopic traffic simulators, was primarily created for use in European traffic situations but is now increasingly being used in developing nations. Simulation has been recognized as one of the best tools for modeling of traffic flow under homogeneous as well as heterogeneous conditions. In comparison to analytical data, the outcomes from a simulation model that has been validated would be more accurate [11]
ISSN: 2321 9653; IC Value: 45.98; SJ Impact Factor: 7.538
Volume 10 Issue IX Sep 2022 Available at www.ijraset.com
In recent years, due to rapid increase in population and urbanization traffic congestion become a common problem in all big cities. Bypass roads are constructed to mitigate traffic congestion, decrease travel time, reduce accidents rate, increase traffic safety and diminish the appearance of bottlenecks. For a certain period of time the bypass roads perform its function well but after sometime due to change in land use pattern and increase in volume of traffic bypass fails to perform its function effectively. In Pakistan, bypass roads are not properly designed, constructed and maintained to ensure its function in future.
The overall aim of the study is to reduce congestion, improve travel time and the functionality of the bypass road The following is the list of objectives to achieve the specific aim.
1)
2)
3)
investigate
model
cities.
roads.
issues on bypass roads.
ISSN: 2321 9653; IC Value: 45.98; SJ Impact Factor:
10 Issue IX Sep 2022
at www.ijraset.com
port city
KPK
Punjab.
not
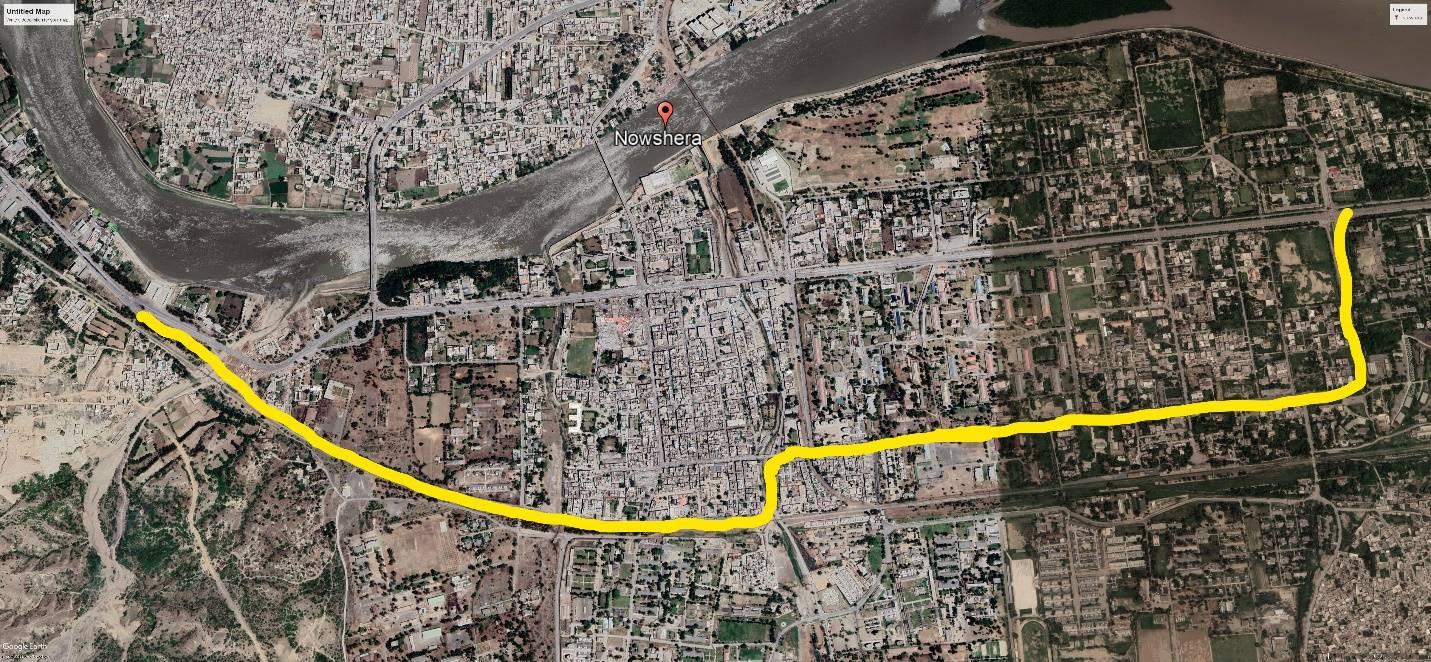
in Khyber Pakhtunkhwa province between Peshawar and Attock,
by Pakistan's longest roadway, National Highway 5. It has a 1756
N5
It has a central business district and a cantonment area
An alternate route (bypass road) is used by these heavy loaded
Total length of Nowshera
4.7km.
four
having two lanes in each direction. Fig 2 shows Nowshera
2321 9653; IC Value: 45.98; SJ Impact Factor: 7.538
10 Issue IX Sep 2022 Available at www.ijraset.com
carried out for seven days of a week from Monday to Sunday. Cameras were fixed at both ends of bypass road
peak hours and non peak hours of the day.
traffic volume
video camera method was chosen and
travel time of vehicles using full bypass road
Video with manual transcription method was used for travel time survey. Video cameras were fixed at both ends of the bypass road which recorded vehicle entry time and exit time. It also recorded number of vehicles using bypass road. Video was recorded for specific period of time and then number of vehicles and travel time was recorded manually. Vehicles using full bypass road included: Trucks, Tractors, Car, Wagon and Motorcycle. Traffic volume data and travel time data
collected for 7 days at three time periods.
Peak period
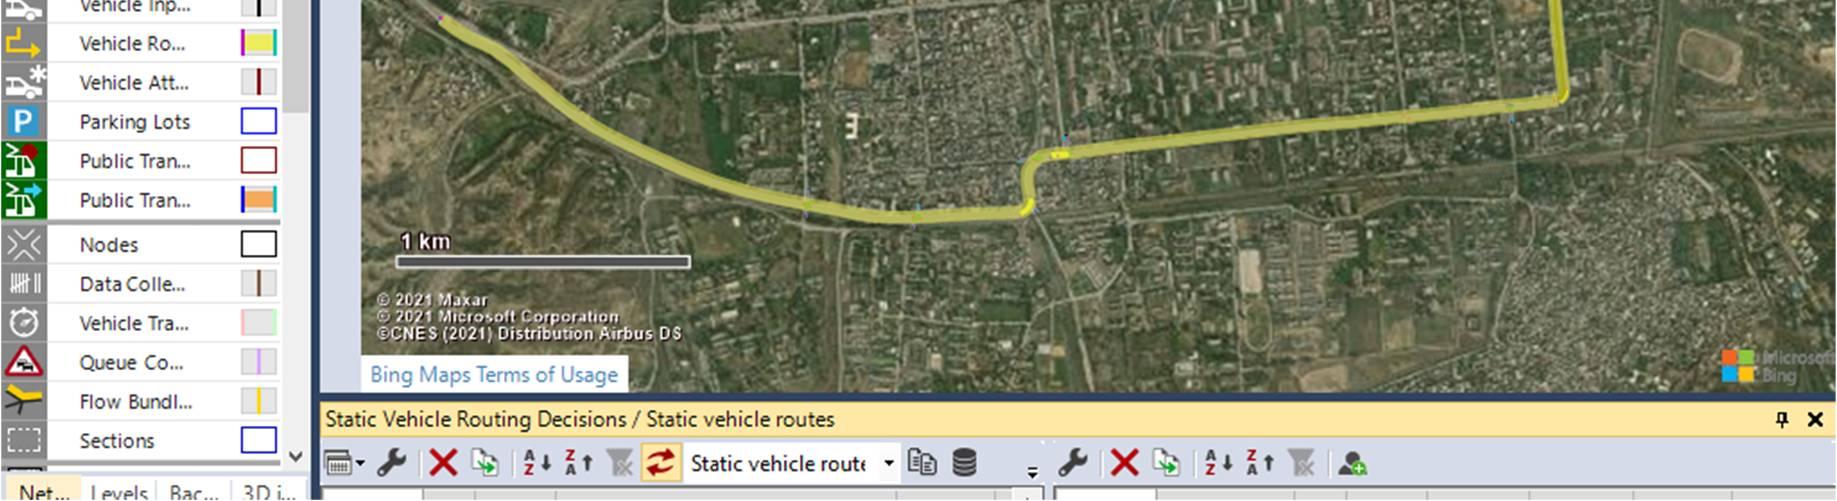
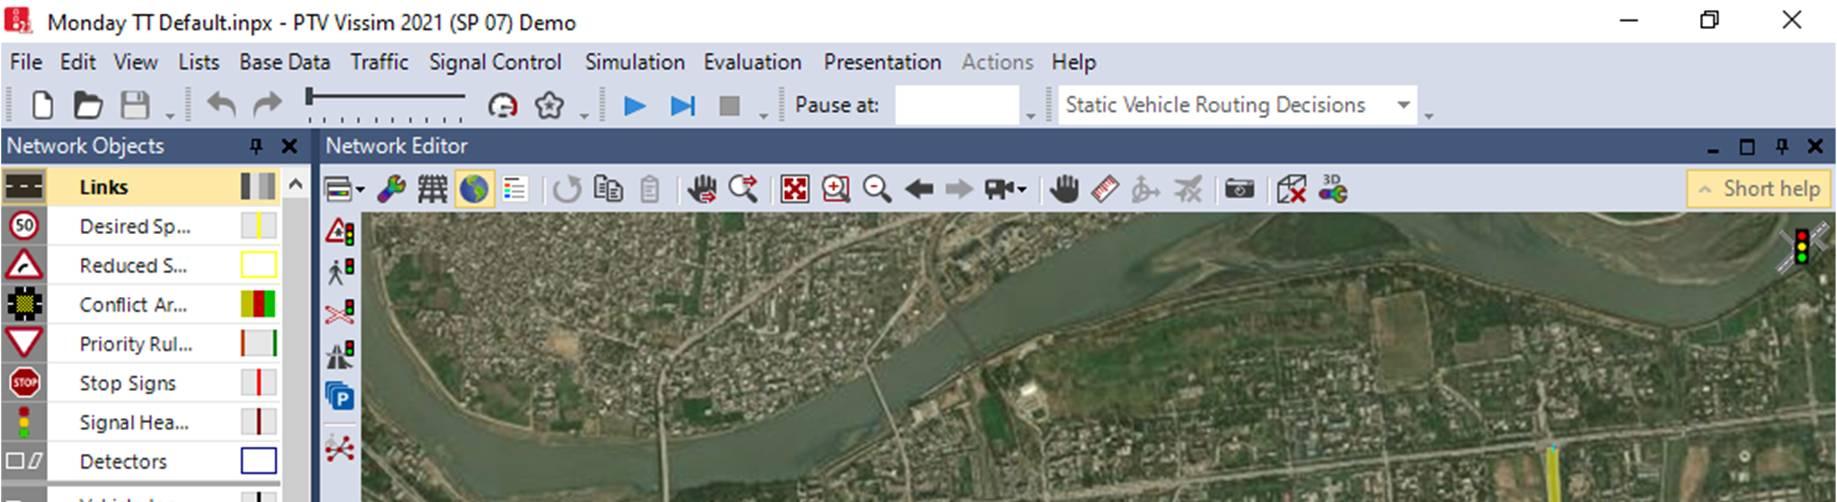
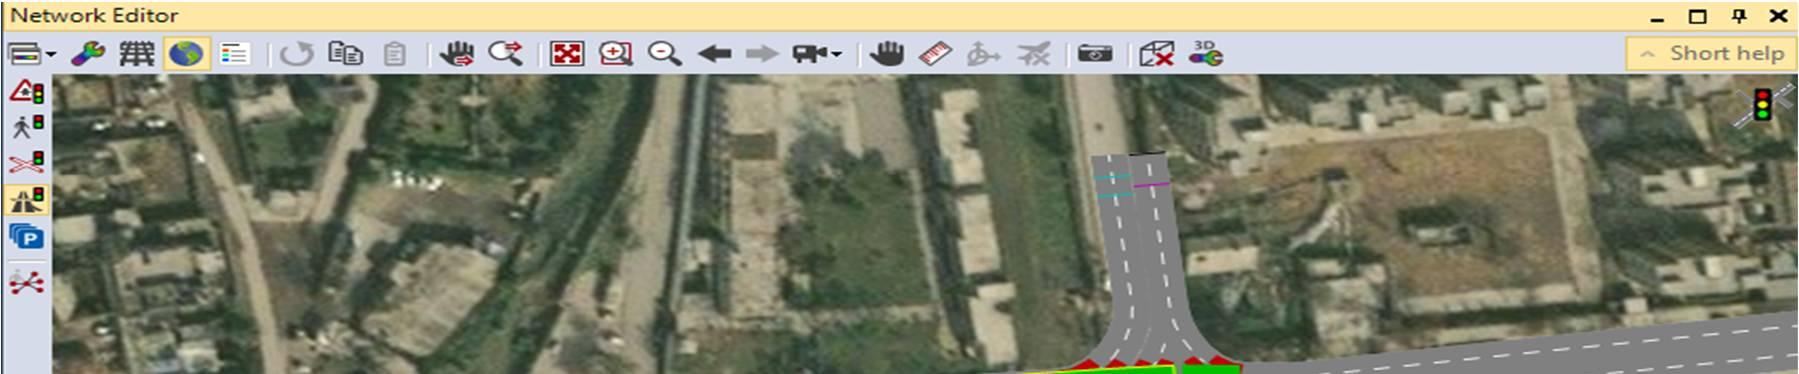
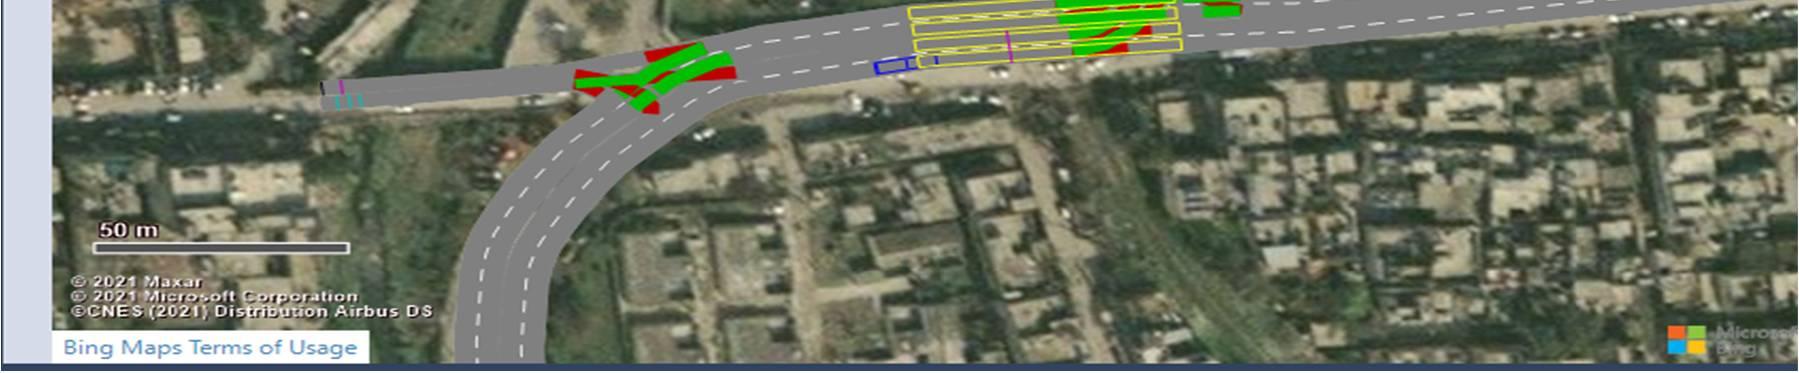
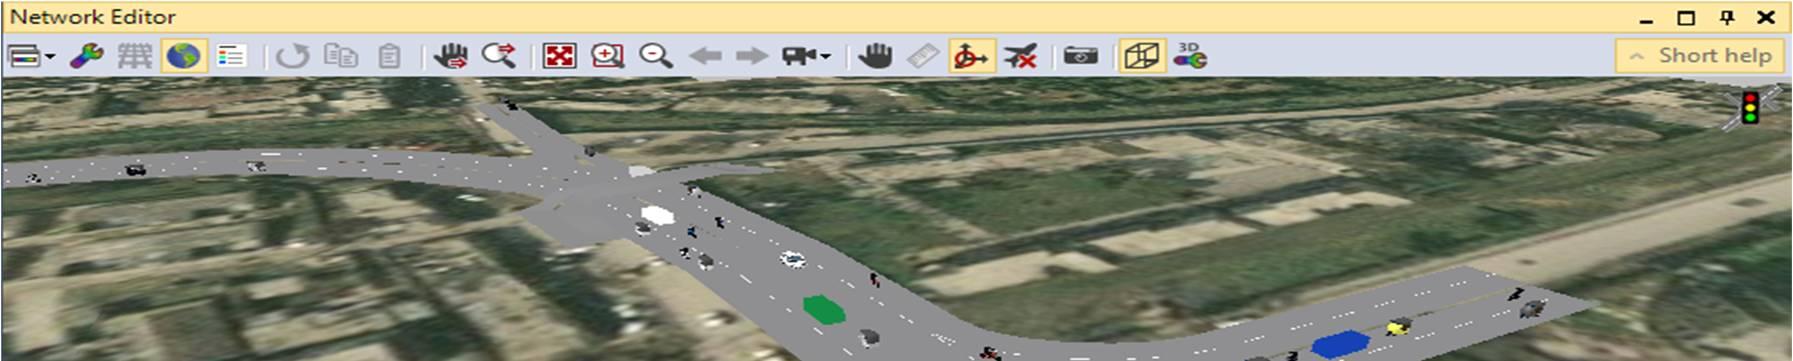
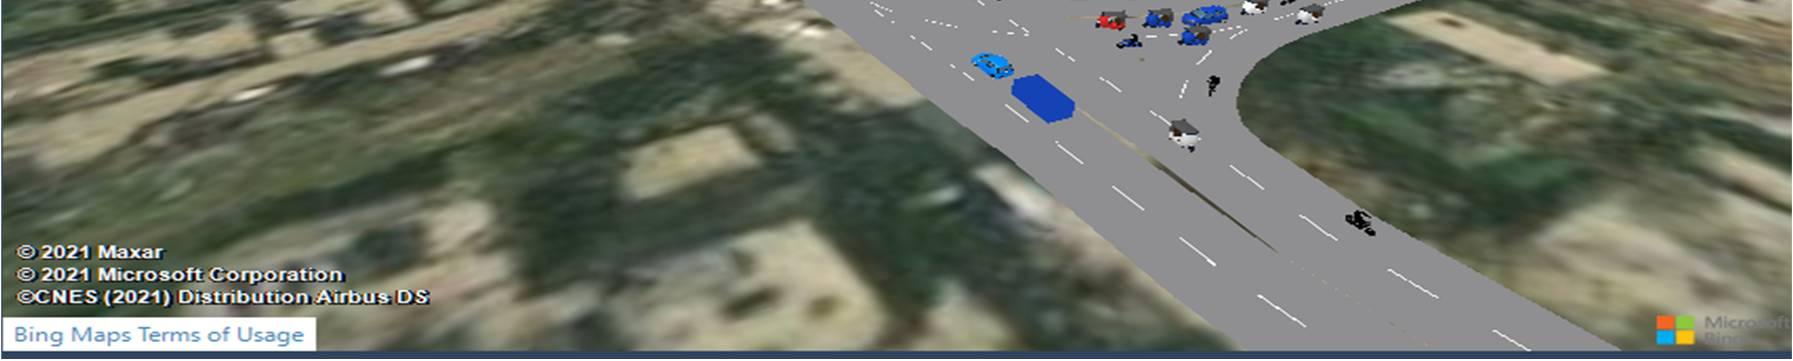
PTV Vissim is a microscopic multi modal traffic flow simulation software package. In Vissim, 4.7 km road was made which simulates actual road condition of Nowshera bypass. Each intersection was created along with conflict points, priority rules, speed breakers and stopping points. Different categories of vehicles i.e car, truck, tractor, wagon and motorcycle were added to the simulation along with speed profile. The results obtained from simulation were compared with the actual field data along with the improvements provided i.e. bus bays, Slip lines, Pedestrian overhead bridge and Flyover. Fig 3 shows Nowshera bypass road drawn in PTV Vissim. Fig 4 shows conflict points and priority rules at intersections of bypass road. Fig 5 shows traffic simulation run in PTV Vissim software.
(IJRASET
ISSN: 2321 9653; IC Value: 45.98; SJ Impact Factor: 7.538
10 Issue IX Sep 2022 Available at www.ijraset.com
time is i.e.,
12.19%
shows facility wise average travel time
time improves 1.88%. By providing only slip lines travel time improves
most congested intersection travel time improves 3.67%. By providing all facilities combinely
providing
time
providing only slip lines travel time
shows facility wise average travel time improvement in east bound.
improves 3.68%. By providing all facilities combinely travel time improves
ISSN: 2321 9653; IC Value: 45.98; SJ Impact Factor: 7.538
10 Issue IX Sep 2022 Available at www.ijraset.com
East Bound Direction
Bus bays
Lines
Bus bays, Ped overhead bridge, Slip Lines
Saddar Flyover only Slip lines, saddar flyover
Bus bays, pedestrian overhead bridge, slip lines, saddar flyover
Facility Provided
1) Different cities are taking different steps to control the congestion depending upon the traffic which include; Congestion pricing, Ring road development, construction of new roads, expanding existing roads, reducing the number of cars on the road, promoting public transport, biking and walking, parking management, Free public bus transport, Bus priority lane and bus priority signal system, Implementation of intelligent transport system (ITS) technology, Introduction of electric vehicles, digital ticketing system reduced the speed limit in the city center and dedicated bicycle lanes to prioritize access for cyclists and to enhance traffic safety.
2) The main reason of bypass failure in Pakistan is that bypass roads are not designed according to bypass standards. Main reasons are: Open access to bypass road due to which local traffic get easy access to bypass road. Movement of pedestrians, parking and stopping of vehicles can be seen at bypass roads. Road side development and land use are not controlled along bypass roads.
3) From the results obtained, it is clear that bypass roads functionality can be improved by providing different facilities i.e. pedestrian overhead bridge, bus bays, slip lines and flyover. West bound average improvement in travel time by providing all facilities is 9.13% while East bound average improvement in travel time is 9.20%. Similarly, average improvement in vehicles travel time at west bound is: (wagon 9.53%, tractor 8.01%, and truck 7%). East bound average travel time improvement of vehicles is: (wagon 9.83%, tractor 7.53%, truck 7.47%).
At first, pedestrian overhead bridge, bus bays and slip lines are recommended as an economical solution. At the later stage, flyover is recommended as an uneconomical solution. For further research it is also recommended to try some other facilities for travel time improvement.
The authors would like to thank the Taxila Institute of Transportation Engineering for providing a research oriented environment They would also like to thank PTV group for providing the VISSIM software used in this study.
[1] The stockholm congestion charges: An overview. 2014.
[2] Nugmanova, et al., Effectiveness of Ring Roads in Reducing Traffic Congestion in Cities for Long Run: Big Almaty Ring Road Case Study. Sustainability, 2019. 11(18).
[3] Börjesson, M. and I. Kristoffersson, The Gothenburg congestion charge. Effects, design and politics. Transportation Research Part A: Policy and Practice, 2015. 75: p. 134 146.
[4] Sewwandi, S. and A. Jayasinghe, An Investigation of the Effects of New Bypass Roads on Build Form in Small Towns in Sri Lanka. Journal of South Asian Logistics and Transport, 2021. 1(1).
[5] Goeverden, C.V., Subsidies in public transport. 2006.
International Journal for Research in
Science & Engineering Technology (IJRASET)
ISSN: 2321 9653; IC Value: 45.98; SJ Impact Factor: 7.538 Volume 10 Issue IX Sep 2022 Available at www.ijraset.com
[6] Rotaris, L., et al., The urban road pricing scheme to curb pollution in Milan, Italy: Description, impacts and preliminary cost benefit analysis assessment. Transportation Research Part A: Policy and Practice, 2010. 44(5): p. 359 375.
[7] Litman, T., Generated Traffic and Induced Travel: Implications for Transport Planning. 18 July 2017.
[8] Puodziukas, V., A. Svarpliene, and A. Braga, Measures for Sustainable Development of Road Network. Transportation Research Procedia, 2016. 14: p. 965 972.
[9] Segola, M., Traffic Congestion and Mobility Solutions for Francistown Road Transportation Network Systems. 2016.
[10] Application form for the European green capital award 2019. 2019.
[11] Bains, M.S., B. Ponnu, and S.S. Arkatkar, Modeling of Traffic Flow on Indian Expressways using Simulation Technique. Procedia Social and Behavioral Sciences, 2012. 43: p. 475 493.