10 XII December 2022 https://doi.org/10.22214/ijraset.2022.48421
ISSN: 2321-9653; IC Value: 45.98; SJ Impact Factor: 7.538 Volume 10 Issue XII Dec 2022- Available at www.ijraset.com

ISSN: 2321-9653; IC Value: 45.98; SJ Impact Factor: 7.538 Volume 10 Issue XII Dec 2022- Available at www.ijraset.com
1 , N.
Bhargav2
1PG Student, Department of Civil Engineering, Nova College of Engineering and Technology, Affiliated to JNTU Kakinada, Jangareddygudem, West Godavari (District), A.P, India
2Guide, Assistant Professor, Department of Civil Engineering, Nova College of Engineering and Technology, Affiliated to JNTU Kakinada, Jangareddygudem, West Godavari (District), A.P, India.

Abstract: The earthquake reconnaissance reports reveal that the failure of beam column joint has contributed to partial or complete collapse of reinforced buildings. The failure of a beam causes only localized effect whereas the failure of a beamcolumn joint causes instability of the whole building under seismic loading. This results in significant economic impact and loss of life. Hence it is essential to avoid failure of beam-column joint. The serious damage to the major structures during recent earthquakes is mainly attributed to lack of ductility in beam-column joint. In the present work, experimental investigation is carried out to study the effect of semi rigid connection in RCC beam column joints of reinforced concrete multi storey buildings. The effectiveness of semi rigid connection and effective positioning (stability approach) is analytically investigated for a typical four-bay four-storey and five-bay seven-storey RC frame with different percentage of joint connections by nonlinear static (pushover) and nonlinear dynamic (time-history) analyses. Poor performance was noted in rigid frame during the prediction of structural damage, lateralstrength and storey drift. The semi rigid connection isprovided in different places and it is found that performance of the structure enhanced in the stability approach. The stability approach exhibited improved performance in terms of roof displacement, for and semi-rigid connection. Keywords: RC-Frame, Pushover, Time history, RCC beam column joint.
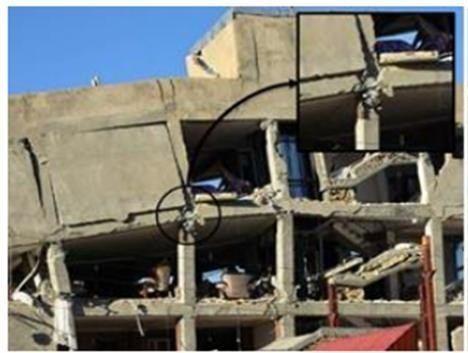
Reinforced concrete framed structures generally develop inelastic deformations when they are subjected to strong earthquakes. Earthquake induced energy is dissipated through the formation of plastic hinges, preferably in the beams rather than in columns. The design approaches should be in such a way to give emphasis to the columns and the beam-column joints since the failure of these regions can affect the integrity and stability of a significant portion of the structure. It is therefore essential to design and detail earthquake resistant columns and connections such that their design strengths are maintained during a large number of inelastic deformation cycles. Based on the observations of previous earthquakes, joint shear failure has frequently occurred in old and nonductile reinforced concrete (RC) moment-resisting frames shown in Figure 1
Beam column joint becomes the most critical part of the structure when poor detailing and unsafe design are adopted in the region. It should be designed in such a way that it resists the lateral load by allowing the flexural members to dissipate the energy absorbed during lateral load.
ISSN: 2321-9653; IC Value: 45.98; SJ Impact Factor: 7.538 Volume 10 Issue XII Dec 2022- Available at www.ijraset.com
As for the design, ductility of the frame plays a major role in resisting the lateral load. The beam-column joint should be ductile enough till the beam and column achieve their maximum load during load transfer. Due to the constituent material thathas little resistance arising from limited strength, a beam column joint is a special part of the structural framework because of its reduced capacity. Joints are severely damaged if significant force is applied during earthquake. The shear stress developed in the core of the joint is a result of moments of opposite signs on the member ends on either side of the joint core. Typically, high bond stress requirements are also imposed on reinforcement bars enteringinto the joint. The axial and joint shear stresses result in principal tension and compression that leads to diagonal cracking and/or crushing of concrete in the joint core.
The forces acting on a beam-column joint are
1) Forces from the beam flexural reinforcement.
2) Forces from the column flexural reinforcement
3) Concrete compressive forces. In the joint core diagonal compression and tension stresses will be developed due to shear forces. As a result of tension stresses diagonal cracking of the concrete core occurs. At this stage the mechanism of shear resistance changes drastically. A diagonal strut is developed in the concrete due to the internal forces. The forces by means of bond transmitted to the joint core from beam and column necessitate a truss mechanism. Shear reinforcement in the horizontal and vertical direction will be required along diagonal failure plane to prevent shear failure by diagonal tension.
Semi-rigid frames are more economical in resisting gravity loads due to reduced connection cost and less moment transfer to column from beams. These connections are widely used and studied in steel structure, precast and prefabricated fields. The semirigid connections would take less moment because of their inherent flexibility, and would also accommodate large rotations without excessive stress concentration effects. Flexibility of the connection is leading to a reduction of seismic loads.
Hence, an attempt was made to use a semi rigid connection in the joint to increase the shear capacity and ductility of the joint without enhancing the number of stirrups to avoid failure in the joint.
ISSN: 2321-9653; IC Value: 45.98; SJ Impact Factor: 7.538 Volume 10 Issue XII Dec 2022- Available at www.ijraset.com
The objectives of the present work are:
a) To model a semi rigid connection system for energy dissipation in thejoints of reinforced concrete framed structures
b) To investigate experimentally semi rigid connections subjected tocyclic loading and to enhance the shear capacity of the joint.
c) To validate the experimental results with FE model and suitable designprocedure for semi-rigid connection.
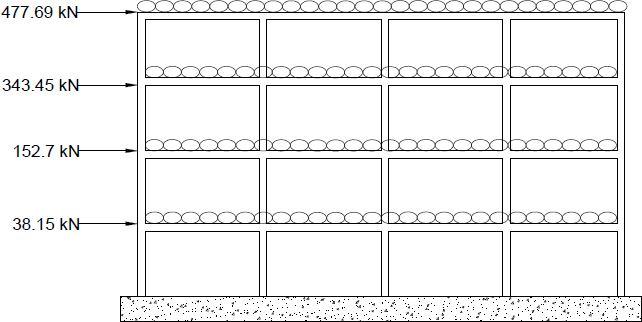
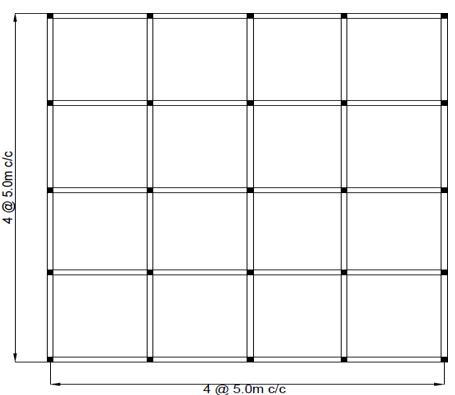
The seismic evaluation of a typical four-storey and seven-storey reinforced Concrete (RC) building by nonlinear static and timehistory analyses using a computer package SAP 2000. To make Semi rigid connection the partial fixity is assigned in the joint as various percentages i.e. 10%, 20%, 30%, 40%, 50%, 60%, 70%, 80%, 90% and it is compared with rigid connections. The performance of the frame with different percentage of fixity of semi rigid connection is evaluated under both non-linear static and dynamic analysis. A typical four-bay four-storey RC building as shown in Figure 3.1 is considered for analytical study. The overall size of the building in a plan is 20.0 m x 20.0 m with a typical bay width of 5.0m in each orthogonal direction.The height of the column is considered as 3.0 m, whereas all the storey’s of building are fully infilled with unreinforced brick masonry of 230 mm thickness. The thickness of roof and floor slab is taken as 120 mm. The building is located on a rock site in seismic zone-V, the region of highest seismicity as per IS 1893:2002. Since the building is symmetric in both orthogonal directions of the plan, torsional response under pure lateral forces is avoided. Unit weights of concrete and masonry infill are considered as 25 kN/m3 and20 kN/m3, respectively. Dead load on the beams consisted of self-weight of beam, slab and masonry infill. Live loads on the floors and roof are assumedas 3.0 kN/m2 and 1.5 kN/m2, respectively. Since the earthquake loads exceed the wind loads and the height of the building is limited, in this structure wind load was neglected.

(a) (b)
Fig. 4 RC frame considered in present study (a) Plan (b) Elevation
Fig. 5 Distribution of seismic loads in the study frame
ISSN: 2321-9653; IC Value: 45.98; SJ Impact Factor: 7.538 Volume 10 Issue XII Dec 2022- Available at www.ijraset.com
Thirteen different load combinations were considered as per IS 456:2000 to determine various internal actions, such as axial forces, bending moments, andshear forces at different sections of frame members as shown in Table-I The members of the frame are designed for the maximum values of axial loads, bending moments and shear forces in the critical load combinations and the adequacy of these sections is checked other load combinations. It is assumed that the grade of concrete in the frame members was M20 with the specified characteristic compressive strength of 20 MPa and grade of reinforcement is Thermo-Mechanically Treated (TMT) bars with the specified yield strength of 415 MPa. All columns of the study are chosen to be of squaresections of size 300mmx300mm. whereas, the size of the beam sections is considered as 300mmx300mm. The design for shear reinforcement in beam and column sections was carried out as per IS 456:2000 design provisions. Earthquake load was considered in +X, -X, +Y and –Y directions. Since a large amount of data is difficult to handle manually, all 13-load combinations are analyzed using the software SAP 2000.
TABLE I
Different load combinations Combinatio n Description 1 1.5DL+1.5LL 2 1.2(DL+LL +EQX) 3 1.2(DL+LLEQX) 4 1.2(DL+LL +EQY) 5 1.2(DL+LLEQY) 6 1.5(DL+EQX) 7 1.5(DL-EQX) 8 1.5(DL+EQY) 9 1.5(DL-EQY) 10 0.9DL+1.5 EQX 11 0.9DL-1.5 EQX 12 0.9DL+1.5 EQY 13 0.9DL-1.5 EQY
TABLE II
Force resultants in critical beam members in different load combinations Load comb. Left end Centre Right end P (kN) V (kN) M (kNm) P (kN) V (kN) M (kNm P (kN) V (kN) M (kNm) 1 -152.9 -179.9 -145.3 -152.9 7 111.1 -152.9 195 -187.1 4 -532.1 -138.8 -98.8 -366 5.4 75.5 -532.1 160.3 -162.7 5 271.5 -149 -133.7 271.5 0.5 86.7 271.5 150 -136.7 8 -624.7 -134.4 -90.4 -624.7 12.5 90.5 -624.7 159.4 -164.5 9 379.8 -147.2 -134 379.8 -0.4 84.9 379.8 146.5 -131.9 12 -575.7 -78.1 -45.5 -575.7 10.1 55.4 -575.5 98.2 -105.2 13 428.8 -76.2 -47.8 428.8 -2.8 49.8 428.8 85.3 -72.6
ISSN: 2321-9653; IC Value: 45.98; SJ Impact Factor: 7.538 Volume 10 Issue XII Dec 2022- Available at www.ijraset.com
A linear analysis is used to determine the presence of irregularities in the structure and to identify the magnitude and distribution of inelastic demands on various components of the lateral-load-resisting system. Such analysis shall not be permitted for buildings with irregularities, where nonlinear procedure must be carried out to evaluate the capacity of structural components under static and dynamic loading conditions. In this study, for semi rigid connection, the percentage rigidity in the connection is varied for 10%, 20%, 30%, 40%, 50%, 60%, 70%, 80%, 90%, stability approach is verified for the frame by nonlinear static analysis and integration time-history analyses. The primary objective of nonlinear static analysis (i.e., pushover analysis) was to determine lateral load carrying capacity, global ductility and failure mechanism of the frame. Pushover analysis is carried out in two stages considering nonlinearities in material and geometry (P-Delta effect). In the first stage, the performance of both normal and link column frames is evaluated under only gravity loads due to dead and live loads. Thus, the beams and columns are subjected to axial force, bending moment and shear forces. The final stage of analysis involved application of gradually increased lateral displacement resembling the fundamental modeshape of the frames. The state of beams and columns at the end of first stage analysis is considered as the initial conditions in the final stage analysis, as a result, the effect of axial loads is considered in determining the moment and shear capacities of frame members.
ISSN: 2321-9653; IC Value: 45.98; SJ Impact Factor: 7.538 Volume 10 Issue XII Dec 2022- Available at www.ijraset.com
Fig.8 Lateral Deformation graph for 4-Storey building forDifferent Percentage of fixity
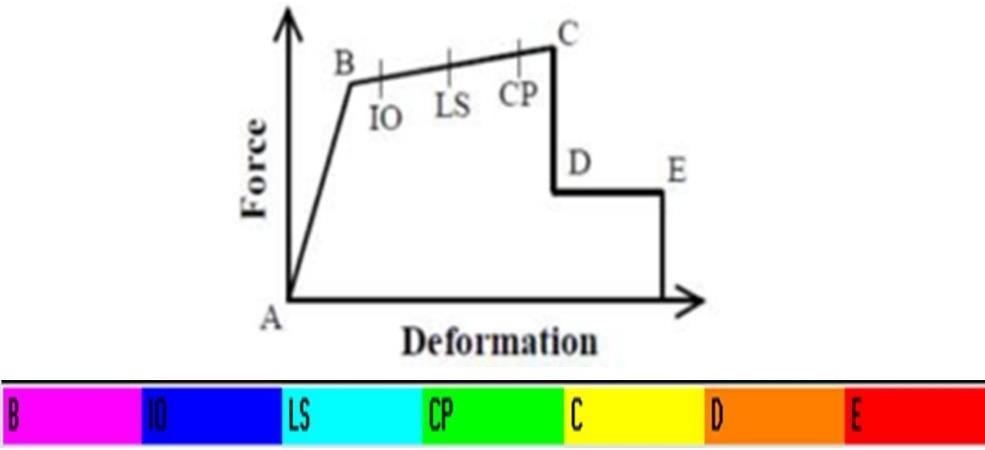
Fig.9 Lateral Deformation graph for 7-Storey building forDifferent Percentage of fixity
To get improved performance in the structure the stability approach is used. The Peak displacement of rigid frame, Semi Rigid and Stability approach (SA)models of the 4-storey and 7-storey building is observed for Northridge earthquake in time-history analysis. Figure 8 and 9 show the roof displacement- time history response of 4-storey and 7-storey building. It can be observed that for stability Approach the displacement reduces effectively by 18.6% for Northridge earthquake load case for 4storey frame model, and the displacement reduces effectively by 31.78% for Northridge earthquake load case for 7-storey building model.
Structural damage can be assessed based on the guidelines given by ATC-40 (1996) and FEMA 440 (2005). Prediction of structural damage is one of important objective of Performance Based Design. It is mainly used to plot the damage grades (performance objectives) like immediate occupancy, life safetyand collapse prevention of a particular structure. A generalized force- displacement characteristic of a non-degrading frame element (or hinge properties) in SAP 2000 is shown in Figure 10.
Immediate Occupancy (IO) performance level shall be defined as the post- earthquake damage state that remains safe to occupy, essentially retains thepre-earthquake design strength and stiffness. Life Safety Performance Level (LS) shall be defined as the post-earthquakedamage state that includes damage to structural components but retains a margin against the onset of partial or total collapse. Collapse Prevention Performance Level (CP) shall be defined as the post- earthquake damage state that includes damage to structural components such that the structure continues to support gravity loads but retains no margin against collapse.
Figure 10 Force-Deformation for the pushover hinge
ISSN: 2321-9653; IC Value: 45.98; SJ Impact Factor: 7.538 Volume 10 Issue XII Dec 2022- Available at www.ijraset.com
TABLEIII
DAMAGE STATE OF 4-STOREY BUILDING Rigid Semi Rigid
Grades Steps Disp(m) Base shear (kN)
IO 2 0.05659 107.105
Grades Steps Disp(m) Base shear (kN)
IO 2 0.064602 117.819
LS 4 0.122989 176.303 LS 4 0.124544 175.359
CP 4 0.122989 176.303 CP 5 0.17787 203.415
Performance pt 0.080 140.665 Performancept 0.080 147.206
Grades Steps Disp(m) Base shear(kN)
IO 2 0.083315 129.124
LS 4 0.147063 182.686
CP 5 0.206516 211.175
Performance pt 0.092 160.12
Approach frame, increases the base shear and also an increase in the rigidity of the structure is observed. The overall performance level of the Stability Approach frame for 4-storey building models was found between IO-LS (Immediate Occupancy to Life Safety). Performance point is higher for the model consisting Stability Approach when compared with the rigid frame and semi rigid Frame. The lateral load carrying capacity of the models for the 7-storey building at different roof displacement levels was determined by non-linear static analysis. For normal frame the flexural yielding of the ground storey columns was observed at the lateral load of 336.839 kN corresponding to the roof drift of 83.9 mm. For Semi rigid frame, the flexural yielding of the ground storey columns is observed at the lateral load of 394.032 kN corresponding to the roof drift of 162 mm. For Stability Approach in the frame, the flexural yielding of the ground storey columns is observed at the lateral load of 370.34 kN corresponding to the roof drift of 121 mm. Table IV shows the damage state of all the models for 7- storey building. In Stability Approach for 7-storey building models the performance point was found between IO-LS (Immediate Occupancy to Life Safety). Performance point is higher for a model consisting Stability Approachwhen compared with the rigid frame and Semi Rigid Frame.
TABLEIV
DAMAGE STATE OF 7-STOREY BUILDING Rigid Semi Rigid
Grades Steps Disp (m) Base shear (kN) Grades Steps Disp (m) Base shear (kN) IO 3 0.083959 336.839 IO 3 0.162133 394.032 LS 5 0.271404 455.526 LS 6 0.406627 502.308 CP 6 0.37845 493.878 CP 7 0.466789 518.321 Performancept 0.078 325.274 Performance pt 0.116 340.284
Stability Approach
Grades Steps Disp(m) Base shear (kN)
IO 3 0.121326 370.34 LS 6 0.407808 501.848 CP 7 0.726757 552.907 Performancept 0.142 390.23
ISSN: 2321-9653; IC Value: 45.98; SJ Impact Factor: 7.538 Volume 10 Issue XII Dec 2022- Available at www.ijraset.com
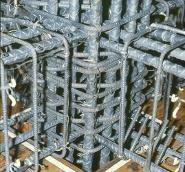
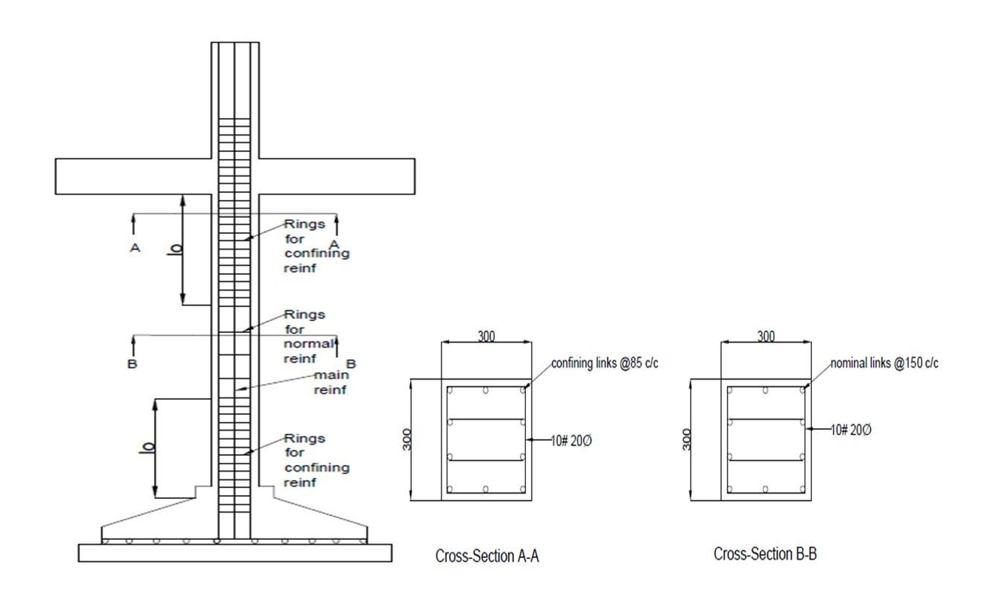
The fundamental assumptions of frame analysis is that the joints are strong enough to withstand the forces produced by the loads (moments, axial and shear forces) and transfer the forces from one structural feature to another (beam to column in most cases) by Subramanian and Rao (2003). The assumption of rigidity of joints often ignores the properties of more shear forces established within them. Actually, the most of the brittle failure occurs due to shear and cannot be deemed as an acceptable structural performance especially during earthquakes. Thus, a proper understanding of the joint behaviour is imperative in designing earthquake-resistant joints. The present study aims at developing an innovative methodology to confine the joint region. The confinement of joints is achieved by two ways one is the inclusion of steel plate with shear connector for plastic hinge distance and second is use of wire mesh as replacement of transverse reinforcement. An external beam-column joint for a six-storey building has been considered for the present investigation. The details regarding the design of joint region and experimental studies on the same are discussed in the following sessions.
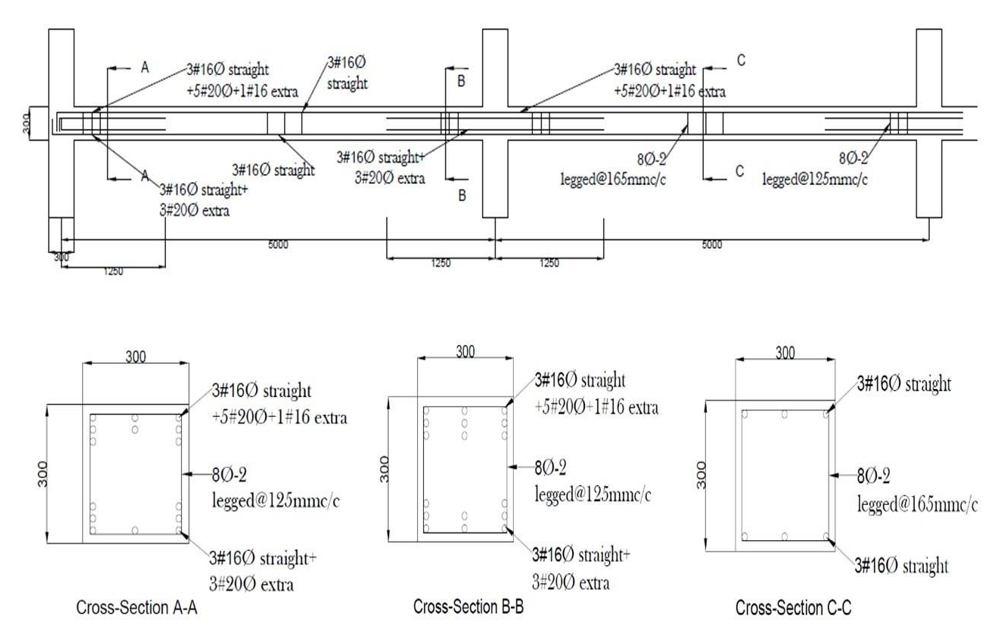
Member Overall size(L x B x H) Clear cover (mm)
Longitudinal reinforcement Transverse reinforcement(mmc/c)
Beam 4000x 300 x 400 25 20 (4nos) 8 @150 column 3350 x 300 x 530 25 20 (6nos) 8 @150
Concrete mix is designed for a compressive strength of 20 MPa. The target cube compressive strength of the design mix for the specified standard deviation value of 4.0 MPa according to IS 10262:1982 provisions is determined to be 26.6 MPa. The mixing ratio for concrete is 1.00: 1.62: 2.33 (cement: sand: coarse aggregate) with a water-cement ratio of 0.5. The average concrete compressive strength of 28 days is 27.9 MPa, which has comparison with the target cube strength of 26.6 MPa. However, on the day oftesting, the compressive strength of concrete was found to be 31.7 MPa, whichis around 15 % higher than the compressive strength of 28 days.
ISSN: 2321-9653; IC Value: 45.98; SJ Impact Factor: 7.538 Volume 10 Issue XII Dec 2022- Available at www.ijraset.com
TABLEVII
Sl.No Sieve size (mm)
Percentage of passing Coarse aggregate Fine aggregate
1 12.5 1002 10 96 100 3 4.75 75 95 4 2.36 9.8 89.5 5 1.18 0 70.7 6 0.6 - 50.7 7 0.3 - 16.7
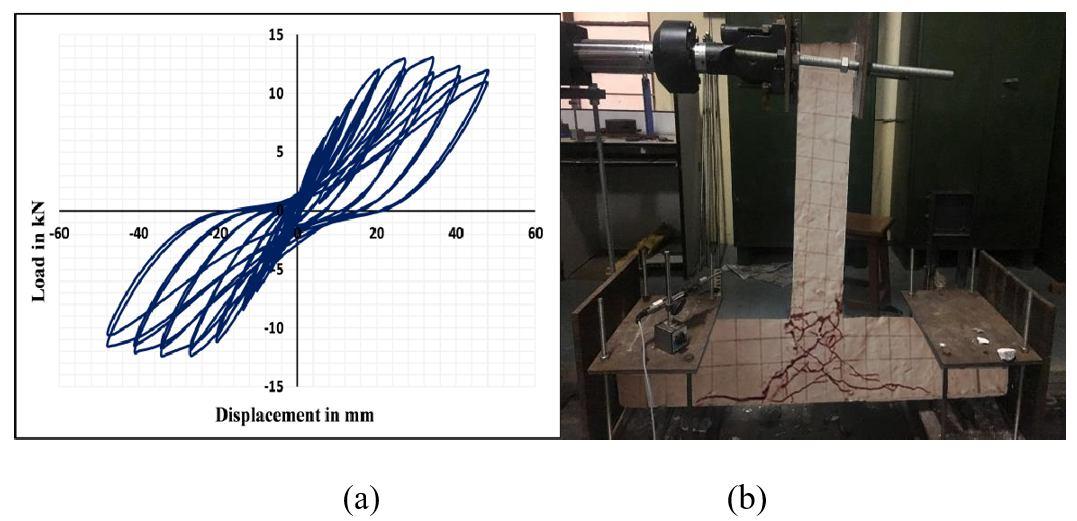
The test rig comprised of a reaction frame composed of steel I-section with intermediate stiffeners at regular intervals as a vertical member. Both members were firmly held to the laboratory strong floor by means of steel studs. The base of the actuator was connected to the vertical members of the reaction frame, which was firmly attached to the vertical member of the reaction frame using high strength steel bolts. The specimens were tested with the column in the horizontal position, simply supported at both the ends. A cyclic load was applied at the beam tip using a hydraulic actuator of ± 125 mmstroke. The column ends were supported laterally with steel bulkhead against areaction frame. The hydraulic actuator was used to apply lateral load to the beam-column jointin the beam end. The actuator had a capacity of 50 Tonnes (both tension and compression) with a maximum stroke length of 125 mm in each direction. The piston of the actuator is set ata distance of 125mm position, so that, the piston can move 125mm in each direction. Figure 11 show schematic diagrams of the experimental setup.
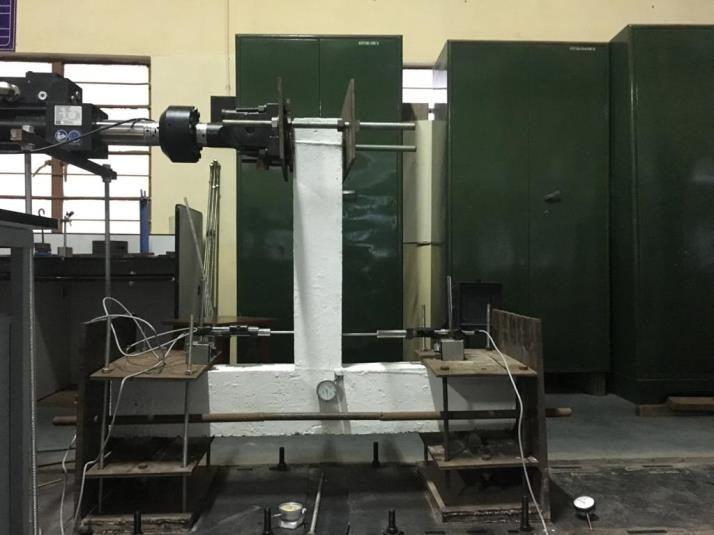
Figure 12 Experimental results of (a) Load versus Deflection curve (b) Damage pattern
ISSN: 2321-9653; IC Value: 45.98; SJ Impact Factor: 7.538 Volume 10 Issue XII Dec 2022- Available at www.ijraset.com
1) The test results of the specimens designed as per IS456:2000 and IS13920: 2016 confirmed structural deficiency of the beamcolumn joints. The specimens experienced hybrid local damage and a failure mechanism characterised by the joints’ shear damage in the form of cross-diagonal cracks.
2) All specimens with plates and mesh, exhibited enhanced behaviour where damage occurred in the beam region; suggesting it was the outset of a beam hinge (BH) mechanism, and then small diagonal cracks propagated in the joint after drift of 3.0%.
3) The energy dissipation levels achieved by the specimens with the plates and mesh are generally higher than those achieved by the specimens designed as per IS456:2000 and IS13920:2016.
4) IS13920:2016 showed limited rotation while the specimens with steel plate showed enhanced fixed-end beam rotation, inferring that the rigidity is reduced.
5) The beam rotation of IS13920:2016 was much smaller indicating the absence of the plastic hinge in the specimens.
6) The beam rotations of the IS13920:2016 at the maximum load was 0.025, while the beam rotations of the specimens with plates and mesh at the maximum load were 0.023 radians (B WOSC); 0.026 radians (BC WOSC); 0.0245 radians (B WSC); and 0.0295 radians (BC WSC). Moreover, the maximum rotation of BC WSC was comparable to that of specimen IS13920. extending to around 0.0465 radians at failure.
7) On the basis of joint shear strength, all the specimen with plates and mesh proved more effective than IS13920.
8) The ductility of the specimens with plates, shear connectors and mesh are higher compared to that of the control specimen (IS 13920). The ductility of the specimens JM, BCM, B WOSC and BC WSC was enhanced by about 35, 24.15, 23.13 and 33.9%, respectively.
[1] Abbas, A. A., Syed Mohsin, S. M., & Cotsovos, D. M. (2014). Seismic response of steel fibre reinforced concrete beam–column joints. Engineering Structures, 59, 261–283.
[2] Alavi-Dehkordi, S., Mostofinejad, D., & Alaee, P. (2019). Effects of high- strength reinforcing bars and concrete on seismic behavior of RC beam- column joints. Engineering Structures, 183, 702–719.
[3] Allam, S. M., Elbakry, H. M. F., & Arab, I. S. E. (2018). Exterior reinforced concrete beam column joint subjected to monotonic loading. Alexandria Engineering Journal, 57(4), 4133–4144.
[4] Ataei, A., Bradford, M. A., & Liu, X. (2016). Experimental study of flush end plate beam-to-column composite joints with precast slabs and deconstructable bolted shear connectors. Structures, 7, 43–58.
[5] Bedirhanoglu, I., Ilki, A., & Kumbasar, N. (2011). Innovative Techniques for Seismic Retrofitting of RC Joints. Innovative Materials and Techniques in Concrete Construction, 243–251.
[6] Choi, H.-K., Choi, Y.-C., & Choi, C.-S. (2013). Development and testing of precast concrete beam-to-column connections. Engineering Structures, 56, 1820–1835.
[7] Dabiri, H., Kaviani, A., & Kheyroddin, A. (2020). Influence of reinforcement on the performance of non-seismically detailed RC beam-column joints. Journal of Building Engineering, 31, 101333.
[8] Daryan, A. S., Sadri, M., Saberi, H., Saberi, V., & Moghadas, A. B. (2012). Behavior of semi-rigid connections and semi-rigid frames. The Structural Design of Tall and Special Buildings, 23(3), 210–238.
[9] Kadarningsih, R., Satyarno, I., Muslikh, & Triwiyono, A. (2017). Analysis and Design of Reinforced Concrete Beam-column Joint Using King Cross Steel Profile. Procedia Engineering, 171, 948–956.
[10] Kaung, J. S., & Wong, H. F. (2011). Effectiveness of Horizontal Stirrups in Joint Core for Exterior Beam-Column Joints with Nonseismic Design. Procedia Engineering, 14, 3301–3307.
[11] LeonR.T. (1990). Shear Strength and Hysteretic Behavior of Interior Beam- Column Joints. ACI Structural Journal, 87(1).
[12] Montava, Irles, Pomares, & Gonzalez. (2019). Experimental Study of Steel Reinforced Concrete (SRC) Joints. Applied Sciences, 9(8), 1528.
[13] Murad, Y. (2020). Joint shear strength models for exterior RC beam-column connections exposed to biaxial and uniaxial cyclic loading. Journal of Building Engineering, 30, 101225.
[14] Ngo-Huu, C., Nguyen, P.-C., & Kim, S.-E. (2012). Second-order plastic-hinge analysis of space semi-rigid steel frames. Thin-Walled Structures, 60, 98–104.
[15] NZS 3101(1995). Concrete structures standard, Part 1 and 2, Code and commentary on the design of concrete structures. ‘New Zealand Standard, New Zealand.
[16] Parate, K. N., & Kumar, R. (2018). Simplified empirical model for shear strength of RC beam–column joints. Asian Journal of Civil Engineering, 20(1), 87–111.