10 XI November 2022 https://doi.org/10.22214/ijraset.2022.47678
ISSN: 2321 9653; IC Value: 45.98; SJ Impact Factor: 7.538


Volume 10 Issue XI Nov 2022 Available at www.ijraset.com

ISSN: 2321 9653; IC Value: 45.98; SJ Impact Factor: 7.538
Volume 10 Issue XI Nov 2022 Available at www.ijraset.com
1, 3School of Civil Engineering and Transportation, South China University of Technology, Guangzhou, PR China 2Department of Civil Engineering, University of Engineering and Technology, Peshawar, Pakistan
Abstract: Bagasse ash (BA) was used as filler in hot mix asphalt. Mineral fillers in asphalt concrete mixes have a significant influence on asphalt concrete performance. Although mineral filler is just a minor percentage of the total performance of asphalt concrete, it plays a critical function. Bagasse Ash (BA) was utilized as a filler ingredient to test and assess the performance of asphalt concrete. BA was used in variable ratios to replace Stone Dust (SD) in road construction. Filler was used in varying quantities (4%, 5.5%, and 6.5%). Furthermore, BA is used to replace the traditional SD filler in partial replacements of 10%, and 20%, as well as full replacement of SD. The Marshall Mix Design Method was used with three different amounts of bitumen, namely 4%, 4.3%, and 4.6%. By using National Highway Authority’s (NHA) general criteria for Optimum Binder Content, a total of 108 samples were produced. The prepared mixes showed good outcomes, and the majority of them passed the NHA's main requirements. Some of the mixtures do not meet the VMA and VFA requirements given in MS 2 Asphalt Institute 2014. Two forms of performance testing are the Dynamic Modulus Test and the Wheel Tracking. A total of twelve OBC samples are evaluated for wheel tracking and dynamic modulus. Bagasse Ash has been tested in the lab and found to be capable of being used as filler in both partial and full replacement of conventional stone dust filler.
Keywords: Asphalt Concrete, Bagasse Ash, Stone Dust, Wheel Tracker Test, Dynamic Modulus
Sugarcane bagasse is a byproduct of the sugarcane industry that is collected during the extraction of sugarcane for sugar manufacturing. In Pakistan, the sugar making sector consumes roughly 42 million metric tonnes of sugarcane and generates about 11 million metric tonnes of bagasse, with a capability of producing around 0.27 million metric tonnes of BA (bagasse ash) (Statistics 2007). Heat is required for sugar production, which is generated by burning sugarcane. When sugarcane bagasse is burned, bagasse ash (BA) is created as a waste product in the form of ash. At a moisture percentage of 50%, each tonne of sugarcane produces about 0.62 percent residual ash and 26 percent bagasse. Pakistan has a huge road network with lengthy stretches of asphalt pavement. Its road network is mostly made up of flexible pavements. In Khaberpakhtun Khwa (KPK) province in Pakistan, stone dust is frequently utilised as a filler material in wearing courses under the National Highway Authority (NHA). Bagasse ash (BA), being a fine material, has the capability to be used as a filler material in asphalt concrete for pavement designs. The aim of this study is to investigate the usage of bagasse ash as filler and evaluate the performance of asphalt mixtures modified with BA filler. Pakistan was one of the top ten sugarcane producing countries, with Brazil producing 455 million metric tonnes and Pakistan producing 44 million metric tons. According to the FAO and UN, the total output is 63.7 million metric tonnes. Pakistan has 11.3 million hectares of harvested land, according to FAO estimates.
KPK, a province of Pakistan, has a sugarcane production capability of around 4.28 million metric tons. Only seven sugar factories are now operational in KPK. There are a total of 81 sugar mills in Pakistan [2]. As a result, Pakistan produces a considerable amount of sugarcane as a consequence of the development of BA. After extracting the juice from the sugarcane, the sugar mills burn the bagasse to use as fuel, producing bagasse ash. Bagasse ash is subsequently discarded in open holes or on open ground, posing major ecological risks. Bagasse ash comes in the form of a fine powder. As a result, it can be employed as a filler material in the wearing course of flexible pavements. Traditionally, SD (stone dust) is used as a filling component. Since it also has the ability to be used as a filler, BA can be employed as such. It would have a very favourable impact on the environment if it were used as filler material since it would recover the discarded land. Pakistan is one of the top ten nations that produce sugar. Sugarcane has such a large production capacity that it also produces a lot of BA. The goal of this study is to use bagasse ash as filler in the wearing course of asphalt.
ISSN: 2321 9653; IC Value: 45.98; SJ Impact Factor: 7.538 Volume 10 Issue XI Nov 2022 Available at www.ijraset.com
Hot mix asphalt (HMA) concrete is a mixture of aggregates and AC (asphalt cement). The aggregate serves as a structural skeleton, and the AC acts as an adhesive in a mixture. The properties of the aggregate have a direct and significant effect on the performance of asphalt pavements. Asphalt concrete is the most commonly used material in the pavement due to its superior service performance in providing driving comfort, stability, durability, and water resistance. The filler material is defined as any substance that passes through sieve no. 200 with a weight of at least 70% in accordance with AASHTO M17 and NHA specifications. The mineral filler plays a vital role in the overall behavior of the asphalt concrete mixture. Generally, bitumen becomes very thin when heated, and similarly, when only bitumen is used in the asphalt without any fine agent, the bond between the aggregates and the bitumen is very weak.
Thus, the filler, although a small part, if used along with bitumen, increases the viscosity of the bitumen, making it thicker and forming a strong bond between the aggregates and the bitumen. A combination of bitumen and filler is known as bitumen mastic. The bitumen mastic, which is a thicker and longer lasting material, improves the cohesive and adhesive characteristics of the asphalt. As compared to the film of bitumen alone, it also provides a thick, strong film around the aggregate particles. By altering the porosity, the filler material helps improve the permeability of asphalt. Due to its angular and abrasive structure, the filler material enhances friction between the aggregates when used with the bitumen. According to its chemistry, filler enhances the thickness of bitumen, making the asphalt more resistant to rutting and other issues. Although the mineral filler is only a minor proportion of the asphalt, it does have a major influence on the overall performance and behavior of the asphalt.
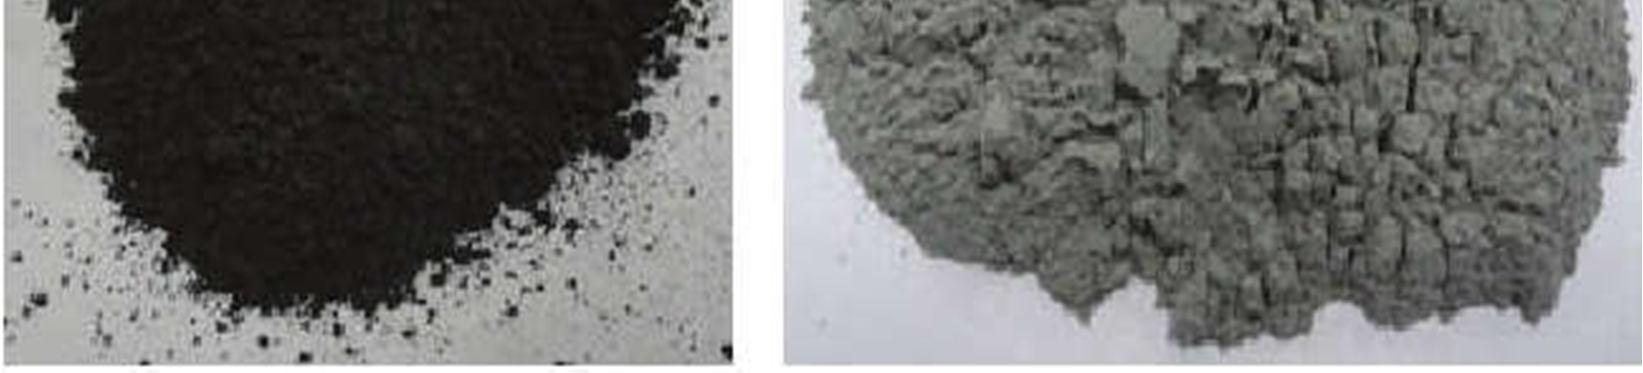
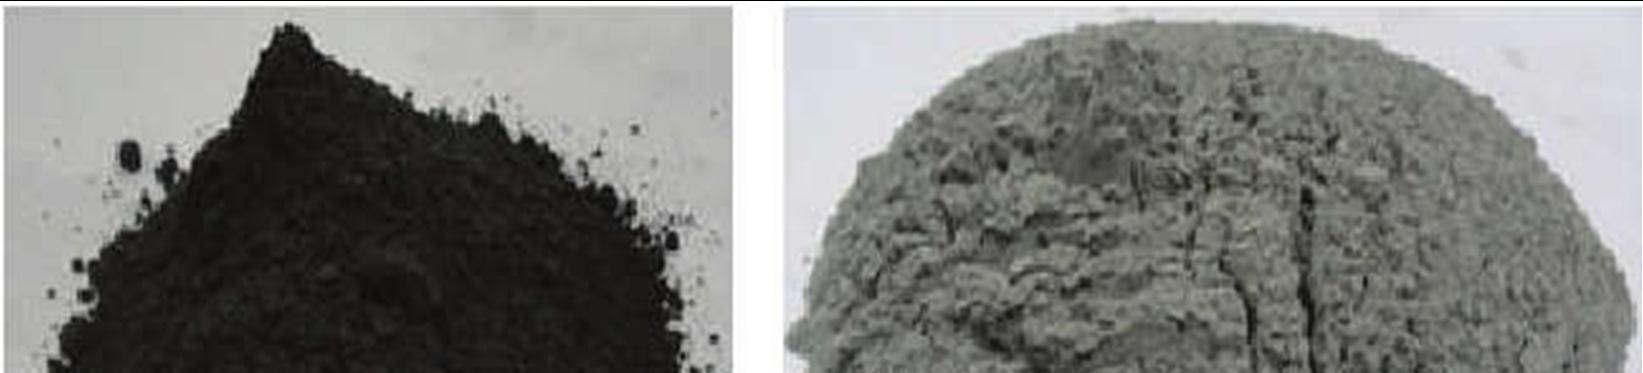
Table 1 the AASHTO M 17 Mineral Filler properties.
Designation of Sieves
Percent passing by weight millimeter Inches 0.600 30 100 0.300 50 95 100 0.075 200 70 100
Figure 1 the mineral filler components.
Binder, mineral aggregates, and air spaces are the main components of asphalt concrete. Asphalt binder and mineral filler make up the mastic (mineral aggregate that passes screen no. 200 or less). In modern times, it's common to think of asphalt concrete as a combination of mastic covered particles rather than pure bitumen coated aggregates. The filler ingredient in bitumen mastic has gained popularity in the asphalt industry because of its significant influence on asphalt characteristics and HMA performance.
A. Collection of Bagasse Ash
BA was collected through visits to major sugar factories, which included Frontier Sugar Mills Limited, a company that produces sugar. Peshawar’s (KSM) Khazana Sugar Mills Limited (Ltd.) and Mardan’s Sugar Mills Limited (Ltd.) were not in business. The bagasse ash (BA) there had been lying for a long time, and it was also a long way from Peshawar. As a result, the BA from Khazana Sugar Mills Limited in Peshawar was chosen.
ISSN: 2321 9653; IC Value: 45.98; SJ Impact Factor: 7.538
Volume 10 Issue XI Nov 2022 Available at www.ijraset.com
In this research, NHA Class B aggregates are selected. In order to collect the aggregates having the same gradation as prescribed by Class B, field visits to different plants were conducted. At first, aggregates from different plants were collected. Then the aggregates were sieved according to NHA Class B in order to check their gradation. For the said gradation, major plants were visited, and finally, the aggregates from the KARKON plant were selected, which is located near the Peshawar motorway toll plaza.
Bitumen was collected from many plants. The bitumen that is mostly used in KPK is selected. i.e., bitumen of 80/100 penetrability grades were selected. For this purpose, various plants were visited, bitumen was collected, and finally, the bitumen came from the MCL plant, which is located near Jhagra.
The tests performed can be categorized into two classes: Preliminary tests on bitumen and aggregates Principle tests.
1) Preliminary Tests on Bitumen: All the preliminary tests are performed as per AASHTO standards. Preliminary tests include penetration grade, softening point, flash and fire points, ductility test, maximum specific gravity, and bulk specific gravity tests.
2) Principal Tests: Principle tests are conducted to evaluate the effect of bagasse ash on the job mix formula (JMF) of asphalt concrete.
3) Sieve Analysis: The distribution or gradation of aggregate particle sizes in asphalt concrete mixes has a major impact on their overall performance. The aggregates are graded according to NHA Class B in this study. In general, the NHA General Specification, 1998, has its own set of standards for aggregate grading. The aggregate gradation of NHA is divided into two categories: Class A and Class B aggregates. There are some distinctions between the two classifications. Class B aggregates are finer in nature than Class A aggregates. For NHA Class B grading, the nominal maximum aggregate size is 19 mm. Furthermore, Class B was chosen for this study since it is the most often utilized by NHA in KPK, Pakistan. Aggregates in 3 distinct gradations: (Blend Gradation 01, Blend Gradation 02, and Blend Gradation 03) were selected. For this study, three distinct filler contents (4 percent, 5.5 percent, and 6.5 percent) of NHA class B Aggregates have been utilized even within the gradation range.
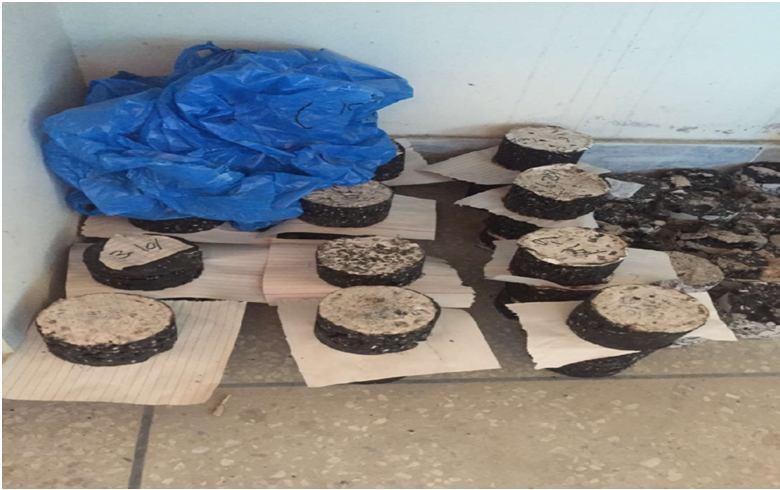
E. Asphalt Sample Preparation and Testing Mix Design Method.
The mix design approach was chosen for the development of asphalt mix samples because it can offer an integrated gradation of aggregates needed to obtain the flow value, stability value, and volumetric properties of mixes for a given binder concentration. The Marshal Mix Design Approach was employed in this study as the mix design method. In this study, asphalt mixtures are created and created in accordance with the National Highway Authority of Pakistan's criteria and regulations, which are in turn compliant with AASHTO and ASTM standards The materials used in this investigation are compliant with the Asphalt Institute's standards (MS 2), AASHTO's, and ASTM's requirements. The Marshal Mix Method is used to make a total of 108 mixes. The Asphalt Institute Mix Designs Method is used to establish the OBC (Optimum Binder Content) for various samples (MS 2).
These asphalt concrete mixes were made according to the gradient that was chosen. Samples were prepared with 3 dissimilar bitumen concentrations (4 percent (a), 4.3 percent (b), and 4.6 percent (c) and 3 dissimilar filler additives (4, 4.5, and 6.5 percent). Furthermore, BA partially replaces (10% and 20%) and completely replaces (100%) of the traditional filler material, stone dust (SD). For each filler content, 12 asphalt mix samples are created. Samples from Blended Gradation 1 were labeled 4(a), 4(b), and 4(c); samples from Blended Gradation 2 were labeled 5.5(a), 5.5(b), and 5.5(c); and samples from Blended Gradation 3 were labeled 6.5(a), 6.5(b), and 6.5(c). Figures 3, 4, and 5 reveal the entire specifics of the mix gradation, designations, BA replacement, and sample count.
ISSN: 2321 9653; IC Value: 45.98; SJ Impact Factor: 7.538 Volume 10 Issue XI Nov 2022 Available at www.ijraset.com
The purpose of the testing performance is to assess the asphalt concrete's on the ground performance. For each sample, the optimal binder content (OBC) is established. There are three different filler contents in conventional samples: 10% modified BA, 20% modified BA, and 100% modified BA (4 percent, 5.5 percent, and 6.5 percent). As a result, three OBC samples are created. For each of the samples described above. For example, three OBC samples are for standard, three samples of OBC are for 10% modified BA, three samples of OBC are for 20% modified BA, and three samples of OBC are for 100% modified BA. The performance characteristics of samples manufactured with Optimum Binder Content (OBC) are examined. A total of 12 samples were tested for OBC, including control and BA modified samples. On the basis of OBC, 12 samples were created. OBC created 12 samples to be tested with a wheel tracker and another 12 samples to be evaluated with a Dynamic Modulus test. The tests were carried out at Pakistan's University of Engineering and Technology (UET) in Taxila.
The following are the three primary performance tests that were carried out:
1) Marshal stability test (AASHTO T 245): Marshal stability and flow properties were assessed using asphalt concrete samples. All of the samples were produced, compacted, and tested according to the AASHTO T245 and ASTM D6926, and D6927 procedures. At 105±5 oC. All of the aggregates used in the specimen preparation process were heated and dried beforehand. Each and every sample was produced by the substitution of BA (10 percent, 20 percent, and 100 percent). There were an overall number of 108 samples generated and evaluated in this study. The Marshall Stability and Flow findings are displayed. The highest resistance load attained with a constant rate of deformation is known as Marshall Stability (MS 2 Asphalt Institute 2014). During a stability test, Marshall Flow is an assessment of the specimen's distortion (both plastic and elastic) (MS 2 Asphalt Institute 2014). The Deputy Marshal’s load resistance provided by the test was used to determine the samples' stability. Following conditioning in a water bath at 60 ℃ for 30 minutes at a deformation of 50 mm/min and 5.08 cm/minute, the sample is measured in Kilograms or Newtons. Whenever the load is applied, as, during the Marshall Method, the sample flow is recorded. The flow is calculated by obtaining a measurement from a flow gauge at the point where the load increment can no longer be increased. The Flow result indicates that the sample has vertical deformation of 0.25mm (0.01 inch).
2) Wheel Tracking Test: This test is used to measure an asphalt mixture's rutting susceptibility. It uses Linear Variable Displacement Transformers to move a 6 inch diameter steel wheel over the sample for 10,000 passes, measuring the amount of rutting in the asphalt concrete mix (LVDT). Under standard loads and a temperature of roughly 60 °C, this test was conducted in order for the controlled samples and modified BA samples to determine their rut resistance The 60 °C temperature is used to test the sample's performance in the most adverse conditions. In order to represent the on ground real estate, a specific No. of passes and pressure are delivered to the slab in the roller compactor for consistent compaction throughout.
3) Dynamic Modulus Test: In this test, a total of 12 samples were made according to our optimized binder content. For the assessment of complex modulus, the sample is about 8 inches tall and 6 inches in Radius. The samples were compacted using a 600 kPa gyratory compactor. The resultant asphalt samples were sliced. Then samples were sliced with the help of a cutter to make a sample with a thickness of 6 inches and a diameter of 4 inches The measurement results are shown, and the samples were evaluated in the Asphalt Mixture Performance Tester (AMPT) (NU 14), which is a freestanding assessment program with an enclosed environment linked with a computer. AASHTO TP 62 was used to test the specimens that were produced. With different frequencies of 25, 10, 5, 1, 0.5, and 0.1, the goal axial stress in DMT was preserved at 52 kPa. The temperature was set at 54 °C. The dynamic modulus of a specimen subjected to sinusoidal loadings defines the absolute value of the maximum stress to maximum strain ratio. As shown several gauges mounted to the sample at several points were used to measure the stresses in the generated asphalt samples. The table shows the range of values for the equilibrium duration, stress levels, and No. of cycles used as specified by AASHTO TP 62 specifies the requirements.
ISSN: 2321 9653; IC Value: 45.98; SJ Impact Factor: 7.538 Volume 10 Issue XI Nov 2022 Available at www.ijraset.com
S.No Compactor Type of Gyratory Test Eq. for E* No. of LVDT 01 Servo Pac NU 14 2
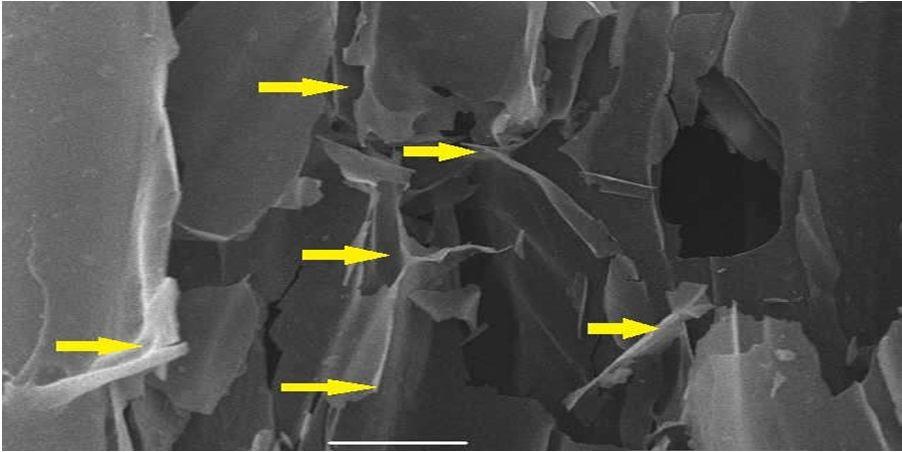
H. Test of BA as a filler. BA is employed as a filler component in this investigation. As a result, it was required to look at some of BA's basic characteristics and chemistry. Different tests, including scanning electron microscopy (SEM), are done on BA in the University of Peshawar's Centralized Resource Laboratory (CRL) in order to analyze the chemical composition, morphology, and surface texture, among other things. These exams will be addressed further down.
1) Scanning Electron Microscopy (SEM): SEM (Scanning Electron Microscopy) is a vital and effective test for analyzing the deep inner surface of a material. It’s a multifunctional imaging tool that's widely utilized for morphological and surface assessments of materials. It is made up of an electron beam that is focused on a substance and thereby creates a picture of the substance. Therefore, in an experiment, electrons interact with the atoms in the specimen, creating signals that describe the material's surface topography and composition. Figure 6 shows an SEM, which is a sort of nondestructive testing technology that provides information about a sample's particle distribution, size, structure, and arrangement. Furthermore, it provides information on the material's micro and nan scale fissures. Table 3 shows the specifications of the SEM equipment at the University of Peshawar's Centralized Resource Laboratory.
Details of the Scanning Electron Microscope apparatus are listed in Table 3. S.No Specifications Details 01 Model JSM 5910
JAPAN
The summary and test results conducted on aggregates are as follows.
Absorption of Aggregates Test
ISSN: 2321 9653; IC Value: 45.98; SJ Impact Factor: 7.538 Volume 10 Issue XI Nov 2022 Available at www.ijraset.com
Reference Specification Results (%) Recommended Range
AASHTO T85 0.83 Less than 2%
LA Abrasion Test ASTM C131 AASHTO T96 24.3 Less than 40%
Elongated Test
ASTM D4791 5.344 Less than 15%
Flakiness Test ASTM D4791 5.53 Less than 15%
Plasticity Index
The sieve analysis showed that the percentage passing of aggregates from the concerned sieve is within the limits set by AASHTO T 164. The graph between percent passing and sieve sizes is shown in Fig.3 to Fig.5. The lower limit and upper limit specified by AASHTO for each size of the sieve are also shown by the curve. It is clearly visible from the graph that the actual passing of each sieve occurred between the lower and upper limits specified by AASHTO T 164. Thus, the sieve analysis test confirms that the use of bagasse ash as a filler will not disturb the job mix formula.
BLEND GRADATION- 1
64.1 76.4
50.6
AASHTO T 89/90 Bagasse Ash Less than 4% 0 Liquid limit AASHTO T 89/90 Bagasse Ash 0 4.8 12.2
100 100 0 10 20 30 40 50 60 70 80 90 100 110 PERCENTAGE PASSING SIEVE SIZE (MM)
28.6
Figure 3 Blend Gradation 1
PERCENTAGE PASSING
ISSN: 2321 9653; IC Value: 45.98; SJ Impact Factor: 7.538 Volume 10 Issue XI Nov 2022 Available at www.ijraset.com
6 12.9
50.3
76.4
64.1
100 100 0 10 20 30 40 50 60 70 80 90 100 110
27.6
PERCENTAGE PASSING
GRADATION-2 7.3 14.2
SIEVE SIZE (MM)
Figure 4 Blend Gradation 2
28.6
64.1
76.4
50.6
100 100 0 10 20 30 40 50 60 70 80 90 100 110
SIEVE SIZE (MM)
Figure 5 Blend Gradtion 3
SEM is a particularly effective method for examining a material's surface texture by generating magnified images. The magnified images help us characterize its morphology and grain size distribution. It generally indicates how rough or smooth the surface of the test sample is. The SEM images at different magnifications shown in Fig. 6 illustrate that bagasse ash has a comparatively very rough surface. The rough surface of bagasse ash will help increase the friction of the asphalt and the viscosity of the bitumen. Therefore, it will produce very compacted and hard asphalt with good results for stability and flexibility.
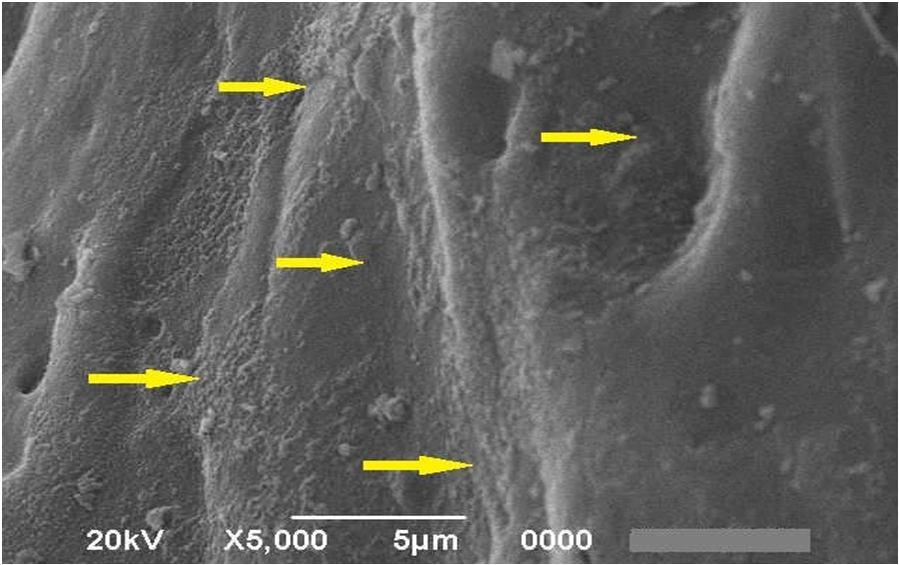
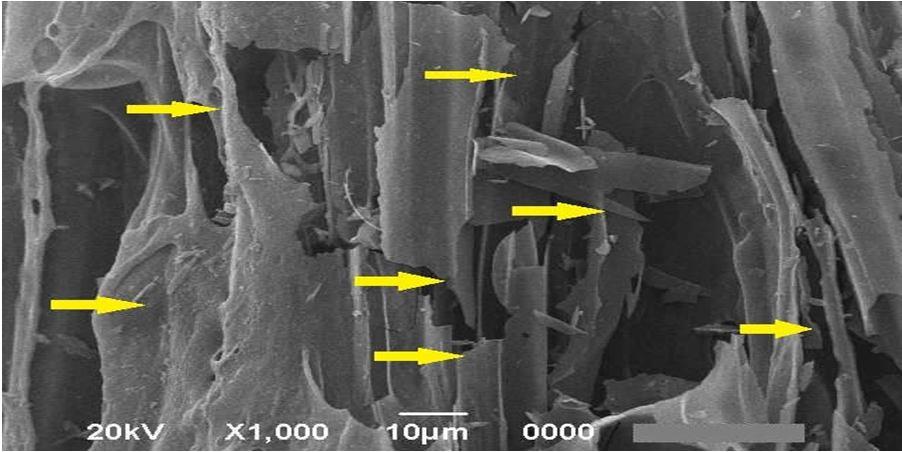
Figure 6: BA SEM Images at Various Magnifications.
ISSN: 2321 9653; IC Value: 45.98; SJ Impact Factor: 7.538 Volume 10 Issue XI Nov 2022 Available at www.ijraset.com
The flow and Marshall stability test is a fairly simple test for asphalt concrete mixtures. As a result, flow and Marshall stability parameters are calculated for both conventional and bagasse ash modified samples. The Marshall Stability and Flow values for standard and modified bagasse ash samples are presented in a graphical chart. Grapher software is used to create all of the graphs. Below are the graph plots.
Flow and Marshall Stability Test Results for 4 percent Bitumen and 4 percent Filler.
Marshall Stability (KN) vs BA(%) 10.56 11.43 12.08
Flow (mm) vs BA(%)
Marshal stability (KN) BA (%)
13.87 14.34 12.23 0 2 4 6 8 10 12 14 16 Traditional 10% BA 20% BA 100% BA
11.32
17.24 0 2 4 6 8 10 12 14 16 18 20 Traditional 10% BA 20% BA 100% BA
Flow(mm) BA (%)
Figure 7: Comparison of Marshall Stability and Flow
Flow and Marshall Stability Test Results for 4 percent Filler and 4.3 percent Bitumen.
Marshall Stability(KN) vs BA(%)
(mm) vs
18.98 0 2 4 6 8 10 12 14 16 18 20 Traditional 10% BA 20% BA 100% BA
11.89 12.54 13.35
Flow(mm) BA(%)
Figure 8: Comparison of Flow and Marshall Stability.
ISSN: 2321 9653; IC Value: 45.98; SJ Impact Factor: 7.538 Volume 10 Issue XI Nov 2022 Available at www.ijraset.com
Marshall Stability and Flow Test Results for 4 percent Filler and 4.6 percent Bitumen.
Figure 9: Comparison of Flow and Marshall Stability Flow and Marshall Stability Test Results for 5.5 percent Filler and 4 percent Bitumen.
ISSN: 2321 9653; IC Value: 45.98; SJ Impact Factor: 7.538 Volume 10 Issue XI Nov 2022 Available at www.ijraset.com
Flow & Marshall Stability Tests for 5.5 percent Filler and 4.3 percent Bitumen.
Figure 11: Marshall Stability and Flow Comparison Stability and Flow Tests for 5.5 percent Filler and 4.6 percent Bitumen by Marshall.
ISSN: 2321 9653; IC Value: 45.98; SJ Impact Factor: 7.538 Volume 10 Issue XI Nov 2022 Available at www.ijraset.com
Results of Flow and Marshall Stability Tests for 6.5 percent Filler and 4 percent Bitumen.
13.54 15.73 16.97 14.89 0 2 4 6 8 10 12 14 16 18 Traditional 10% BA 20% BA 100% BA
Marshal stability(KN) BA(%)
Figure 13: Comparison of Flow and Marshall Stability.
Results of Marshall Stability and Flow Tests with 6.5% Filler and 4.3 percent Bitumen.
Figure 14: Comparison of Flow and Marshall Stability
ISSN: 2321 9653; IC Value: 45.98; SJ Impact Factor: 7.538 Volume 10 Issue XI Nov 2022 Available at www.ijraset.com
Flow and Marshall Stability Test Results for 6.5 percent Filler and 4.6 percent Bitumen.
Flow (mm) vs BA(%)
25
Marshall Stability (KN) vs BA(%) 14.54 14.98 16.45
20
15
10
Marshal stability(KN) BA(%)
5
13.71
26.74 17.74 13.45 0
30 Traditional 10% BA 20% BA 100% BA
20
15
10
Flow(mm) BA(%)
21.76 0
5
25 Traditional 10% BA 20% BA 100% BA
Figure 15: Comparison of Flow and Marshall Stability.
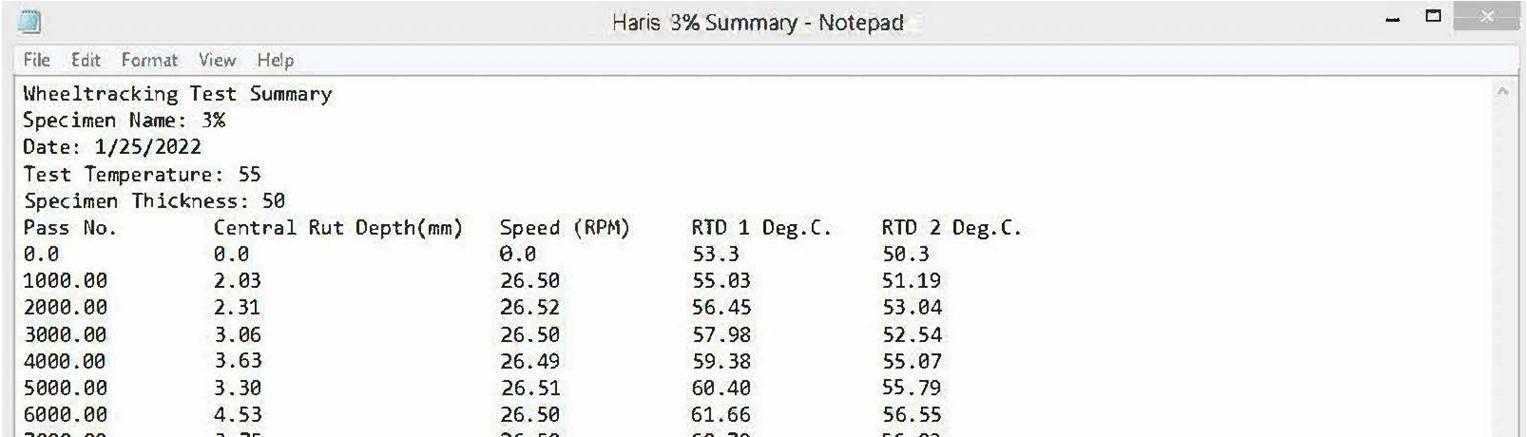
Rutting is a long term distortion in which a groove or depression is created in the asphalt road as a result of automobile wheel movement. The wheel tracking experiment is used to determine the asphalt concrete mixture's ability to resist rutting or to quantify the asphalt mixture's rutting vulnerability. For each filler content, 12 OBC based samples were generated (4 percent, 5.5 percent, and 6.5 percent). Three samples were created for conventional samples, three for 10% bagasse ash modified samples, three for 20% bagasse ash modified samples, and three for 100% BA modified models. Every sample is subjected to the wheel tracking test at an average temperature of 55 ℃. The overall rut depth is assessed after a wheel has made 10,000 passes.
Figure 16: Text File with Assessment of Wheel Tracking Results

ISSN: 2321 9653; IC Value: 45.98; SJ Impact Factor: 7.538 Volume 10 Issue XI Nov 2022 Available at www.ijraset.com
Rut Depth at 5.5 percent Filler Content for Different Mix Types
8
7
6
5
4
3
2
1
0
Rut Depth (mm) BA Filler (%)
Figure 17: Rut Depth of Mix Types Comparison with 5.5% filler content
Rut Depth with 6.5% Filler content for various Mix Types
Rut depth(mm) vs 6.5% BA Filler
8
7
6
5
4
3
Rut depth(mm) vs 5.5% BA Filler 8.33 6.47 5.34 4.33 0
9 Traditional 10% BA 20% BA 100% BA
2
1
Rut Depth (mm) BA Filler (%)
Figure 18: Rut Depth of Mix Types Comparison with 5.5% filler content
ISSN: 2321 9653; IC Value: 45.98; SJ Impact Factor: 7.538 Volume 10 Issue XI Nov 2022 Available at www.ijraset.com
G. Analyze the Dynamic Modulus Test Results
Dynamic Modulus (MPa) Frequency (Hz)
0 100 200 300 400 500 600 700 800 900 25 10 5 1 0.5 0.1
Dynamic modulus vs 4% BA Filler Conventional 10% BA 20% BA 100% BA
Figure 19: Dynamic Modulus Comparison of Conventional and Modified Samples for 4% Filler
Dynamic modulus vs 5.5% BA Filler
700
600
500
400
300
200
100
Dynamic Modulus (MPa) Frequency (HZ)
800 25 10 5 1 0.5 0.1
0
Conventional 10% BA 20% BA 100% BA
Figure 20: 5.5 percent Filler Dynamic Modulus Comparison of Conventional and Modified Samples.
ISSN: 2321 9653; IC Value: 45.98; SJ Impact Factor: 7.538 Volume 10 Issue XI Nov 2022 Available at www.ijraset.com
Dynamic modulus vs 6.5% BA
Filler
Dynamic Modulus (MPa)
0 100 200 300 400 500 600 700 800 900 25 10 5 1 0.5 0.1
Frequency (Hz)
Conventional 10% BA 20% BA 100% BA
Figure 21: Comparison of Conventional and Modified Samples for 6.5% Filler (Dynamic Modulus)
The following are the results of the tests that were conducted:
1) The stability of the asphalt mixtures was improved by using BA up to 20%. However, substituting 100% BA for SD disrupted the stability and resulted in lower asphalt concrete stability.
2) The flow of the asphalt mixture with 10% and 20% BA was well within the specified range, but the flow of the 100% BA modified had crossed the flow limits at various filler contents.
3) Although the percent of air voids at different filler and bitumen contents were also in the specified range, some of them violated the limits.
4) The scanning electron microscopy (SEM) of bagasse ash (BA) shows that it has a very rough surface texture. The rougher surface of BA will aid in better interlocking and friction, as well as increased viscosity.
5) EDX 6) FTIR 7) Dynamic Modulus Test 8) Wheel Tracker Test
The bagasse ash is available in huge amounts around the sugar mills. Because it is the last waste product of the sugar mill industry, this BA has a very low or no cost. If this no cost BA is encouraged to be used as a filler material, the industry will undoubtedly benefit because it has no cost when compared to conventional SD. The use of BA by the industry will ultimately result in the proper disposal of this waste, as it will be used in asphalt roads.
[1] M. Rahman, M. J. I. J. o. I. Sobhan, A. Studies, Use of non conventional fillers on the asphalt concrete mixture. 3, 1101 1109 (2013).
[2] H. S. Do, P. H. J. W. M. Mun, A study on engineering characteristics of asphalt concrete using filler with recycled waste lime. 28, 191 199 (2008).
[3] B. Huang, X. Shu, X. J. I. J. o. P. E. Chen, Effects of mineral fillers on hot mix asphalt laboratory measured properties. 8, 1 9 (2007).
[4] Ş. Sargın et al., Evaluation of rice husk ash as filler in hot mix asphalt concrete. 48, 390 397 (2013).
[5] J. Trzciński et al., Petrographic and Geotechnical Characteristics of Carbonate Aggregates from Poland and Their Correlation with the Design of Road Surface Structures. Materials 14, 2034 (2021).
[6] M. Arabani, S. Babamohammadi, A. Azarhoosh, Experimental investigation of seashells used as filler in hot mix asphalt. International Journal of Pavement Engineering 16, 502 509 (2015)
ISSN: 2321 9653; IC Value: 45.98; SJ Impact Factor: 7.538 Volume 10 Issue XI Nov 2022 Available at www.ijraset.com
[7] N. Rashwan, Hot Mix Asphalt (HMA) performance as affected by limestone powder filler content. World Applied Sciences Journal 34, (2016).
[8] R. Tomar, R. Jain, M. Kostha, Effects of Fillers on Bituminous Paving Mixes. International Journal of Engineering Research, Science and Technology 2, 2319 5991 (2013).
[9] M. Arabani, S. A. Tahami, M. Taghipoor, Laboratory investigation of hot mix asphalt containing waste materials. Road Materials and Pavement Design 18, 713 729 (2017).
[10] D. D. Huwae, L. Parera, J. Tanijaya, Bagasse ash as filler in HRS (hot rolled sheet) mixture. Advances in civil, Environmental, and Materials Research, (2016).
[11] R. Mistry, T. K. Roy, Effect of using fly ash as alternative filler in hot mix asphalt. Perspectives in Science 8, 307 309 (2016).
[12] N. AH AL Saffar, The effect of filler type and content on hot asphalt concrete mixtures properties. Al Rafidain Engineering Journal (AREJ) 21, 88 100 (2013).
[13] N. Morova, S. Terzi, Laboratory investigation of usability of slate waste powder as filler in hot mix Asphalt concrete. Uluslararası Teknolojik Bilimler Dergisi 8, 1 18 (2016).
[14] A. Zulkati, W. Y. Diew, D. S. Delai, Effects of fillers on properties of asphalt concrete mixture. Journal of transportation engineering 138, 902 910 (2012).
[15] H. Y. Ahmed, A. M. Othman, A. A. Mahmoud, Effect of using waste cement dust as a mineral filler on the mechanical properties of hot mix asphalt. Ass. Univ. Bull. Environ. Res 9, 51 59 (2006).
[16] I. Hafeez, M. A. Kamal, Effects of mineral filler to polymer modified bitumen ratio on the design properties of hot mix asphalt and its performance. Mehran University Research Journal of Engineering & Technology 29, 581 588 (2010).
[17] R. Muniandy, E. Aburkaba, L. Mahdi, Effect of mineral filler type and particle size on asphalt filler mastic and stone mastic asphalt laboratory measured properties. Australian Journal of Basic and Applied Sciences 7, 475 787 (2013).
[18] A. Modarres, M. J. C. Rahmanzadeh, B. Materials, Application of coal waste powder as filler in hot mix asphalt. 66, 476 483 (2014).
[19] J. Wilanowicz, W. Grabowski, M. Andrzejczak, A. J. P. E. Chromiec, Assessment of the suitability of baghouse dusts from a dust extractor as fillers for hot mix asphalt. 57, 1269 1277 (2013).
[20] A. Modarres, M. Rahmanzadeh, Application of coal waste powder as filler in hot mix asphalt. Construction and Building Materials 66, 476 483 (2014).
[21] M. Rahman, M. Sobhan, Use of non conventional fillers on asphalt concrete mixture. International Journal of Innovation and Applied Studies 3, 1101 1109 (2013).
[22] K. Z. Ramadan, A. M. Ashteyat, Utilization of white cement bypass dust as filler in asphalt concrete mixtures. Canadian Journal of Civil Engineering 36, 191 195 (2009).
[23] H. H. Jony, M. Al Rubaie, I. Jahad, The effect of using glass powder filler on hot asphalt concrete mixtures properties. Engineering and Technology Journal 29, 44 57 (2011).
[24] M. M. Rafi, A. Qadir, S. H. Siddiqui, Experimental testing of hot mix asphalt mixture made of recycled aggregates. Waste Management & Research 29, 1316 1326 (2011).
(2 17)
(18 23)
AASHTO Guide for Design of Pavement Structures, 1993 (24)
1) Pavement Cracking Investigation Report of Nowshera Peshawar, Resurfacing & Strengthening Contract #14 (NHIP), SMEC International PTY LTD JV, May2006.
2) General Specifications NHA1998
3) AASHTO 2004 Determining the Soundness of Aggregates by Sodium Sulphate or Magnesium Sulphate, AASHTO DesignationT104.
4) AASHTO 2004 Plastic Fines in Graded Aggregate and Soils by Use of the Sand Equivalent Test, AASHTO DesignationT176.
5) AASHTO 2002 Standard Test Method for Density of Semi Solid Bituminous Materials, AASHTO DesignationT228
6) AASHTO 2000 Softening Point of Bitumen (Ring and Ball Apparatus), AASHTO DesignationT53.
7) ASTM 2004 Standard Test Method for Penetration of Bituminous Materials. ASTM DesignationD5.
8) ASTM 2004 Test Method for Theoretical Maximum Specific Gravity and Density of Bituminous Paving Mixtures. ASTM DesignationD2041.
9) ASTM 2004 Test Method for determining the Percentage of Plastic Fines in Graded Aggregate and Soils by Use of the Sand Equivalent Test. ASTM DesignationD2419.ASTM 2004 Flat or Elongated Particles in Coarse Aggregates, ASTM Designation D4791.
10) Test Method for Indirect Tension Test for Resilient Modulus of Bituminous Mixtures. ASTM DesignationD4123
11) ASTM 2004 Standard Test Method for Soundness of Aggregates by Use of Sodium Sulfate or Magnesium Sulfate. ASTM DesignationC88.
12) ASTM 2004 Standard Test Method for Resistance to Degradation of Small Size Coarse Aggregate by Abrasion and Impact in the Los Angeles Machine. ASTM Designation C131
13) Asphalt Institute, 2003. “Mix Design Method for Asphalt Concrete and other Hot Mix Types,” Manual series No. 02, Six Edition, Kentucky, USA.
14) Asphalt Institute, 2003. “Asphalt Hand Book,” Manual series No. 04, Six Edition, Kentucky, USA.
15) National Highway Authority, NHA, 1998, “General Specifications”, Surface Courses, Item No. 305, Pakistan
16) National Cooperative Highway Research Program; 2005. “Aggregate properties and the performance of super pave Designed Hot Mix Asphalt”, NCHRP Report No.539.
17) ASTM D 1559, Resistance to Plastic Flow of Bituminous Mixtures Using the Marshall Apparatus
18) AASHTO T 283, Resistance of Compacted Bituminous Mixtures to Moisture Induced Damage.
19) VDOT Road & Bridge Specification Book Section 211 Asphalt Concrete, Section
20) 211.03 Table II 13 (Figure 5 1, page 5 4) for the design gradations for various types of mixes).
21) “A Guide to the Design of Hot Mix Asphalt in Tropical and Sub Tropical Countries Overseas Road Note 19”. Transport Research Laboratory (TRL) and Department for International Development (DFID), Crowthorne, UK, September,2002.
22) ASTM D 4123 Standard Test Method for Indirect Tension Test for Resilient Modulus of Bituminous Mixtures.
23) ASTM D 7369 09 Standard Test Method for determining the Resilient Modulus of Bituminous Mixtures by Indirect Tension Test.