
10 X October 2022 https://doi.org/10.22214/ijraset.2022.47169
ISSN: 2321 9653; IC Value: 45.98; SJ Impact Factor: 7.538

Volume 10 Issue X Oct 2022 Available at www.ijraset.com

ISSN: 2321 9653; IC Value: 45.98; SJ Impact Factor: 7.538
Volume 10 Issue X Oct 2022 Available at www.ijraset.com

Abstract: The use of recycled waste materials in road pavements is currently seen as a viable solution not just in terms of environmental sustainability, but also in terms of improving service performance.[1] This is particularly true when it comes to recycled plastics. Thin plastic bags are primarily composed of low density Polyethylene and it’ s commonly used for packaging, protecting and many other applications. Nevertheless, disposal of waste plastic bags in large quantities constitutes an environmental problem, as they considered non-biodegradable materials. Hence, there is a real need to find useful applications for these growing quantities of wastes. In this research, Waste Plastic Bags (WPB) as one form of polymers are used to investigate the potential prospects to enhance asphalt mixture properties. Research aims include studying the effect of partial replacing of different percentages of WPB pieces of the bitumen as binder modifiers on the properties of asphalt mix comparing it with conventional mix properties, besides identifying the optimum percent of WPB to be added in the hot mix asphalt. WPB were presented in the asphalt mixture in pieces with size (2 x 5 mm2). Marshal mix design procedure was used, first to determine the Optimum Bitumen Content (OBC) and then further to test the modified mixture properties. In total, (39) samples were prepared, 15 samples were used to determine the OBC and the remaining were used to investigate the effects adding different WPB percentages to asphalt mix. The OBC was 5.6 % by weight of asphalt mix. Seven proportions of WPB by weight of OBC were tested (2, 4, 8, 12, 16, 20 and 24%), besides testing of ordinary asphalt mix. Tests include the determination of stability, bulk density, flow and air voids. Results indicated that WPB can be suitably used as a modifier for asphalt mixes as a part of sustainable management of plastic waste as well as for improved performance of asphalt mix. WPB content of 5.0 % by weight of OBC is recommended as the optimum WPB content for the improvement of performance of asphalt mix. Asphalt mix modified with 5.0 % WPB by OBC weight has higher stability value compared to the conventional asphalt mix. Asphalt mix modified with higher percentages of WPB exhibit lower bulk density, higher flow and higher air voids.
Keywords: Highway, Asphalt, Bitumen, Plastic and Recycle.
A noticeable increase in waste generation rates for various types of waste materials has been noticed as a result of rapid industrial growth in numerous fields combined with population growth. Disposal of such huge amounts of waste, particularly non decaying waste materials, has become a major challenge in both industrialized and developing countries. One of the most sustainable solutions for this problem is to recycle waste into valuable items. As a result, substantial research into new and innovative uses of waste materials is encouraged. Using recycled materials in road pavements is nowadays considered not only as a positive option in terms of sustainability, but also, as an attractive option in means of providing enhanced performance in service.[2] The addition of a specific polymer to asphalt binder has been shown to increase the performance of road pavement. When polymers are used, rutting and heat cracking resistance is usually improved. Additionally, it reduced fatigue damage, stripping, and improved temperature susceptibility. Polyethylene is extensively used plastic material, and it has been found to be one of the most effective polymer additives.[3, 4] Thin plastic bags are mainly composed of Low Density Polyethylene (LDPE) and it’s widely used for packaging.[5] However, disposal of waste plastic bags (WPB) in large quantities has been a problem as it’s not a biodegradable material.[6] Several studies have been made on the possible use of waste plastic bags and plastics in general in asphalt mix.[7] Depending upon their chemical composition and physical state, they have been employed as binder modifiers or as aggregates coat as well as they can be used as elements which partially substitute portion of aggregates in asphalt mix. Results were encouraging and exhibit an improvement in performance of the modified asphalt mixes.[2, 8]
ISSN: 2321 9653; IC Value: 45.98; SJ Impact Factor: 7.538 Volume 10 Issue X Oct 2022 Available at www.ijraset.com
Studies are constantly searching on different methods to improve the performance of asphalt pavements. This study was conducted to investigate the possible use of waste plastic bags (WPB) as a modifier of hot mix asphalt and to review the feasibility of incorporating WPB to improve the performance of asphalt mix.
Asphalt binder 60/70 was used in this research. In order to evaluate bitumen properties number of laboratory tests have been performed such as: specific gravity, flash point, fire point, softening point and penetration. Table (1) shown the summary of bitumen properties.
Table (1): Summary of bitumen properties
Test Specification
Penetration (0.01 mm)
Results ASTM specifications limits
ASTM D5 63.5 (60/70 binder grade)
Softening point (C°) ASTM D36 50.67 (45 52)
Flash point (C°) ASTM D92 280 Min 230 C°
Fire point (C°) ASTM D92 310
Specific gravity ASTM D70 1.03 1.01 1.06
WPB was used in this research. In order to evaluate WPB properties number of laboratory tests have been performed such as: specific gravity and melting point. Results shown in table (2).
Table (2): Waste plastics properties
Property Detail
Plastic type
Waste thin plastic packaging bags
Plastic material Low density Polyethylene (LDPE)
Size (mm2) (2.00 x 5.00 mm2)
Density (g/cm3) 0.92
Melting point (C°) 125
The properties of aggregates used in asphalt mix was shown in Table (3)
Table (3): Results of aggregates tests
Test Size 1.5 cm Size 1.0 cm Size 0.6 cm
Bulk dry S.G 2.56 2.54
Bulk SSD S.G 2.61 2.59
Apparent S.G 2.71 2.69 2.64
Absorption (%) 2.28 2.21
Designation No. Specification limits
ASTM C127
ASTM C128 < 5
Abrasion value (%) 24.2 ASTM C131 < 40
ISSN: 2321 9653; IC Value: 45.98; SJ Impact Factor: 7.538 Volume 10 Issue X Oct 2022 Available at www.ijraset.com
Asphalt mix requires the combining of two or more aggregates, having different gradations, to produce an aggregate blend that meets gradation specifications for a particular asphalt mix. Available aggregate materials (19), (9.5), (4.75), (2.36), (0.3), (0.075) and sand are integrated in order to get the proper gradation within the allowable limits according to ASTM specifications using mathematical trial method. This method depends on suggesting different trial proportions for aggregate materials from whole gradation. The percentage of each size of aggregates is to be computed and compared to specification limits. If the calculated gradation is within the allowable limits, no further adjustments need to be made; if not, an adjustment in the proportions must be made and the calculations repeated. The trials are continued until the percentage of each size of aggregate are within allowable limits. The percentage of aggregate type A was 60%, the percentage of aggregate type B was 20% and the percentage of aggregate type C was 20% as shown in table (4) and figure (1).
Table (4): Aggregates sieveanalysis results
Sieve size A B C Min. Max. Mid. Result
19 100 100 97.83 90 100 95 99.566 9.5 98.6 55.2 0.68 56 80 68 70.336
4.75 92.4 0.8 0.17 35 65 50 55.634 2.36 65.55 0.22 0.16 23 49 36 39.406 0.3 18.4 0.2 0.15 5 19 12 11.11 0.075 6.8 0.16 0.11 2 8 5 4.134 Pan 0.0 0.0 0.0 0.0 0.0 0.0 0.0
Figure (1): Gradation of final aggregates mix with ASTM specification range
Gradation of final aggregate mix
Passing (%)
0 10 20 30 40 50 60 70 80 90 100
0.01 0.1 1 10 100
Sieve size (mm)
Final mix min max
A number of 15 samples each of 1200 gm in weight were prepared using five different bitumen contents (from 4.5 6.5% with 0.5 % incr mental) in order to obtain the optimum bitumen content (OBC). Table (5) and Figures (2 6) show summary of Marshal Test results.
ISSN: 2321 9653; IC Value: 45.98; SJ Impact Factor: 7.538 Volume 10 Issue X Oct 2022 Available at www.ijraset.com
Table (5): Marshal Test Results
Bitumen content% Stability Corr. stability Flow (mm)
Bulk density (gm/cm3) Gsb Gmm Pa(%) VMA(%)
4.5 1331 1295.67 2.4 2.34 2.64 2.47 5.06 15.29 5 1457.7 1403.95 3.0 2.34 2.64 2.45 4.26 15.64
5.5 1601.3 1548.52 3.2 2.36 2.64 2.43 3.03 15.62 6 1516 1485.68 5.1 2.36 2.64 2.41 2.19 15.94 6.5 1295 1269.10 7.0 2.35 2.64 2.40 1.91 16.74
Stability is the highest load required to produce failure of the specimen when load is applied at constant rate 50mm/min [9]. In Figure (2) stability results for different bitumen contents are represented. Stability of asphalt mix increases as the bitumen content increase till itreaches the peak at bitumen content 5.6% then itstarted to decline gradually at higher bitumen content.
1500
1400
Stability (kg) Bitumen (%)
1300
1200
F. Flow vs. Bitumen content relationship
1600 3.5 4.5 5.5 6.5 7.5
Figure (2): Stability vs. bitumen content
Flow is the total amount of deformation which occurs at maximum load [9]. In Figure (3) Flow results for different bitumen contents are represented. Flow of asphalt mix increases as the bitumen content increase till it reaches the peak at the max bitumen content 6.5 %.
Flow vs.Bitumen %
Flo w (mm) Bitumen (%)
% Stability Vs. Bitumen 0 2 4 6 8 10 3.5 4.5 5.5 6.5 7.5
Figure (3): Flow vs. bitumen content
ISSN: 2321 9653; IC Value: 45.98; SJ Impact Factor: 7.538 Volume 10 Issue X Oct 2022 Available at www.ijraset.com
In Figure (4) Bulk density results for different bitumen contents are represented. Bulk density of asphalt mix increase as the bitumen content increase till it reaches the peak (2.36 g/cm3) at bitumen content 6.0% then it started to decline gradually at higher bitumen content.

ρ a (g/cm 3 )
2.32 2.325 2.33 2.335 2.34 2.345 2.35 2.355 2.36 2.365 3.5 4.5 5.5 6.5 7.5
Bitumen (%)
Figure (4): Bulk density vs. bitumen content
H. Pa % vs. Bitumen Content Relationship Pa % is the percentage of air voids by volume in specimen or compacted asphalt mix. In Figure (5) Pa% results for different bitumen contents are represented. Maximum Pa content value is at the lowest bitumen percentage (4.5%), Pa% decrease gradually as bitumen content increase due to the increase of voids percentage filled with bitumen in the asphalt mix. Moreover, the best percentage of Pa in compacted asphalt mix should be between 3 and 5%, the selected value has been taken at 4% which is 5.1% bitumen content.
% Pa Vs. Bitumen
Pa (%)
0 1 2 3 4 5 6 3.5 4.5 5.5 6.5 7.5
Bitumen (%)
Figure (5): Mix air voids proportion vs. bitumen content
ISSN: 2321 9653; IC Value: 45.98; SJ Impact Factor: 7.538 Volume 10 Issue X Oct 2022 Available at www.ijraset.com
Voids in Mineral Aggregates (VMA) is the sum of the percentage of voids filled with bitumen and percentage of air voids remaining in asphalt mix after compaction [9]. In Figure (6) VMA% results for different bitumen contents are represented. Max VMA content are at the highest bitumen percentage (6.5%), VMA% increase gradually as bitumen content increase.
VMA % Vs. Bitumen
18
16
20 3.5 4.5 5.5 6.5 7.5
VMA(%) Bitumen (%)
14
Figure (6): Voids of mineral aggregates proportion vs. bitumen content
To calculate OBC next equation were used: Optimum bitumen content (OBC) % = (%) (%) (%) (OBC) % = = 5.6% The properties of the paving mixture containing the optimization asphalt content now can be determined from the results (2 6) and compared with the suggested criteria given in ASTM specification as shown in table (6).
Table (6): Properties of the asphalt mix using optimum bitumen content (5.6%)
Property value
ASTM specifications Min. Max. Stability (kg) 1550 817 * Flow (mm) 3.4 2 3.5 VMA % 15.7 13 * Pa % 3% 3 5 Bulk density 2.357 2.3 *
J. Effect of Adding WPB on the Mechanical Properties OF Asphalt Mix

1) Conventional Asphalt Mix
The mechanical properties of asphalt mix prepared with OBC (5.6 %) without addition of WPB is shown in Table (7).
Table (7): Mechanical properties of asphalt mix without addition of WPB
Sample No. Bitumen% Corr. Stability (Kg) Flow (mm) Ρa (g/cm3) pa (%) VMA (%) 1 5.6 1406.50 3.30 2.33 3.62 16.31 2 5.6 1530.76 3.20 2.36 3.62 16.31 3 5.6 1459.22 3.20 2.34 3.62 16.31 Average 5.6 1465.49 3.23 2.34 3.62 16.31
ISSN: 2321 9653; IC Value: 45.98; SJ Impact Factor: 7.538 Volume 10 Issue X Oct 2022 Available at www.ijraset.com
According to procedure previously illustrated, 24 samples were prepared at OBC to evaluate the effect of adding WPB to asphalt mixture samples by considering seven proportions of WPB (0, 2, 4, 8, 12, 16, 20 and 24% by the weight of OBC). Table (8) shows the mechanical properties of asphalt mix using different percentages of WPB (By weight of OBC).
WPB content % Stability Corr. stability Flow Bulk density Gsb Gmm Pa% VMA%
0% 1500.333 1465.49 3.23 2.3406 2.64 2.4284 3.6188 16.31
2% 1547 1469.40 3.27 2.3345 2.64 2.4284 3.8689 16.45
4% 1547.667 1478.14 3.33 2.3268 2.64 2.4284 4.1855 16.45
8% 1570.333 1470.96 3.33 2.2872 2.64 2.4284 5.8175 16.41
12% 1553 1413.23 3.47 2.2847 2.64 2.4284 5.9177 18.22
16% 1535.667 1324.43 3.50 2.2786 2.64 2.4284 6.1692 18.30
20% 1433.333 1304.33 3.50 2.2718 2.64 2.4284 6.4484 18.76
24% 1428.333 1306.88 3.50 2.2721 2.64 2.4284 6.4391 18.76
Generally, the stability of modified asphalt mixes is higher than the conventional asphalt mix (1465.49 kg). All the values of stability for different modifier percentages are higher than stability of conventional mix till the percentage of WPB exceeds 12%. The max stability value is found nearly (1480 kg) at WPB content around (5%). Figure (7) shows that the stability of modified asphalt mix increases as the WPB content increases till it reaches the peak at (5%) WPB content then it started to decline steeply at higher WPB content. The improvement of stability in WPB modified asphalt mixes can be explained as a result of the better adhesion developed between bitumen and WPB, these intermolecular attractions enhanced strength of asphalt mix, which in turn help to enhance durability and stability of the asphalt mix [10].
Stability (kg)
800 1000 1200 1400 1600 0% 4% 8% 12% 16% 20% 24% 28%
WPB % (BY Weight of OBC)
Figure (7): Asphalt mix Stability WPB content relationship
ISSN: 2321 9653; IC Value: 45.98; SJ Impact Factor: 7.538 Volume 10 Issue X Oct 2022 Available at www.ijraset.com
Generally, the flow of modified asphalt mix is approximately equal to the convention al asphalt mix (3.5 mm). Figure (8) shows that the flow increases continuously as the WPB modifier content increase. The flow value extends from (3.2mm) till it reach (3.5mm) at WPB content (24%).
Flow (mm)
2.5 2.7 2.9 3.1 3.3 3.5 3.7 0% 4% 8% 12% 16% 20% 24%
WPB % (By Weight of OBC)
Figure (8): Asphalt mix flow WPB content relationship
The bulk density of WPB modified asphalt mix is lower than the conventional asphalt mix (2.34g/cm3). The general trend shows that the bulk density decreases as the WPB content increase. The maximum bulk density is (2.334g/cm3) at WPB content (2%) and the minimum bulk density is (2.27g/cm3) at WPB (24%). This decrease of bulk density can be explained to be as a result of the low density of added plastic material. Figure(9) shows asphalt mix bulk density vs. WPB content relationship.
ρ a (g/cm 3 )
% Flow Vs . WPB 2.26 2.27 2.28 2.29 2.3 2.31 2.32 2.33 2.34 2.35 -2% 2% 6% 10% 14% 18% 22% 26%
% Bulk Density Vs . WPB
WPB % (By weight of OBC)
Figure (9): Asphalt mix bulk density WPB content relationship
ISSN: 2321 9653; IC Value: 45.98; SJ Impact Factor: 7.538 Volume 10 Issue X Oct 2022 Available at www.ijraset.com
In general, the air voids proportion of modified asphalt mixes is higher than conventional asphalt mix (3 %). pa % of modified asphalt mixes increases gradually as the WPB content increase till it reaches the highest pa% value at 24% WPB. Figure (10) show the curve which represents asphalt mix air voids WPB content relationship.

% Pa Vs . WPB
2 4 6 8 -2% 2% 6% 10% 14% 18% 22% 26%
Pa (%) WPB % (By Weight of OBC)
0
Figure (10): Asphalt mix air voids WPB content relationship
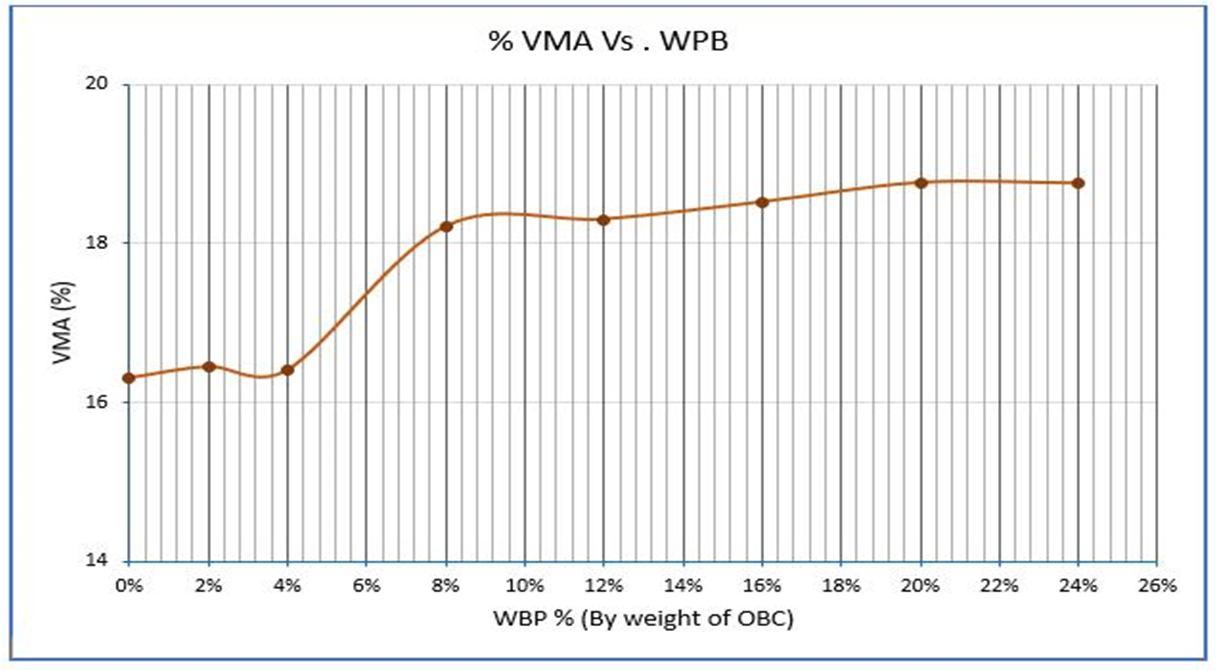
The voids in mineral aggregates percentage VMA% for asphalt mix are affected by air voids in asphalt mix Pa and voids filled with bitumen. VMA% of modified asphalt mixes is generally higher than conventional asphalt mix (16.3 %). VMA % of modified asphalt mixes increases as the WPB content increase, it reaches (18.7%) at WPB content (24%). Figure (11) show the curve which represents asphalt mixture VMA% WPB content relationship.
Figure (11): Asphalt mix voids of mineral aggregates (VMA) WPB content relationship
A set of controls is recommended in order to obtain the optimum modifier content that produce an asphalt mix with the best mechanical properties [9]. Asphalt mix with optimum modifier content satisfies the maximum stability, Shown as Table (9), Asphalt Properties At OBC.
Table (9) asphalt properties at OBC
Property WPB (By OBC Weight)
Maximum stability 1480 Maximum bulk density 2.33 Pa % within the allowed range of specifications 4.5
ISSN: 2321 9653; IC Value: 45.98; SJ Impact Factor: 7.538 Volume 10 Issue X Oct 2022 Available at www.ijraset.com
A comparison of the mechanical properties of WPB modified asphalt mix at the optimum WPB content (5% by OBC) and properties of the conventional asphalt mix is shown in Table (10)
Table (10): Comparison of WPB modified asphalt mix and conventional mix properties property Conventional asphalt mix WPB modified asphalt mix (by OBC Weight) Change amount ASTM specification Min Max
OBC (%) 5.6 5.6 * *
WPB content 0 5 * * Stability 1465.19 1480 +1.01% 817 * Flow (mm) 3.23 3.33 +3.09% 2 3.5 VMA % 16.3 16.7 +4.37% 13 * Air voids (pa)% 3.62 4.5 +24.31% 3 5 Bulk density (gm/cm3) 2.34 2.33 +0.43% * *
It's clearly shown that asphalt mix modified with (5 % WPB by OBC weight) have higher stability compared to the conventional asphalt mix, other properties of modified mix are still within the allowed range of the specifications. Slight increase of flow and air voids in modified asphalt mix is exhibited while VMA% and bulk density are approximatelythe same for the two asphalt mixes. Melted WPB provide a rougher surface texture for aggregate particles in modified asphalt mix that would enhance asphalt mix engineering properties due to improved adhesion between bitumen WPB and aggregates. Improved stability would positively influence the fatigue and rutting resistance of the modified asphalt mix leading to more durable asphalt pavement [3, 10] Nondestructive tools such as Portable Seismic Property Analyzer can be used to determine the integrity of the modified asphalt [11, 12, 13]
It is seen from table (11) that all properties of bitumen and properties of bitumen when mixes with 5% WPB stability with ASTM specification 5% WPB mode some changes on penetration and softening point values, it’s also seen that the flash and fire were increasing with load to improve the bitumen reaction with fire.
Table (11): Summary of bitumen vs. bitumen with WPB properties
Test
Penetration (0.01 mm)
Specification Bitumen Bitumen + WPB (5%) ASTM specifications limits
ASTM D5 63.5 70 (60/70 binder grade)
Softening point (C) ASTMD36 50.67 47.5 (45 52)
Flash point (C)
ASTM D92 280 315 Min 230 C
Fire point (C) ASTM D92 310 340
Specific gravity ASTMD D70 1.03 1.02 (1.01 1.06)
As shown in Table (11) , the. Penetrabiltiy of the modified bitumen increased with the addition of recycled plastic waste, from 63.5 for the pure bitumen to 70 for Modified bitumen. these results show effect of recycled plastic waste bring to the hardness of pure bitumen. The hardness of the Modified Bitumen was decreased Comparing with pure bitumen, but still in the acceptable range and can be suitably used in the same climatic Conditions.
ISSN: 2321 9653; IC Value: 45.98; SJ Impact Factor: 7.538
Volume 10 Issue X Oct 2022 Available at www.ijraset.com
The results in table (11), Shows that the softening point decreased slightly with addition of the recycled plastic waste ranging between 50.67 for pure bitumen to 47.5 for Modified bitumen. These results Can be interpreted positively especially in enhancing the Performance characteristic of the Modified bitumed in term of rutting.
U. Effect of WPB on Flash and fire point
Flash and Fire points of pure bitumen (60 70) is generally observed As 280 and 310 C° respectively. From the present investigation, it has been observed that both flash point and Fire point of the Modified bitumen increased. These changes will help the Modified bitumen to resist the increasing in temperture and affect of fire better than the pure bitumen.
It was observed the specific gravity of Modified bitumen (1.02) decreased comparing with pure bitumen (1.03) that change will lead to make the Modified bitumen has Less weight, but the specific gravity for both bitumens still in the suitable range (1.01 1.06).
The following conclusions can be derived based on experimental work findings for WPB modified asphalt mixtures compared to regular asphalt mixtures:
1) WPB can be suitably used as a modifier for asphalt mixes for sustainable management of plastic waste in addition for improved performance of asphalt mix.
2) The optimum amount of WPB to be added as a modifier of asphalt mix was found to be (5.0%) by weight of OBC of the asphalt mix.
3) Asphalt mix modified with (5.0% WPB by OBC weight) has higher stability value compared to the conventional asphalt mix.
4) Asphalt mix modified with WPB exhibit lower bulk density as the WPB percentage increased. This decrease in bulk density can explained to be as a result of the low density of added plastic material.
5) Asphalt mix modified with WPB exhibit higher flow value as the WPB percentage increased. However, the stiffness of the modified mix is increased.
[1] F. Alatshan, A.A. and Mashiri, F. (2017) Effect of date palm fibers on the mechanical properties of concrete. INTERNATIONAL JOURNAL OF SUSTAINABLE Building Technology and Urban Development 8 (2), 68 80.
[2] Justo, C.V., A (2002) Utilization of waste plastic bags in bituminous mix for improved performance of roads. Centre for Transportation Engineering, Bangalore University, India. 1 (2), 25 58.
[3] Awwad, M.S., L (2007) The use of Polyethylene in hot asphalt mixtures. American Journal of Applied Sciences 4 (6), 390 396.
[4] Kalantar, Z.N., Mahrez, A & Karim, M (2010) Properties of bituminous binder modified with waste Polyethylene Terephthalate. MUTRFC 2010: proceedings of Malaysian Universities Transportation Research Forum & Conferences, University Tenaga Nasional, Malaysia. 2 (3), 23 58.
[5] Abdelmajeed Altlomate , A.F.M.F., JadanMohamed (2016) Experimental study of light transmitting concrete. International Journal of Sustainable Building Technology and Urban Development, 1 7.
[6] Hamad, S., Ammar, W., Shaniba, S. and Altlomate, A. (2022). Condition Assessment of August A. Busch Bridge Deck Using Portable Seismic Property Analyzer and Ground Penetrating Radar. Open Journal of Civil Engineering, 12, 14 21 https://doi.org/10.4236/ojce.2022.121002
[7] Abdelmajeed Altlomate, F.A., Mohammed Elkher, Nurul Izzati Raihan Ramzi Hannan, Sharifah Salwa Mohd Zuki, Faisal Sheikh Khalid, Mohd Haziman Wan Ibrahim (2018) Evaluate the Current Expressions of Compression Strength and UPV Relationship. International Journal of Integrated Engineering 10 (8).
[8] Giriftinoglu, C. (2007) The Use of Plastic Waste Materials in Asphalt Pavements. M.Sc Thesis, Istanbul Technical University, TURKEY 1 (1), 1 35.
[9] Jendia, S. (2000) Highway Engineering Structural Design. Dar El Manara Library, Gaza, Palestine. 1 (1), 22 29.
[10] Sabina, K., T A, Sangita, Sharma D K & Sharma, B M (2009) Performance evaluation of waste plastic/polymer modified bituminous concrete mixes. Journal of Scientific & Industrial Research 2 (2), 975 979.
[11] Samie, H., Abdurraouf, O., Neil, A. and Wajdi, A. (2021) Use of Portable Seismic Property Analyzer and Ground Penetrating Radar to Assess Bridge Decks. Symposium on the Application of Geophysics to Engineering and Environmental Problems Proceedings, Denver, June 2021, 327 https://doi.org/10.4133/sageep.33 179
[12] Hamad, S., Ammar, W., Shaniba, S. and Altlomate, A. (2022). Bridge Deck Assessment of August a. Busch Using Portable Seismic Property Analyzer and Ground Penetrating Radar The e Journal of Nondestructive Testing, 2022 01 https://www.ndt.net/search/docs.php3?id=26507
[13] Hamad, S., Ammar, W. and Shaniba, S. (2021) Condition Assessment Using None Destructive Tests at Montauk Bridge Deck. International Journal for Research in Applied Science & Engineering Technology, 9, 581 588. https://doi.org/10.22214/ijraset.2021.39337