
10 X October 2022 https://doi.org/10.22214/ijraset.2022.46968
ISSN: 2321 9653; IC Value: 45.98; SJ Impact Factor: 7.538

Volume 10 Issue X Oct 2022 Available at www.ijraset.com

ISSN: 2321 9653; IC Value: 45.98; SJ Impact Factor: 7.538
Volume 10 Issue X Oct 2022 Available at www.ijraset.com
Abstract: Establishing the qualities of the pavement material and its structural capability is the most important step in establishing effective pavement maintenance and management techniques. This can be done by looking at how the pavement reacts to the applied load. The Falling Weight Deflectometer (FWD) is used in this study to assess the performance of a road stretch of the Federal Route in the State of Uttarakhand by measuring deflection in response to the weight applied at various sites along the highway. FWD is used to assess the pavement's response to a static load. Using the obtained deflection data, the KGPBACK is used to back-calculate the simulated layers of the pavement. Data is gathered then integrated into the IITPAVE software to create a pavement overlaying design. Flexible pavement is modelled as an elastic multilayer structure to see how bituminous overlay maintenance affected the distress models, and all 4 distress (cracking, rutting, rut depth, and roughness) are shown to be reduced. As a result, the research article provides a methodology that administrators can use to anticipate when and how much financing is needed to preserve and maintain the Indian Highway Road network.
Keywords: Falling Weight Deflectometer, KGPBACK Software, IIT PAVE Software, Fatigue Life, Rutting life.
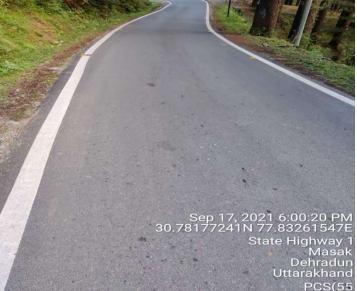
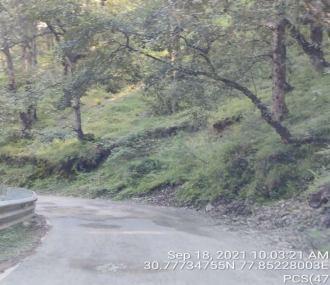
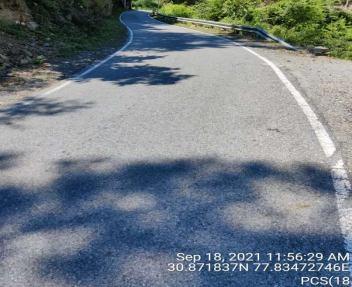
The proposed road (NH 707A) passes through India's Uttarakhand state. Tiuni, Chakrata, Bhediyana, Mussoorie, New Tehri, and Maletha are all located near Dehradun on the NH707A. The Project Road begins at Tuini at Km 0.00 on NH 707A and finishes at Chakrata Camp at Km 84.0 on NH 707A.In total, the proposed road is 84 kilometers long. The Falling Weight Deflector (FWD) is a simple, reliable, and practical tool for evaluating the structural properties of pavements and runways. Accurate position (velocity transducers) at the loaded region and various distances from the middle determine the pavement deflection and deflection bowl. The deflection levels are unaffected by the loading or recording system design, nor by probable effects of shaky reference points, such as those found in several competing solutions. Observed deflection data from FWD is generally used to assess pavement structural capacity, ease overlay design, and determines whether a pavement is overloaded. FWD data is commonly used to identify whether a pavement is overcrowded, as well as to analyse its structural capability. Depending on its design, a FWD could be restricted to a trailer or built into a self propelled or say vehicle mounted falling weight deflectometer. A FWD installed in a big truck and a ground penetrating radar for determination of temperature and an impact absorbent are standard components of comprehensive road survey vehicles. A FWD simulates the loads produced by a rotating vehicle wheel by applying a load pulse on the surface of the pavement during testing. A massive product is present in a "cushion" to change its momentum before being relayed to the highway via a spinning load plate. The deformation of the pavement in response to the load pulse is measured using deflection sensors. The amount of applied load impulse is considered constant by system design in some FWDs. The most common application of FWD data is to evaluate stiffness and its corresponding characteristics of pavement construction. Because there is no closed form solution, the process of computing the elastic moduli of individual layers in a multi layer system (e.g., Bituminous concrete is topmost layer, while base course is above of the subgrade) is based on surface deflections is known as "back calculation. Instead, initial moduli are assumed, surface deflections are determined, and the moduli are changed iteratively until the measured deflections are met. On contemporary computers, this operation is computationally expensive but rapid. It can produce some quite deceptive results and necessitates the use of a skilled analyst. Back calculation software that is commonly used is
ISSN: 2321 9653; IC Value: 45.98; SJ Impact Factor: 7.538
Volume 10 Issue X Oct 2022 Available at www.ijraset.com
Singh et al., (2020) The pavement under consideration in this study is part of an in service segment of a two lane single carriageway flexible pavement with a 7 meter wide paved/earthen shoulder and a 1.5 meter wide paved/earthen shoulder National Highway in Haryana, India. The information was gathered in analysis to define the origins of multiple kinds of pavement distress over time, as well as suffering caused by design flaws, poor material choices, and faulty construction Seo et al., (2009) The goal of this research is to use the back calculation approach to account for the dynamic impacts of the deflection basin from the FWD.
After turning dynamic deflections into static deflections, the layer moduli were calculated using a pseudo static back calculation process called DYN BAL (Dynamic BALMAT). The applicability and reliability of the back calculation approach, which can accommodate the dynamic effect, were evaluated in situ. FWD testing was undertaken in fact at a Multi Depth Deflectometer (MDD) installation. Compared to numerous other computer codes in use, the test findings revealed that DYN BAL offers the first most reliable outcomes.
Qiao et al., (2020), this paper deals normally planned with historical climate in mind, but future climate change poses a challenge. Quantifying the effects of climate change on pavement service life can help road authorities plan for climate adaptation and, ultimately, incorporate climate resilience into road infrastructure design and management. In this study, a unique data driven methodology is created to estimate the effects of climate change on the lifespan of the floor service in places was the drop in the FWD data (FWD) was permanently collected, using the following methods:
a) Using previous climate data, maintenance, and traffic patterns as candidate inputs and pavement layer stiffness back estimated from FWD diagnostics are conclusions, train a supervised model (linear regression or Artificial Neural Networks, ANN).
b) Predicting layer stiffness for four future 20 year periods using statistically downscaled future climate forecasts from three Coupled Model Intercomparison Project Phase 5 global climate models and three greenhouse gas concentration scenarios
The VMFWD (Vehicle Mounted Falling Weight Deflectometer) has been used to measure deflections along the road surface. To generate the deflections, a target peak load of 40KN is applied to the pavement surface. Sensors are installed at some radial distances such as 0, 200, 300, 450, 600, 900 and 1200mm from the centre of the loading plate to measure the deflections produced. Load and deflection data were recorded for atleast three drops at each test point position. If any data was found to be incorrect or unreasonable at any test location, it was erased, and FWD measurements were conducted again at that spot. The temperature of the concrete topsoil was measured using the vehicle's built in radar system, which was positioned on the backside. The proposed road (NH 707A) passes through India's Uttarakhand state.
Tiuni, Chakrata, Bhediyana, Mussoorie, New Tehri, and Maletha are all located near Dehradun on the NH 707A. The Project Road begins at Tuini km Towards 0.00 on NH 707A and finishes at Chakrata Cantonment at Km 84.0 on NH 707A. The proposed road is 84 km.
The Pavement Evaluation Report's objective is to use non destructive testing to validate the structural strength of the new residential pavement.
The report's key goals are as follows: Examine the in service pavement's structural soundness. Calculate the Pavement's Remaining Fatigue Life in Million Standard Axles backward (MSA). If the pavement's remaining fatigue/rutting life is shorter than the design MSA assessed, an additional overlay should be proposed.
As part of the pavement study, field investigations were conducted to capture the necessary data for pavement evaluation. This research is separated into the following sections, as listed below:
Existing Pavement Crust Layer Thickness
FWD Survey (Falling Weight Deflectometer)
1) Existing Pavement Crust Layer Thickness: The following layers and their thicknesses were identified along the road based on historical data:
a) Bituminous Terrain (BT Layer).
b) Layers of Granularity (NBT Layer).
ISSN: 2321 9653; IC Value: 45.98; SJ Impact Factor: 7.538 Volume 10 Issue X Oct 2022 Available at www.ijraset.com
TABLEI
Summary Of Existing Pavement Composition
Chainag e (km) Layer thickness (mm) BT Layer thickness (mm) NBT
Total thickness (mm)
0 52 75 200 275 52 63 80 200 280 63 72 75 200 275 72 74 80 200 280 74 81 85 200 275 81 84 90 295 385
Visual Condition of Pavement Survey Detailed visual inspection of existing pavement have its own vital role to ascertain the existing pavement condition. It involves the type of distress, quantification of distress type and its severity along the alignment. As per table 1 shown in IRC 115 2014, the alignment of project road is classified as Fair to Poor condition of the road
TABLEIII
Existing Pavement Condition Of Road S no. Chainage (Km) Pavement Condition (G/F/P) 1 0 10 Fair 2 10 12 Fair 3 12 13 Good 4 13 20 Fair 5 20 22 Good 6 22 45 Fair 7 45 52.5 Poor 8 52.5 59 Good 9 59 71 Poor 10 71 73 Good 11 73 80 Poor 12 80 82 Fair 13 82 83 Good 14 83 84 Poor
ISSN: 2321 9653; IC Value: 45.98; SJ Impact Factor: 7.538
Volume 10 Issue X Oct 2022 Available at www.ijraset.com
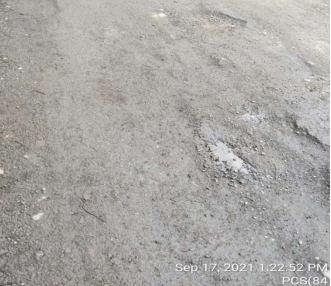
2) Falling Weight Deflectometer for Pavement Evaluation: The pavement was analysed by considering a Falling Weight Deflectometer (FWD) survey on September 17, 2021, throughout the full project stretch (excluding structure locations). The FWD survey followed the instructions of IRC 115 2014, The spacings in the table are based on the premise that the uniform section length is 1 km. By combining the spacing given in the table by the length of the average section, the actual spacing to be used may be determined. The sample size and data intervals for the Project Road (Single lane two way carriageway) are gathered depending on the length of the uniform based on the above mentioned criteria. section computed and pavement section condition, i.e., 'good,' 'fair,' and 'poor' for each lane to acquire a good sample size, a test interval of 500m is used for FWD measurement on a good pavement section, even though the uniform section length is more than 1 km. Along the whole alignment, an FWD survey was conducted upon both LHS and RHS.
Analysis of Data At each test site, the FWD survey principally consisted of peak load and peak deflections at various radial distances. According to Stipulation 4.4 of IRC:115 2014, the measured deflections were linearly scaled to match a standard load of 40.0 KN
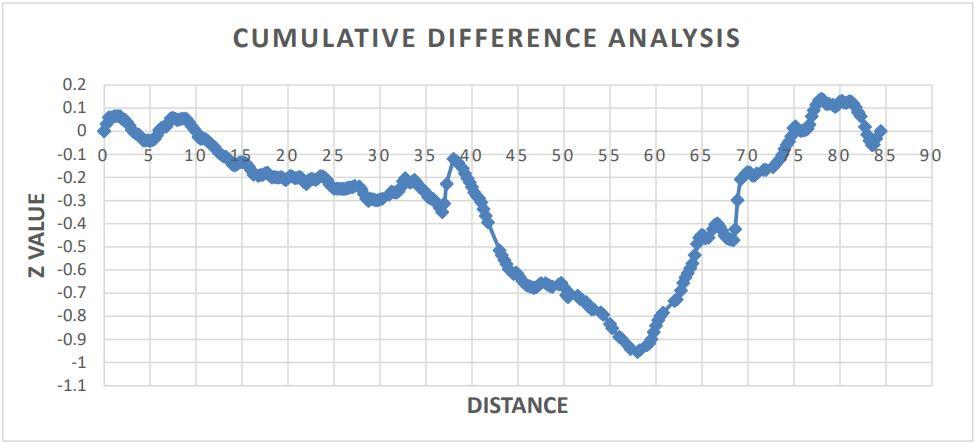
Identification of Homogenous Sections Identification of homogeneous parts of the road is done using cumulative difference analysis according to AASHTO, 1993. The Surface Curvature Index (SCI) variable is used to identify homogeneous sections on the project road. Surface Curvature Index (SCI) is a bowl shaped characteristic that reflects contribution of higher layers and is calculated at the difference between D0 and D300, where D0 and D300 are the peak deflections in mm measured at the centre of the loading plate and at radial distance of 300 mm is a parameter that describes the form of a bowl and highlights the participation of top layers.
Figure IVI
Cumulative Difference Approach Whenever the pattern in the plot of cumulative variation vs distance changes from affirmative to negative or vice versa, that should be used as a delineator for finding homogenous portions.
ISSN: 2321 9653; IC Value: 45.98; SJ Impact Factor: 7.538 Volume 10 Issue X Oct 2022 Available at www.ijraset.com
TABLEVII
Homogeneous Sections Of Road
Homogeneous Section Chainage
Homogeneous Section 1 Km 0.0 to Km 1.5
Homogeneous Section 2 Km 1.5 to Km 5
Homogeneous Section 3 Km 5 to Km 7.5
Homogeneous Section 4 Km 7.5 to Km 14.25
Homogeneous Section 5 Km 14.25 to Km 15.494
Homogeneous Section 6 Km 15.494 to Km 29.25
Homogeneous Section 7 Km 29.25 to Km 32.75
Homogeneous Section 8 Km 32.75 to Km 36.748
Homogeneous Section 9 Km 36.966 to Km 46.742
Homogeneous Section 10 Km 46.742 to Km 49.688
Homogeneous Section 11 Km 49.688 to Km 51.494
Homogeneous Section 12 Km 51.494 to Km 58.242
Homogeneous Section 13 Km 58.242 to Km 66.683
Homogeneous Section 14 Km 66.683 to Km 68.425
Homogeneous Section 15 Km 68.425 to Km 74.953
Homogeneous Section 16 Km 74.953 to Km 76.465
Homogeneous Section 17 Km 76.465 to Km 77.96
Homogeneous Section 18 Km 77.96 to Km 83.468
Backcalculation of layer moduli KGPBACK application was used to backcalculate the elastic properties of different layers for existing pavement in compliance with IRC 115 2014. Normalised surface deflections were combined with other inputs (layer thickness and Poisson's Ratio of different layers). Temperature and seasonal variation have been factored into these back calculated moduli values referenced in the parts that follow. For BT layers, the Poisson's ratio was determined to be 0.5, 0.4 for granular layers, and 0.4 for pavement structure.
Correction of Temperature
E35 = λ X ET
Where,
λ = temperature correction factor.
λ =(1 (0.238Xln))/(1 (0.238Xln))
E35= back calculation modulus at 35 0C, MPa ET = back calculation modulus at T 0C, MPa
The pavement Temperature has its own impact on values of backcalculated modulies in the pavement layer evaluation in FWD survey. As a result, back calculated moduli temperature other than 35°C i.e "T° C" was corrected with the help of given above equations. Temperature adjustment does not need to be applied to back calculated modulus values for Poor sections, according to clause 6.4.2 of IRC 115:2014. The normal pavement temperature of 35°C will not be applicable in colder places like Chakrata and tuinu with altitudes larger than 1000 m if the average daily temperature is less than 20°C for more than 4 months in a year, according to clause 6.4.3 of IRC 115:2014. When the ambient temperature exceeds 20°C, deflection measurements should be taken. Correction for Seasonal Variation The strength of granular subbase/base layer(s) and subgrade is affected by moisture content, and these layers are at their weakest during the monsoon period. The FWD investigation for this project took place during the monsoon season's hiatus. As a result, the back calculated granular and subgrade moduli are not subjected to corrective operation. The elastic layered structure of flexible pavement is simulated. A linear elastic layered model is used to calculate stresses and strains at crucial places (as illustrated in the Picture). Critical metrics for pavement evaluation have been a tensile strain at the beneath of the bituminous layer & a vertical compressive strain at the beneath of subgrade. The pavement's remaining life is calculated using these essential values of tensile and compressive strains.
ISSN: 2321 9653; IC Value: 45.98; SJ Impact Factor: 7.538 Volume 10 Issue X Oct 2022 Available at www.ijraset.com
Based on the range of Moduli parameters supplied as input, KGPBACK will calculate the moduli values for a defined set of normalized deflections
The range for Bituminous layer: thick layers without considerable cracking of 750 MPa to 3000 MPa, according to clause III.8.4 of IRC 115 2014. However, because some sections of the project road were built with DBM and BC with VG 30, the evaluation was carried out using the feasible range values of 750 to 2000 MPa (Table 9.2 in IRC 37 2018). The spectrum for Bituminous layers was in Impaired Condition (Fair to Poor) of 400 MPa to 1500 MPa is used for the analysis, according to paragraph III.8.4, IRC 115 2014
For granular layers, a lower bound of 100MPa and even an upper limit of 500MPa have been chosen according to clause III.8.4 of IRC 115 2014.
The research is performed using a subgrade range modulus of 20 to 100 MPa. The practical range values determined for km in 180 to km 230 are 50 to 100, and for km 230 to km 265 are 60 to 100, depending upon the age of the pavement, integrity of the pavement, and climatic circumstances.
TABLEVIV
Range Of Moduli For Various Layers
Layer Description Lower Modulus Range (MPa) Upper Modulus Range (MPa)
BC layer (Good) 750 2000 BT (Fair to Poor) 400 1500 Granular (NBT) 100 500 Subgrade 20 100
Because the road is a national highway, a 90 percent dependability factor was used to calculate the estimated endurance and rutting life of the newly constructed/in service pavement.
The calculated remaining fatigue and rutting life of the pavement are compared to the minimum needed design life after the analysis has been done using the process described above. If the pavement's remaining fatigued/rutting life is short, a compatible overlay is constructed and evaluated using the IITPAVE software to extend the pavement's life.
TABLEV
Design Modulus Values For Various Layers
Homogeneous Sections 15th Percentile Modulus (MPa) Bituminous Layer Granular Layer Subgrade
Homogeneous Section 1 1359.925 101.62 100
Homogeneous Section 2 1444.53 175.17 100
Homogeneous Section 3 1223.3 101.2 100
Homogeneous Section 4 1435.1 122.565 100
Homogeneous Section 5 1419.6 101.86 100
Homogeneous Section 6 1375.9 103.14 100
ISSN: 2321 9653; IC Value: 45.98; SJ Impact Factor: 7.538
Volume 10 Issue X Oct 2022 Available at www.ijraset.com
Homogeneous Section 7 1365.125 104.115 100
Homogeneous Section 8 1368.39 101.6 99.9
Homogeneous Section 9 1426.015 147.3 100
Homogeneous Section 10 855.24 104.3 100
Homogeneous Section 11 1406.04 105.68 100
Homogeneous Section 12 1411.05 109.71 100
Homogeneous Section 13 1267.2 100.3 76.675
Homogeneous Section 14 1329.36 100 99.89
Homogeneous Section 15 1423.35 104.35 93.275
Homogeneous Section 16 1456.175 116.75 75.8
Homogeneous Section 17 1471.5 103.8 99.775
Homogeneous Section 18 1418.97 112.355 100
On the idea of the above followed values, the ultimate life (Fatigue & Rutting) has been calculated for the venture avenue in phrases of Million Standard Axles (MSA) and is provided below
TABLE VI
Remaining Life Of Pavement In MSA
Homogeneous Section Chainage Fatigue Life Rutting Life
Homogeneous Section 1 Km 0.0 toKm1.5 0.37 0.83
Homogeneous Section 2 Km 1.5 to Km 5 1.14 1.23
Homogeneous Section 3 Km 5 to Km 7.5 0.33 0.77 Homogeneous Section 4 Km 7.5 to Km 14.25 0.55 0.94
Homogeneous Section 5 Km 14.25 to Km 15.494 0.39 0.86
Homogeneous Section 6 Km 15.494 to Km 29.25 0.39 0.85
Homogeneous Section 7 Km 29.25 to Km 32.75 0.39 0.84
Homogeneous Section 8 Km 32.75 to Km 36.748 0.37 0.83
Homogeneous Section 9 Km 36.966 to Km 46.742 0.78 1.06
Homogeneous Section 10 Km 46.742 to Km 49.688 0.26 0.64
Homogeneous Section 11 Km 49.688 to Km 51.494 0.4 0.86
Homogeneous Section 12 Km 51.494 to Km 58.242 0.51 1.05
Homogeneous Section 13 Km 58.242 to Km 66.683 0.33 0.35
Homogeneous Section 14 Km 66.683 to Km 68.425 0.35 0.81
Homogeneous Section 15 Km 68.425 to Km 74.953 0.4 0.69
Homogeneous Section 16 Km 74.953 to Km 76.465 0.47 0.38
Homogeneous Section 17 Km 76.465 to Km 77.96 0.42 0.88
Homogeneous Section 18 Km 77.96 to Km 83.468 0.6 2.13
The existing pavement remaining life is less than 1 MSA as shown in table VI and deficient in granular layer thickness along the project road. Therefore, Reconstruction of pavement is Recommended. Therefore, the existing layers (like different bituminous layers) crust needs to be remove completely by milling or scarifying machines, and then the pavement is required to built up with the granular layer(s) and bituminous Surfacing. The thickness and composition of pavement layers shall conform to IRC 37:2018.
ISSN: 2321 9653; IC Value: 45.98; SJ Impact Factor: 7.538 Volume 10 Issue X Oct 2022 Available at www.ijraset.com
We are thankful to Department of Civil Engineering of Galgotias University, Greater Noida (UP) for support and their Effort. Special thanks to CB Raman Sir (Partner of MS Park Futuristics & Associates) for Providing Tools and Equipment’s such as VMFWD etc. Thanks to PWD Uttarakhand for providing Necessary data that were required for analysis purpose.
[1] Singh, A., Sharma, A., & Chopra, T. (2020). Analysis of the flexible pavement using falling weight deflectometer for indian national highway road network. Transportation Research Procedia, 48(September), 3969 3979. https://doi.org/10.1016/j.trpro.2020.08.024
[2] Seo, J. W., Kim, S. Il, Choi, J. S., & Park, D. W. (2009). Evaluation of layer properties of flexible pavement using a pseudo static analysis procedure of Falling Weight Deflectometer. Construction and Building Materials, 23(10), 3206 3213. https://doi.org/10.1016/j.conbuildmat.2009.06.009
[3] Qiao, Y., Zhang, Y., Zhu, Y., Lemkus, T., Stoner, A. M. K., Zhang, J., & Cui, Y. (2020). Assessing impacts of climate change on flexible pavement service life based on Falling Weight Deflectometer measurements. Physics and Chemistry of the Earth, 120(October 2018), 102908. https://doi.org/10.1016/j.pce.2020.102908.
[4] IRC (Indian Roads Congress). (2012). “Guidelines for the design of flexible pavements.” IRC:37 2012, New Delhi, India, 12 18.
[5] Deori, S., Choudhary, R., Tiwari, D., & Gangopadhyay, S. (2018). Calibration of HDM 4 models for Indian conditions of flexible pavement having modified bitumen in wearing course. International Journal of Pavement Engineering, 19(9), 772 785. https://doi.org/10.1080/10298436.2016.1208196
[6] Singh, A., and Chopra, T. (2018a). “Development of Pavement Maintenance Management System for The Urban Road Network by Calibrating the HDM 4 Distress Models.” 1 8. New Delhi: CSIR CRRI, pp.239 248. ISBN: 978 93 88237 20 8.
[7] Solanki, U., Solanki, U. J., Gundalia, P. J., and Barasara, M. D. (2015). “A Review on Structural Evaluation of Flexible Pavements using Falling Weight Deflectometer Structural Evaluation of Flexible Pavement using Falling Weight Deflectometer View project A Study of interface bond between Prime coat over granular base, prime c.” Ttea, (January 2014), 1 10.
[8] IRC 115. (2014). Guidelines For Structural Evaluation and Strengthening of Flexible Road Pavements Using Falling Weight Deflectometer (Fwd.) Technique. New Delhi.
[9] https://pwd.uk.gov.in/files/3530_1.pdf
[10] Kurt D. Smith, James E. Bruinsma, Monty J. Wade, Karim Chatti, Julie M. Vandenbossche, and H. T. Y. (2017). Using falling weight deflectometer data with mechanistic empirical design and analysis, volume I: final report. Report No. FHWA HRT 16 009. Federal Highway Administration, I(March), 182.
[11] https://trid.trb.org/view/795808
[12] Pavement, L., & Program, P. (2006). Performance Program Manual for Falling Weight deflectometer. December.