ISSN: 2321 9653; IC Value: 45.98; SJ Impact Factor: 7.538 Volume 10 Issue X Oct 2022 Available at www.ijraset.com


ISSN: 2321 9653; IC Value: 45.98; SJ Impact Factor: 7.538 Volume 10 Issue X Oct 2022 Available at www.ijraset.com

Abstract: The effective use of wind tunnel testing in determining aerodynamic properties of a body is very much dependent upon the reliability and speed with which wind tunnel data can be reduced. The operating efficiency of the wind tunnels is substantially improved by the capability of providing lower aerodynamic coefficients in real time, or online, which decreases the expensive wind-tunnel time necessary for each test. This paper describes a system for presenting reduced wind-tunnel data in real time for UTM LST. The requirements for data handling equipment and data reduction procedures for wind tunnels are quite diverse, and depend upon the wind tunnel design and the type of tests for which they are used. The supersonic wind tunnels mentioned in this description have a variety of force-balance systems and are used for force tests, pressure tests, and other research projects. Consequently, the problems associated with in order to solve this diversity we build a computerized program where we can find the transformation of axis and aerodynamic characteristics at ease. This program can find the values of different aerodynamic coefficients with certain angle of attacks.
This final year project is an experimental study to build a computerized system that can provide the conversion from body axis to wind axis of external balance of a low speed wind tunnel. There are several types of wind tunnel balances. One of the most important is external balance. Whether they are put inside the test area of the wind tunnel or outside the model, they always interfere with the wind flow in some way. These balances come in varying degrees of sophistication, mostly determined by the number of measurement channels, which can range from 1 to 6. The complete mechanical decoupling of the six load components is the opposing balance design principle. The output of each channel will be a unidirectional load signal (traction compression), with the lift, drag, lateral forces, and pitching, rolling, and yawing moments making up the signals. In this project our goal is to obtain a reduced data from wind tunnel testing data and find the aerodynamic coefficients.
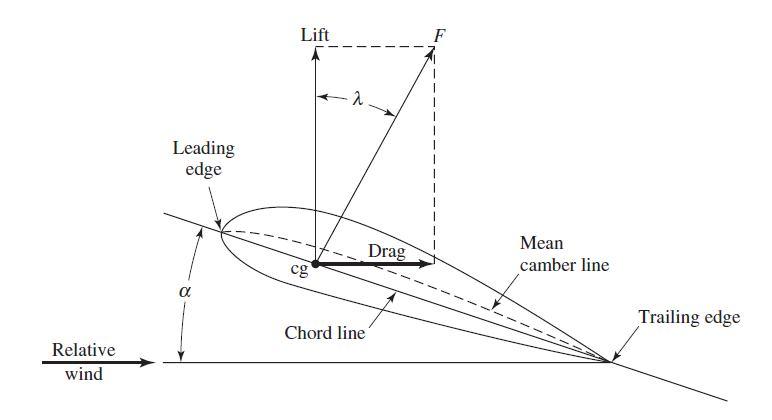
Pressure and shear stress distribution cause aerodynamic forces and moments. The force of the pressure acts perpendicular to the surface. Aerodynamic coefficients are non dimensional quantities used to determine the aerodynamic characteristics of an airplane or other objects[1]. Rather than merely employing forces, they consider all planes to be in the same arena and calculate a force ratio. A large plane usually has more lift than a small plane, however this also means that large planes have a smaller lift coefficient
Figure 1. Aerodynamic forces on an airfoil (aerodynamic forces and coefficients, 2004)

ISSN: 2321 9653; IC Value: 45.98; SJ Impact Factor: 7.538 Volume 10 Issue X Oct 2022 Available at www.ijraset.com

Aerodynamic coefficients are non dimensional quantities used to calculate an aircraft's aerodynamic characteristics [2]. Rather than just employing forces, they use a ratio of forces to bring all planes into the same arena. A large plane may have more lift than a small plane, but its lift coefficient is lower. Efficiencies can be rapidly compared using aerodynamic coefficients.

Wind tunnel balances come in a variety of shapes and sizes. External balancing is one of the most crucial. They can be installed outside the model, within or outside the wind tunnel chamber test section, but they always cause some wind flow interference. These balances come in a variety of levels of sophistication, which are determined by the number of measurement channels, which can range from one to six. A complete mechanical decoupling of the 6 load components is the opposite balancing design approach.
Since a large part of the typical wind tunnel testing program is spent on tests needed to perform the data reduction, a short summary of what has to be corrected is in order here. As mentioned earlier, the raw data obtained from wind tunnel tests are not usable until it has been corrected for the various differences between testing inside a tunnel and flying the real aircraft in free air. The various corrections include axis transfer, tare effect, solid blockage, wake blockage etc.
Universiti Teknologi Malaysia Low Speed Wind Tunnel (UTM LST) was chosen for performing the experiment. The wind tunnel is located inside the Aeronautical Engineering Laboratory building. UTM LST capable to deliver a maximum airspeed of 80 m/s which equivalent to 288 km/hr with turbulence intensity approximately < 0.06% across the test section. The capability of the wind tunnel is suitable for the experiment configuration which are the model will be test at 30 m/s and 40 m/s airspeed. The wind tunnel test section area is 2.0 m wide 1.5 m height 5.5 m length. This is sufficient enough for the model to be placed and tested in the test section. Table 3.1 is the detailed specification of UTM LST.
UTM LST is a closed circuit type wind tunnel which the air circulates within the wind tunnel. The test section is equipped with an automated turntable floor. The turntable floor is capable to rotate which match the experiment configuration to analyze pressure wake at some yaw angle. Four strut support system will be used to assemble the model on the turntable floor [5]. The overview of the dimensions and plan view of the wind tunnel is illustrated in Figure 3.1.
ISSN: 2321 9653; IC Value: 45.98; SJ Impact Factor: 7.538

Volume 10 Issue X Oct 2022 Available at www.ijraset.com
Table 1 UTM LST specification
Manufactured Date 2001
Dimension (H W L)
4.9 ft x 6.6 ft x 19.0 ft (1.5 m x 2 m x 5.8 m)
Construction Type Solid Reynolds Number 1,000,000
Circuit Type
Closed circuit, single return
Power 430 kW AC motor
Power Type 2.9 m diameter, 16 blade, axial fan, variable RPM Stagnation Pressure/ Temperature Standard atmospheric
Data System
Data Acquisition
Pressure System
Balances
PC Dell, Windows 2000/NT Servers
Pacific Instrument PI 6000 Series
Scan valve Model DSM3000 ZOC Pressure transducer (128 port)
6 component external, internal, semi span, JR3 160M50
Ground Effects Not Available
Test Types Aero tests (3D, 2D, half model), Ground vehicle (automotive)
Air Supply System
12 bars
The model’s specification which was used in this experiment is given below
Table 2. Delta wing model dimension. Part Dimension
Length of Fuselage (core) 990 mm
Sweep angle 55°
Maximum wing span 1062 mm
Maximum wing chord 742 mm
Mean aerodynamic chord 493.7 mm
Fuselage diameter 65 mm Height 215 mm
ISSN: 2321 9653; IC Value: 45.98; SJ Impact Factor: 7.538

Volume 10 Issue X Oct 2022 Available at www.ijraset.com
Sample model installation on UTM LST
Collect data from UTM LST external balance Conduct an axis transformation from the collected data
Blockage correction Obtain aerodynamic coefficient from the corrected data
Plot graph according to the results
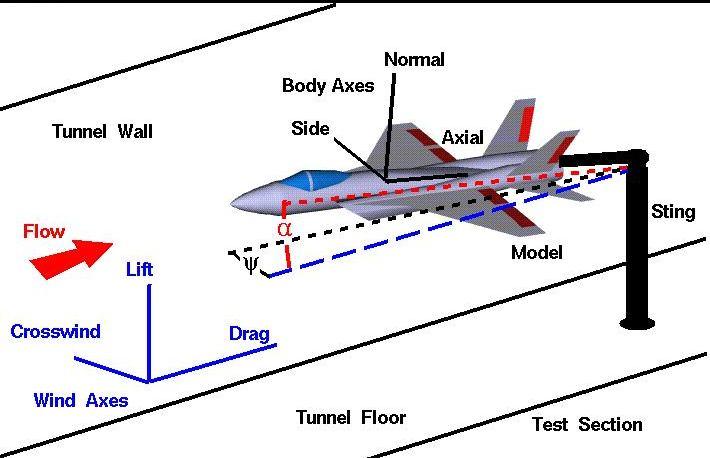
The wind axes, which are aligned with the walls of the wind tunnel, and the body axes, which are aligned with the geometry of the aircraft model, are shown in the diagram. The force balance measures forces and moments along the body axes when it is inserted inside the model.
The force balance measures forces and moments along the wind axes if it is external to the model. The sort of model mount used might also limit the kind of measurements and the axes of the measurements that can be taken. Whether we use internal or external balance, we ultimately need to figure out the measured forces in lift, drag, and lateral force, and the moments at pitch, roll moment, and yaw moment.
Drag and lift are defined as the components of aerodynamic force in the current and perpendicular flow directions, respectively. Thus, lift, drag and lateral force are measured directly on the axes of the wind. After getting the real data from six component external balance we can do the conversation of body axis to wind axis using the formula described in literature review. Basically this conversation is done by using Matlab.[3]
ISSN: 2321 9653; IC Value: 45.98; SJ Impact Factor: 7.538 Volume 10 Issue X Oct 2022 Available at www.ijraset.com


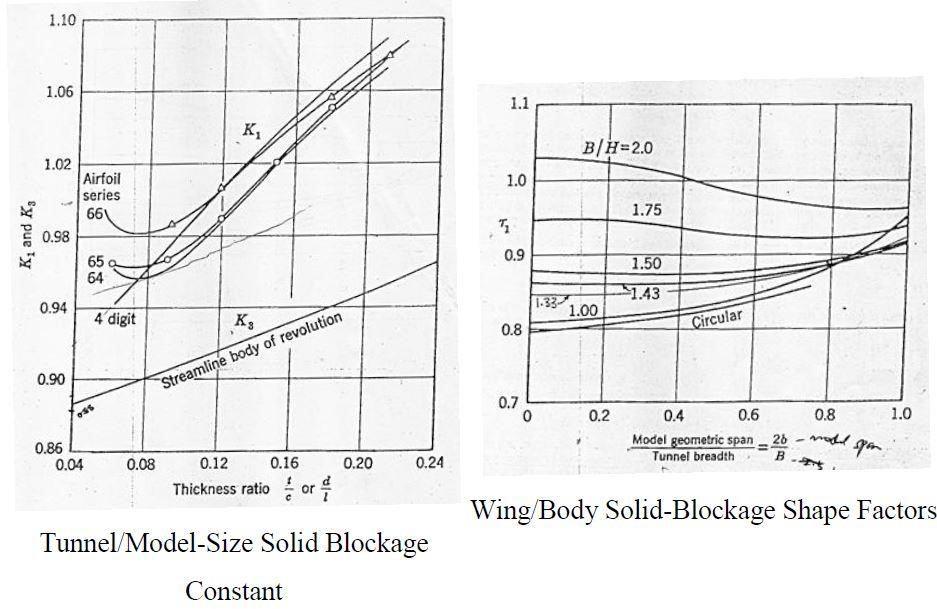
Blockage correction usually conduct to consider the effects of wakes produce in wind tunnel due to the bounded flow situation in wind tunnel. It is important factor to be measured as it causes the dynamic pressure on the object which is different from the real conditions due to wind speed in the tunnel[4]. Despite the fact that these are exceedingly challenging aspects to analyze for atypical geometry/flows, the total blockage correction factor is defined as the sum of the velocity increment induced by wake blockage and solid blockage. In order to find the total blockage occurred by the system is the addition of total solid blockage and total wake blockage. After getting the total blockage we need to find out the corrected dynamic pressure. From that we can obtain the corrected aerodynamic coefficient.

The matlab coding can be categorized into 3 distinctive parts. The part involves taking data from the excel sheets using the xlswrite command prompt. This code is rearranged properly by inversing the excel input.
The secondary part involves the calculation, using equations (1) to (18). These equations help modify our data from raw, unintelligible data to meaningful information of corrected coefficients. Once all our necessary data is jotted down into their respective excel sheets, an average of the data is obtained. Note that the data is separated by ascending order of alpha angle. For our final portion, we plotted graphs of our corrected coefficients vs alpha. Using the subplot function, all six graphs can displayed separately onto the same grid.
ISSN: 2321 9653; IC Value: 45.98; SJ Impact Factor: 7.538 Volume 10 Issue X Oct 2022 Available at www.ijraset.com

Two types of measuring techniques were in this experiment thus the data presentation will be in the form of coefficient of aerodynamic characteristics vs angle of attack plot. For steady balance data, coefficient of lift, drag, and pitching moment were plotted against angle of attack.
Corrected Aerodynamic Coeff ClVsα CdVsα CmVsα
Balanced Data
Figure 7. Data presentation
This section presents the aerodynamic characteristic based on data conversion from steady balance during wind tunnel testing. The aerodynamic characteristic discussed using graph plotted which was obtained from Matlab. All Aerodynamic coefficient involved has include the blockage correction.
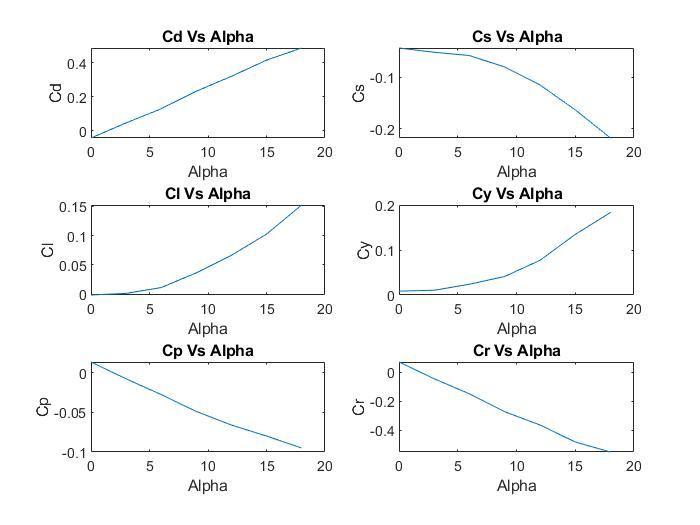
Figure 8. Aerodynamic coefficient characteristics

ISSN: 2321 9653; IC Value: 45.98; SJ Impact Factor: 7.538 Volume 10 Issue X Oct 2022 Available at www.ijraset.com

As shown in Figure 4.3, the coefficient of lift has risen against angle of attack. These results are obtained from matlab coding where we used angle of attack 0, 3, 6, 9, 12, 15, 18 and yawing angle is assumed as 5. All types of blockage correction has been done.
As shown in Figure 4.4, the coefficient of drag has risen against angle of attack. This results are obtained from matlab coding where we used angle of attack 0, 3, 6, 9, 12, 15, 18 and yawing angle is assumed as 5. All types of blockage correction has been done.
ISSN: 2321 9653; IC Value: 45.98; SJ Impact Factor: 7.538 Volume 10 Issue X Oct 2022 Available at www.ijraset.com
As shown in Figure 4.5, the coefficient of moment has fallen against angle of attack. This results are obtained from matlab coding where we used angle of attack 0, 3, 6, 9, 12, 15, 18 and yawing angle is assumed as 5. All types of blockage correction has been done.
In conclusion, the aim of this project is to build a program that can run the data reduction process for UTM LST. Wind tunnel test was done with balanced data measurement. In this project we have discussed how to build a computer program to find the aerodynamic characteristics and their relationship with angle of attack. Here we can see angle of attack and yawing angle can affect greatly to the results of aerodynamic characteristics. For the majority of common tests, the system will be able to offer reduced data and will be able to tabulate and plot reduced data in real time.
The author would like to express his gratitude towards his supervisor, PROF IR. DR. SHABUDIN BIN MAT, for his assistance and guidance throughout the period of this undergraduate project.
[1] Anderson, John D. Fundamentals of Aerodynamics, 4th Ed. McGraw Hill, 2007.
[2] Clancy, L. J. (1975). Aerodynamics. New York: John Wiley & Sons. Sections 4.15 & 5.4.
[3] Heyson, H.H., "Linearized Theory of Wind tunnel Jet Boundary corrections and Ground Effect for VTOL STOL Aircraft", NASA Technical Report R 124, 1962
[4] Hyvarinen, A. (2015). Investigation of blockage correction methods for full scale wind tunnel testing of trucks
[5] Noor AM, Mansor S (2013) Measuring Aerodynamic Characteristics Using High Performance Low Speed Wind Tunnel at Universiti Teknologi Malaysia. J Appl Mech Eng 2: 132. doi:10.4172/2168 9873.1000132

