
10 XI November 2022 https://doi.org/10.22214/ijraset.2022.47432
ISSN: 2321 9653; IC Value: 45.98; SJ Impact Factor: 7.538 Volume 10 Issue XI Nov 2022 Available at www.ijraset.com


ISSN: 2321 9653; IC Value: 45.98; SJ Impact Factor: 7.538 Volume 10 Issue XI Nov 2022 Available at www.ijraset.com
1,
Abstract: Credit card fraud has existed ever since credit cards were introduced, resulting in financial losses, identity theft, severe security threatas, and misuse of personal information. Such a situation already dire at an individual level only worsens when an organization gets involved. With the COVID 19 pandemic taking over the world and the introduction of quarantine, online transactions have surged exponentially. Naturally, credit cards have become one of the main means to process these transactions. With an extraordinary number of people making transactions every second, it becomes difficult to keep track of fraudulent ones. An increase in online transactions also increases the risk of cybercrimes, in this case, fraudulent transactions. In this paper, we proposed a fast yet light system to detect fraudulent transactions in the IEEE CIS dataset. We used feature engineering and data mining techniques to analyze the dataset and make it usable for the model. Then, we fit the dataset to LightGBM and XGBoost to classify the transactions as fraud or non fraud. Finally, we compared the performance of the two models. Since we were dealing with a heavily skewed dataset, we gauged the performance of our model with the F1 score and ROC AUC score. The obtained ROC AUC score was 95% for our proposed model.
Keywords: Credit card fraud, online transaction, feature engineering, machine learning, LightGBM.
The number of e commerce users has been steadily increasing in recent years, as has the size of online transactions. Fraudsters frequently employ a variety of channels to steal card information and transfer big sums of money in a short period of time, resulting in significant property losses for both customers and banks. As a result, machine learning and data mining can be used to create fraud detection systems. Techniques used for this purpose are primarily classification based. Data mining is applied to the dataset in question, then, classification algorithms are implemented to detect fraudulent transactions. Credit Card fraud detection is a heavily researched problem. Due to that, we were able to look at popularly used datasets and algorithms for the same purpose as well as devise a way that would prove to be better than them. SVM [1], Naïve Bayes, Logistic Regression, Artificial Neural Networks, Decision Trees, and K Nearest Neighbours were initially widely used for classification in this domain [7][17] They provided a moderate accuracy between 80 90% but improved with the incorporation of data mining techniques and hybrid models [3][5] the scores went up further. As we moved up the years, Random Forest was observed to be the preferred choice to classify fraudulent data [2][4][6]. It was better at overcoming the errors caused by highly imbalanced data in the fraud detection dataset. This occurs because each tree is generated by a random vector and each tree votes for the most popular category to classify the inputs. Random Forest’s generalization performance is superior. Although it did extremely well, it had a high training time and didn’t provide excellent results while working with a huge dataset XGBoost, a step above Random Forest, significantly reduced training times and increased the efficiency of memory usage [24][9] However, in the year 2017, a faster algorithm based on decision trees was released by Microsoft by the name of Light Gradient Boosting Machine or LightBGM. It is lighter and faster than XGBoost hence, we selected that as our classifier [8]
In this paper, we establish a fraud detection system based on the Gradient Boosting Decision Trees (GBDT) techniques of LightGBM and XGBoost. Also, the data processing done is related to feature engineering. The hidden knowledge behind the data is gained through the cleaning, correction, extraction, selection, and summary of a vast number of data attributes. Our goal is to extract the different information between the upcoming Gradient Boosting Decision Trees (GBDT) model in better achieving the goal of detecting fraudulent transactions, to find various behaviour patterns of actual users and fraud activity patterns in the data.
Section 2 discusses the related work the base concepts and the reasons for choosing those concepts. Section 3 talks about the proposed system a brief breakdown of our system, analysis of the dataset, and application of feature engineering techniques.

ISSN: 2321 9653; IC Value: 45.98; SJ Impact Factor: 7.538 Volume 10 Issue XI Nov 2022 Available at www.ijraset.com
In section 4 we discuss the results of our machine learning model. In section 5, we discuss our results and show the comparison between LightGBM and XGBoost models. The performance of the algorithms is compared with respect to recall, f1 score, and AUC score parameters. Lastly, in section 7 we conclude our paper.
Ensemble learning requires combining the strengths of a number of simpler base models to generate a prediction model. It can be broken down into two tasks: developing a population of base learners from the training data, and then combining them to form the composite predictor [11]
Ensemble learning methods exploit multiple machine learning algorithms to produce weak predictive results based on features extracted through a diversity of projections on data, and fuse results with various voting mechanisms to achieve better performances than that obtained from any constituent algorithm alone [10]
Ensemble learning has two methods that serve as umbrella terms for several methods under them: The first is averaging methods, the driving principle here is to make multiple estimators individually and average their predictions. On average, the combined estimators are usually better than the individual base estimators because of the small variance [12]. This includes methods such as Random forests, bagging ensembles, etc.
The second, in contrast to the first, is boosting methods. Here, base estimators are built sequentially, and one tries to reduce the bias of the combined estimator. The motivation is to combine several weak models to produce a powerful ensemble [12]. Examples of these are AdaBoost, and Gradient tree boosting (LightGBM, XGBoost, etc.)
Ensembles have been shown to be an efficient way of improving predictive accuracy or/and decomposing a complex, difficult learning problem into easier sub problems [13]
XGBoost or Extreme Gradient Boosting is a large scale, distributed general purpose Gradient Boosting library, or a Boosting iterative method [18]. The XGBoost model has the following benefits: great generalization, high expandability, and quick processing speed. A series of base classifiers make up the XGBoost algorithm. Decision trees, KNN, SVM, logistic regression, and other algorithms are among the available base classifiers. Following the determination of the base classifier, the base classifiers are linearly overlaid to optimize the method.
Gradient Boosting Decision Trees (GBDT) techniques have been shown to be among the top machine learning algorithms. And LightGBM is one of the superior ones. Both LightGBM and XGBoost are decision tree based algorithms. The difference in them arises from how the trees are formed. LightGBM splits the tree leaf wise according to the best fit unlike XGBoost, which splits the tree depth wise. This means that when growing on the same leaf in LightGBM, the leaf wise algorithm can reduce more loss than the level wise algorithm leading to much better accuracy which can rarely be achieved by any of the existing boosting algorithms [21 23]. It is intended to be distributed and efficient. It offers the benefits of increased training efficiency and speed, reduction in memory utilization and better precision. Parallel, distributed and GPU learning are all supported, and it can deal with massive amounts of data.
The predicted values right or wrong are given a label on the basis of their correctness.
1) True Positive (TP): The prediction and actual value are both positive.
2) True Negative (TN): The prediction and actual value are both negative.
3) False Positive (FP): The model’s prediction for a negative value is wrong. It predicts the actual negative value as positive.
4) False Negative (FN): The model’s prediction for a positive value is wrong. It predicts the actual positive value as negative.
5) Accuracy: Percentage of correctly predicted values (positive and negative) over total values
Accuracy = (TP+TN)/(TP+TN+FP+FN)
6) Precision: Percentage of correct positive predictions out of all positive predictions
Precision = TP/(TP+FP)
Engineering Technology (IJRASET
ISSN: 2321 9653; IC Value: 45.98; SJ Impact Factor: 7.538 Volume 10 Issue XI Nov 2022 Available at www.ijraset.com
7) Recall or True Positive Rate (TPR): Percentage of correct positive predictions out of all the actual positive values
Recall = TP/(TP+FN)
8) F1 Score: Combines precision and recall into one single metric. Harmonic mean of precision and recall or the weighted average of precision and recall
F1 score = 2*(Precision*Recall)/(Precision+Recall)

9) False Positive Rate (FPR): Percentage of incorrect negative predictions out of all the actual negative values (actual negative values predicted as positive)
False Positive Rate = FP/(FP+TN)
10) ROC AUC Score: The term ROC stands for Receiver Operating Characteristics and AUC refers to the area under the curve. To speak about the ROC AUC score, we must first establish the ROC curve. It's a graph that depicts the trade off between the true positive rate (TPR) and the false positive rate (FPR). Basically, we calculate TPR and FPR for each threshold and plot them on a single chart. Naturally, the higher the TPR and the lower the FPR for each threshold, the better, therefore classifiers with more top left side curves are better. The more top left the curve is the higher the area and higher the ROC AUC score. We used Recall and ROC AUC as our performance metrics. Precision and Recall are sensitive to imbalanced data. Given a dataset, if actual positive values increase, true positive rates also increase. And if all the values in the dataset increase, actual negative values may also increase, meaning the value of true negative also increases. Hence, Recall is a good measure for imbalanced dataset as it can change significantly with a change in the values of TP and TN. AUC is a better performance measure than accuracy for comparing learning algorithms [19]. The closer the ROC score to 1, the better will be the classifier. ROC AUC is a better measure of classifier performance than accuracy because it does not bias the size of test or evaluation data. Accuracy is always biased on the size of test data. Another reason to use metrics other than accuracy for imbalanced data is that accuracy is insensitive to it [20]. This is because as the skew in our data increases, predicting the accuracy also increases giving an illusion that our model is doing good. If some data has 1 fraudulent transaction and 99 nonfraudulent transactions, if the model always predicts nonfraudulent transactions, its accuracy will be 99%. Since our data is heavily skewed, judging the model’s performance on the basis of accuracy will not be correct.
ISSN: 2321 9653; IC Value: 45.98; SJ Impact Factor: 7.538
Volume 10 Issue XI Nov 2022 Available at www.ijraset.com
The dataset transaction table and the identification table are the two types of tables in the IEEE CIS dataset. The key transaction id connects these two types of tables, however not all transactions provide identity information. The data has been classified into two categories: isFraud = 0 or isFraud = 1. However, because some characteristic information is still missing, we clean and pre process the data before combining it to create the final training data. We can examine the two tables separately in order to better handle data.
Table I Transaction Table
Name Description Type
Transaction ID ID of transaction ID
isFraud Binary values Categorical
TransactionDT Transaction date Time
TransactionAmt Transaction amount Numerical
card1 card6 Card (credit card) Categorical
ProductCD Product code Categorical
addr1 addr2 Address Categorical
M1 M9 Anonymous features Categorical
P_email domain Purchaser email domain Categorical
R_email domain Receiver email domain Categorical
dist1 dist2 Country distance Numerical
C1 C14 Anonymous features Numerical
D1 D15 Anonymous feature Numerical
V1 V339 Anonymous features Numerical, Categorical
Table II Identity Table
Name Description Type
TransactionID ID of transaction ID
DeviceType Type of device Categorical
DeviceInfo Device information Categorical
id01 id11 Identification data Numerical
id12 id38 Identification data Numerical, Categorical
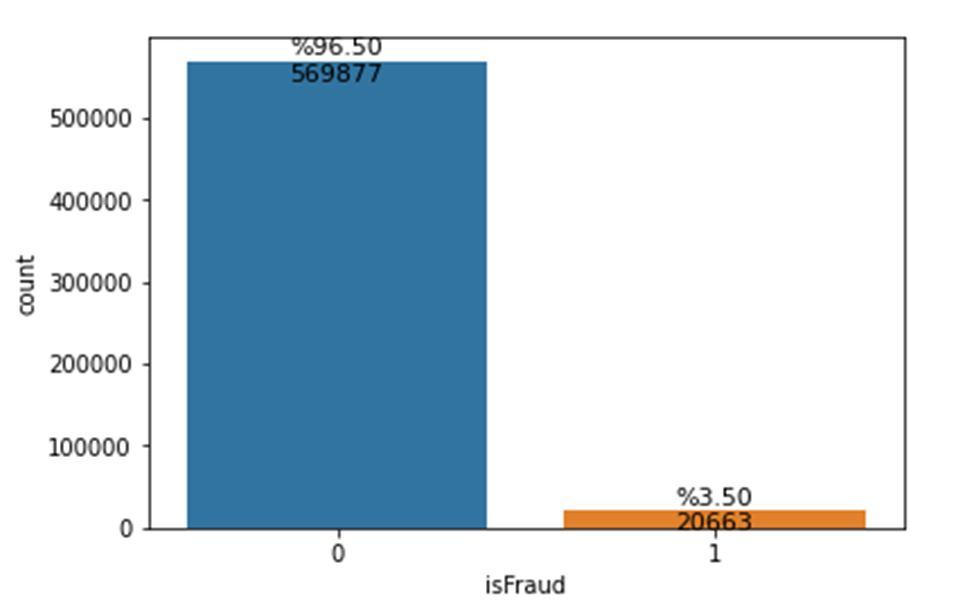
The above mentioned dataset is highly skewed, meaning, the ratio of fraud and non fraud data is drastic.
ISSN: 2321 9653; IC Value: 45.98; SJ Impact Factor: 7.538 Volume 10 Issue XI Nov 2022 Available at www.ijraset.com
To deal with data of such nature, it is essential to clean and analyze it to extract the essential or useful attributes. By performing feature engineering, we were able to reduce many features that were redundant or highly correlated which could have easily biased our model and led to overfitting. We will elaborate on these techniques further.

Since the dataset stage deals with data loading and integration. We focused on reducing the memory of the dataset and eliminating highly correlated columns. Removing collinear features can aid in the generalization of a model while also improving its interpretability. If the correlation coefficient exceeds the threshold, those collinear features are removed. Finally, we used frequency encoding for training and testing. Frequency encoding is the optimal solution for this data since one hot encoding and label encoding are not suitable for the nominal categorical data.
Since the dataset has over 1 million samples, it is necessary for us to get rid of unnecessary data and extract valuable information from usable data. Data mining and feature engineering are performed on the dataset to clean the data and handle missing values. While cleaning the data, we deleted the columns which have a greater percentage of missing values. We deleted the columns having only 1 unique value and having more than 90% missing values. A very important attribute in the dataset is TransactionDT, but on its own, it is not very helpful. To obtain more accurate information from it, we used a time series split. Because raw time series data usually only has one single column to describe the time attribute, namely date time, feature engineering is critical in this area. Regarding this date time data, feature engineering can be seen as extracting useful information from such data as standalone (distinct) features day of the week, month, hour, etc. With the help of data visualization, we can get an insight of the data and visual graphs of the same.
To give an example, we can observe from Fig.3 that in December, the Fraud rate decreased. The month of December is prominent in both train and test datasets.
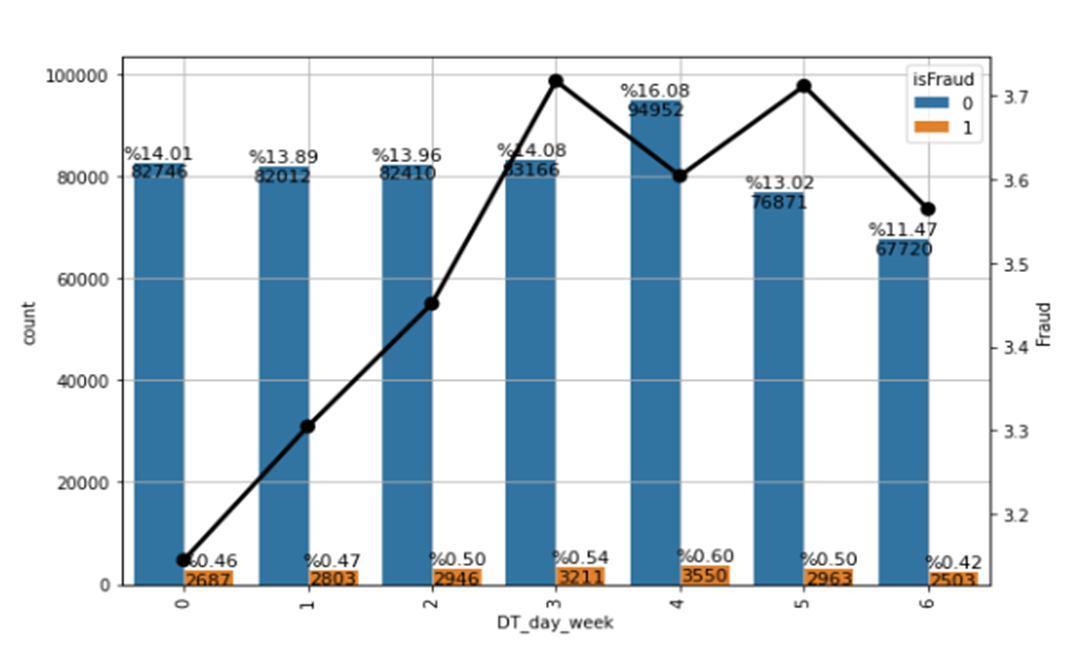
Similarly, in the following Fig. 5, we can see that the fraud rate tends to increase from the beginning of the week and tends to decrease on Friday and Sunday.
ISSN: 2321 9653; IC Value: 45.98; SJ Impact Factor: 7.538 Volume 10 Issue XI Nov 2022 Available at www.ijraset.com
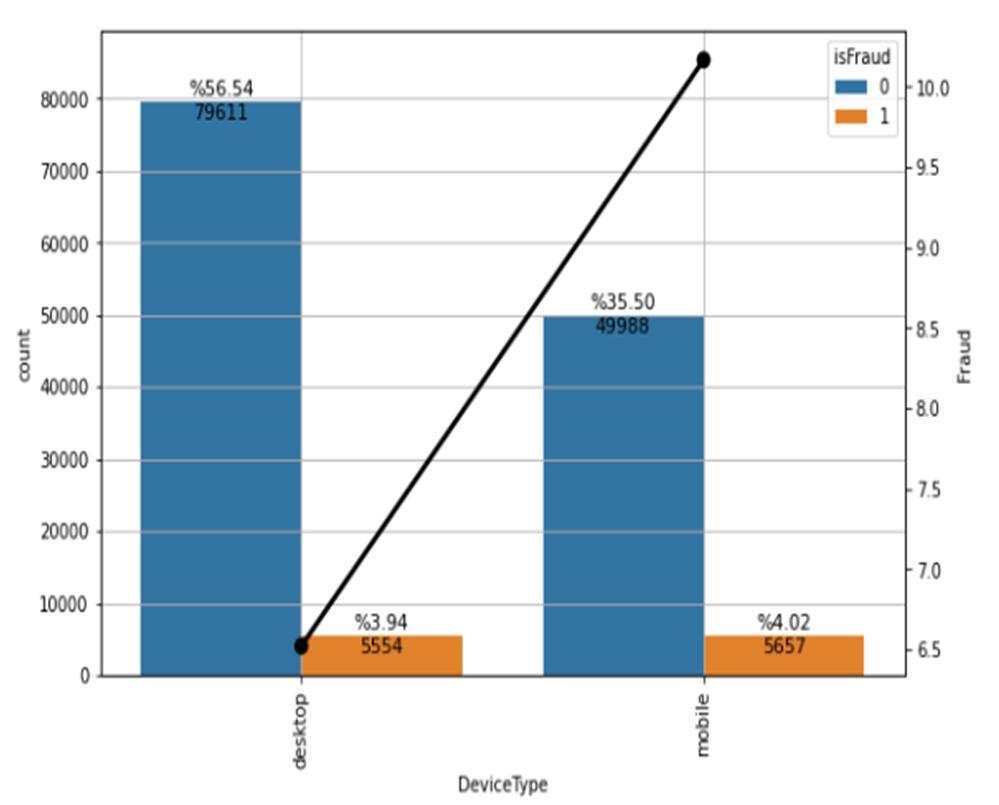
Further, we individually analysed categorical variables to either reduce their size, combine columns, or extract meaningful data by splitting them further. We found that in the DeviceType attribute, test data had new devices train data didn’t have. To sort that anomaly, we replaced those missing values with nan values. Then to get an idea of the device types, we visually represented it. It is interesting to see here that most fraudulent transactions have taken place from mobile phones (Fig. 6).
For the attributes R_emaildomain and P_emaildomain, we split them into the mail server and domain name (.com, .net, .jp, .fr, etc.). Hence two new useful attributes were created out of one which made processing easier. This stage dealt with dropping highly correlated columns, creating aggregated features, handling missing values and reducing the memory and dimensionality. Reduction of dimensionality was done by using frequency encoding for nominal categorical variables. Finally, the datasets were saved in pickle format.
PCA is a popular strategy for speeding up Machine Learning algorithms by removing linked variables that don't aid decision making. The training time of the algorithms is considerably decreased by having fewer features. Furthermore, when a dataset has too many variables, over fitting occurs. As a result, PCA helps Gto alleviate over fitting by reducing the number of features. PCA was applied to the ‘V’ columns for 62 features.
Section 3 elaborated on ensemble learning, LightGBM and XGBoost model and the reason why we chose to use it. It is particularly good at dealing with a large amount of data.
ISSN: 2321 9653; IC Value: 45.98; SJ Impact Factor: 7.538 Volume 10 Issue XI Nov 2022 Available at www.ijraset.com
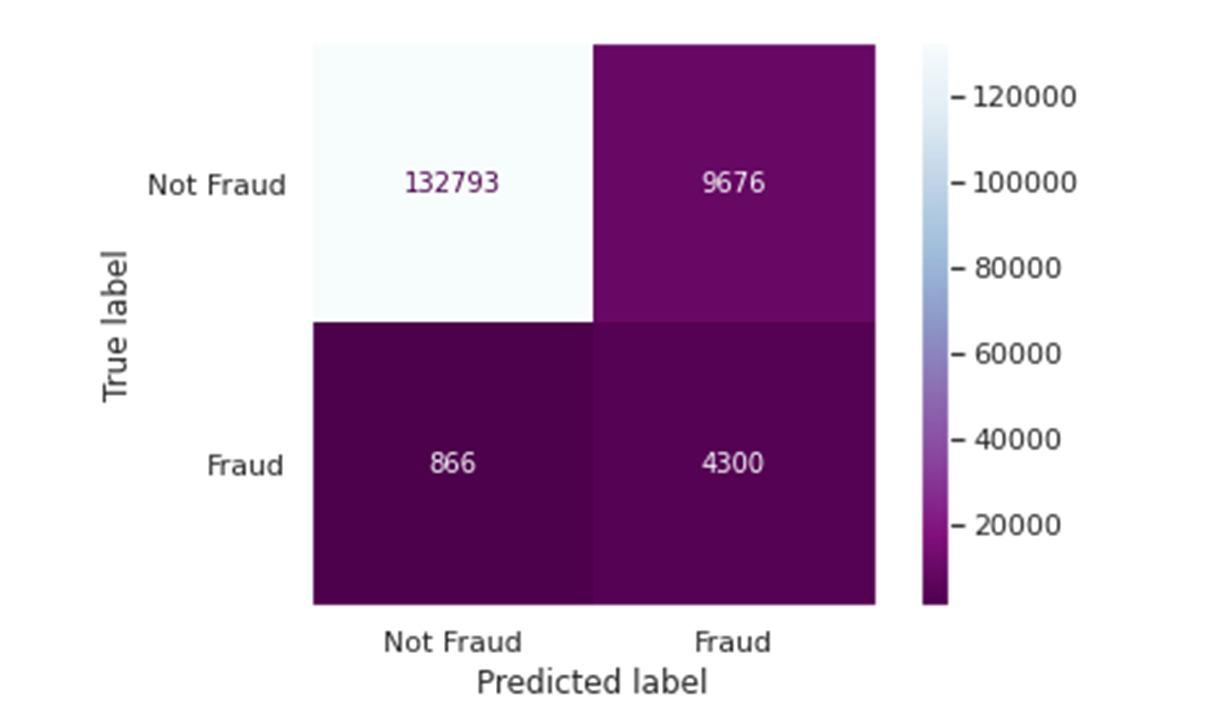
The confusion matric and the AUC ROC curve for our LightGBM model are shown in Fig. 6 and Fig. 7 respectively. Since we were dealing with a heavily skewed dataset, we gauged the performance of our model with F1and ROC AUC. Table III shows the comparison of ROC, Recall and F1 score for LightGBM and XGBoost. As seen from the table, LightGBM outperforms XGBoost in all the above metrics for the same dataset.
Fig. 6 Confusion Matrix Fig. 7 AUC and ROC curve
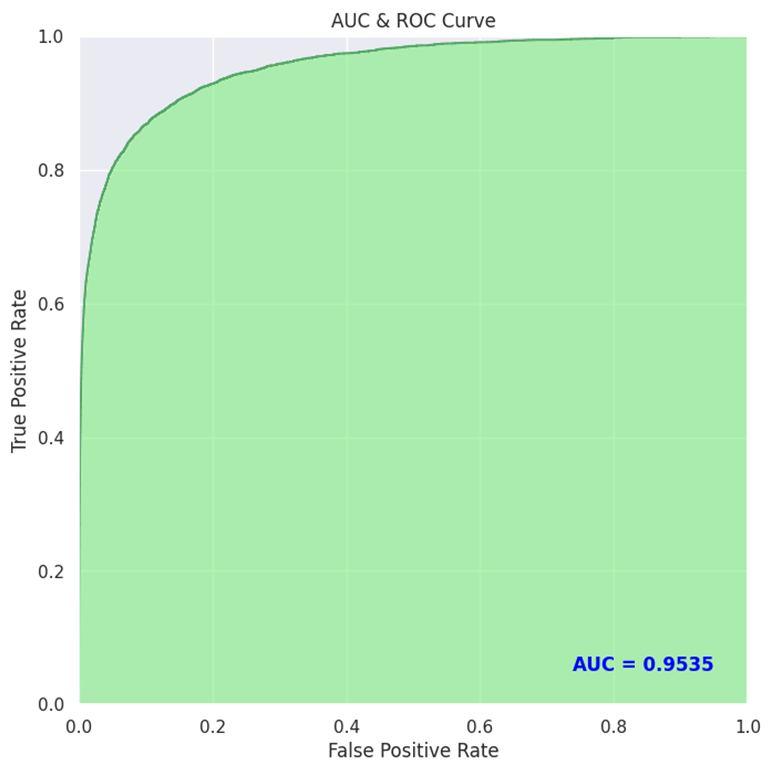
Table III Comparative Analysis
Model ROC Recall F1 Score
LightGBM 0.9547 0.8337 0.4478 XGBoost 0.8824 0.2704 0.4117
LightGBM (Fig. 8) performs better than XGBoost (Fig. 9) in terms of training time and memory use as well.
Fig. 8 Training time for LightGBM
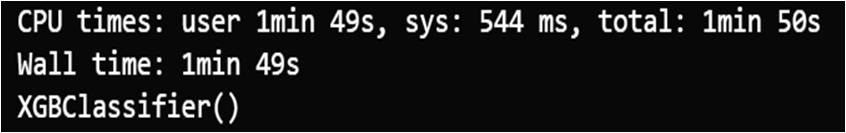
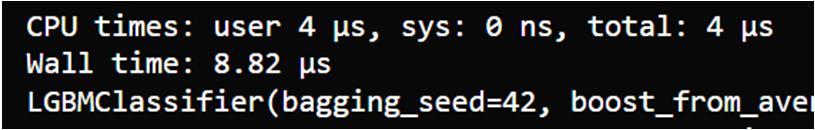
Fig. 9 Training time for XGBoost
In this paper, a machine learning based model LightGBM has been used for effective detection of financial fraud. Its effectiveness is verified on the IEEE CIS dataset. The imbalance or skewed nature of the dataset has been investigated in this project. Data pre processing, particularly feature extraction, has been crucial to the performance of this model, as it is for any machine learning workflow. This model has displayed effective handling of imbalanced cases in credit card fraud, showing an ROC AUC score of 0.95, Recall of 0.83 and, F1 score of 0.45 and performing better compared to the XGBoost Model on the same dataset which gave an ROC AUC score of 0.94, Recall of 0.47 and, F1 score of 0.41.
[1] I. M. Mary, M. Priyadharsini, K. K and M. S. F, "Online Transaction Fraud Detection System," 2021 International Conference on Advance Computing and Innovative Technologies in Engineering (ICACITE), 2021, pp. 14 16, doi: 10.1109/ICACITE51222.2021.9404750
[2] D. Shaohui, G. Qiu, H. Mai and H. Yu, "Customer Transaction Fraud Detection Using Random Forest," 2021 IEEE International Conference on Consumer Electronics and Computer Engineering (ICCECE), 2021, pp. 144 147, doi: 10.1109/ICCECE51280.2021.9342259.
[3] O. Vynokurova, D. Peleshko, O. Bondarenko, V. Ilyasov, V. Serzhantova and M. Peleshko, "Hybrid Machine Learning System for Solving Fraud Detection Tasks," 2020 IEEE Third International Conference on Data Stream Mining & Processing (DSMP), 2020, pp. 1 5, doi: 10.1109/DSMP47368.2020.9204244.
Science & Engineering Technology (IJRASET)
ISSN: 2321 9653; IC Value: 45.98; SJ Impact Factor: 7.538 Volume 10 Issue XI Nov 2022 Available at www.ijraset.com
[4] D. Devi, S. K. Biswas and B. Purkayastha, "A Cost sensitive weighted Random Forest Technique for Credit Card Fraud Detection," 2019 10th International Conference on Computing, Communication and Networking Technologies (ICCCNT), 2019, pp. 1 6, doi: 10.1109/ICCCNT45670.2019.8944885
[5] M. R. Dileep, A. V. Navaneeth and M. Abhishek, "A Novel Approach for Credit Card Fraud Detection using Decision Tree and Random Forest Algorithms," 2021 Third International Conference on Intelligent Communication Technologies and Virtual Mobile Networks (ICICV), 2021, pp. 1025 1028, doi: 10.1109/ICICV50876.2021.9388431.
[6] W. Deng, Z. Huang, J. Zhang and J. Xu, "A Data Mining Based System For Transaction Fraud Detection," 2021 IEEE International Conference on Consumer Electronics and Computer Engineering (ICCECE), 2021, pp. 542 545, doi: 10.1109/ICCECE51280.2021.9342376
[7] Aisha Abdallah, Mohd Aizaini Maarof, Anazida Zainal,Fraud detection system: A survey,Journal of Network and Computer Applications,Volume 68,2016,Pages 90 113,ISSN 1084 8045, https://doi.org/10.1016/j.jnca.2016.04.007
[8] Z. Song, "A Data Mining Based Fraud Detection Hybrid Algorithm in E bank," 2020 International Conference on Big Data, Artificial Intelligence and Internet of Things Engineering (ICBAIE), 2020, pp. 44 47, doi: 10.1109/ICBAIE49996.2020.00016.
[9] F. Wan, "XGBoost Based Supply Chain Fraud Detection Model," 2021 IEEE 2nd International Conference on Big Data, Artificial Intelligence and Internet of Things Engineering (ICBAIE), 2021, pp. 355 358, doi: 10.1109/ICBAIE52039.2021.9390041.
[10] Zhou Z H. Ensemble Methods: Foundations and Algorithms. Chapman and Hall/CRC, 2012
[11] Hastie, T., Tibshirani, R., Friedman, J. (2009). Ensemble Learning. In: The Elements of Statistical Learning. Springer Series in Statistics. Springer, New York, NY. https://doi.org/10.1007/978 0 387 84858 7_16
[12] https://scikit learn.org/stable/modules/ensemble.html
[13] Bartosz Krawczyk, Leandro L. Minku, João Gama, Jerzy Stefanowski, Michał Woźniak, Ensemble learning for data stream analysis: A survey, Information Fusion, Volume 37, 2017, Pages 132 156, ISSN 1566 2535, https://doi.org/10.1016/j.inffus.2017.02.004
[14] Siddhant Bagga, Anish Goyal, Namita Gupta, Arvind Goyal, Credit Card Fraud Detection using Pipeling and Ensemble Learning, Procedia Computer Science, Volume 173, 2020, Pages 104 112, ISSN 1877 0509, https://doi.org/10.1016/j.procs.2020.06.014
[15] Siddhartha Bhattacharyya, Sanjeev Jha, Kurian Tharakunnel, J. Christopher Westland, Data mining for credit card fraud: A comparative study, Decision Support Systems, Volume 50, Issue 3, 2011, Pages 602 613, ISSN 0167 9236, https://doi.org/10.1016/j.dss.2010.08.008
[16] F. Ahmed and R. Shamsuddin, "A Comparative Study of Credit Card Fraud Detection Using the Combination of Machine Learning Techniques with Data Imbalance Solution," 2021 2nd International Conference on Computing and Data Science (CDS), 2021, pp. 112 118, doi: 10.1109/CDS52072.2021.00026.
[17] Khaled Gubran Al Hashedi, Pritheega Magalingam, Financial fraud detection applying data mining techniques: A comprehensive review from 2009 to 2019, Computer Science Review, Volume 40, 2021, 100402, ISSN 1574 0137, https://doi.org/10.1016/j.cosrev.2021.100402.
[18] Li, S., Zhang, X. Research on orthopedic auxiliary classification and prediction model based on XGBoost algorithm. Neural Comput & Applic 32, 1971 1979 (2020). https://doi.org/10.1007/s00521 019 04378 4
[19] https://www.site.uottawa.ca/~stan/csi7162/presentations/William presentation.pdf (AUC ref)
[20] https://towardsdatascience.com/selecting the right metric for skewed classification problems 6e0a4a6167a7
[21] M. R. Machado, S. Karray and I. T. de Sousa, "LightGBM: an Effective Decision Tree Gradient Boosting Method to Predict Customer Loyalty in the Finance Industry," 2019 14th International Conference on Computer Science & Education (ICCSE), 2019, pp. 1111 1116, doi: 10.1109/ICCSE.2019.8845529.
[22] D. Zhang and Y. Gong, "The Comparison of LightGBM and XGBoost Coupling Factor Analysis and Prediagnosis of Acute Liver Failure," in IEEE Access, vol. 8, pp. 220990 221003, 2020, doi: 10.1109/ACCESS.2020.3042848
[23] Xiaojun Ma, Jinglan Sha, Dehua Wang, Yuanbo Yu, Qian Yang, Xueqi Niu, Study on a prediction of P2P network loan default based on the machine learning LightGBM and XGboost algorithms according to different high dimensional data cleaning, Electronic Commerce Research and Applications, Volume 31, 2018, Pages 24 39, ISSN 1567 4223, https://doi.org/10.1016/j.elerap.2018.08.002
[24] V. Jain, M. Agrawal and A. Kumar, "Performance Analysis of Machine Learning Algorithms in Credit Cards Fraud Detection," 2020 8th International Conference on Reliability, Infocom Technologies and Optimization (Trends and Future Directions) (ICRITO), 2020, pp. 86 88, doi: 10.1109/ICRITO48877.2020.9197762.