
10 IX September 2022 https://doi.org/10.22214/ijraset.2022.46722
ISSN:

ISSN:
Dr. JayshreeAgarkhed1 , ShwetaB Kulkarni2 , RamyaRani3
Department of Computer Science & Engineering, P.D.A College of Engineering, Kalaburagi, Karnataka

Abstract: The Corona Virus Disease popularized as COVID-19 is a highly transmissible viral infection and has severe impact on global health. It has impacted the global economy also very badly. To overcome it many vaccines were introduced but the distribution and handling of such information has become necessary to provide a user friendly interface for the layman in India. The project attempts to address such a problem. Furthermore, the application uses a machine learning model to detect the next number of cases based on the previous data time series data. Although the prediction is based on the time series data it provides a real world hint into the number of cases. The algorithm is based on a hybrid regression model on top of support vector machines, Polynomial regression, Bayesian Ridge regression. The final predicted cases are presented on the dashboard in a linear graph.
Index Term: Covid 19, Vaccination distribution.
The novel coronavirus disease 2019 COVID 19 has spread rapidly throughout the world since its first reported case in 2019. In China, COVID 19 first case was reported in Huanan Seafood Wholesale Market, Wuhan. The main reason which was supposed for the spread of this virus is the transmission from animal to human. Even so, the upcoming COVID 19 cases were not related to the subjection method. Hence the conclusion is that virus transmission is from humans to humans, and people with virus’s indicative are the main recurrent reason for the spread of COVID 19. The virus of coronaviruses (Co V) is a special kind of virus that itself is a disease and it enhances the existing disease in humans body which makes it a very dangerous virus. This virus results in wheezing, hard to breathe, bad digestive system, and liverwort, effects badly human nervous system (center), and also harms animals like cows, horses, and pigs that are kept, raised, and used by people and different wild animals. In showing the structure of COVID 19, this structure looks like a crown. As a report, the pandemic has sparked a new, widespread need for the knowledge discovery and prediction using the available data. The project presents a variety of services to the user including vaccination booking management services, user management and support services and dashboard service.
This paper is assembled in 4 section; Section 1 Introduction of covid 19 Section 2 represents related work section 3 represents proposed system andalgorithm section 4 conclusion.
This section discusses various research work on prediction algorithm and covid related work.
The prediction of the coronavirus cases is not only based on the linear time series data but also on different factors but most of the studies which were done were based on it. The studies mainly focus prediction of the cases based on the time series data by recognizingthe contribution of the each of the columns and computingtheir weight based on the priority. The prediction of the cases from the time series data would allow the prediction and anticipation of the cases in any region given. This could be used to help the control and prevention of large scale gatherings, help to provide awareness in the given area. Most of the features like the vaccination booking series provide an alert feature to the user which helps in alerting the user when a user wants to book a vaccination appointment.
Regression problems are prevalent in machine learning, and regression analysis is the most often used technique for solving them. It is based on data modelling and entails determining the best fit line that passes through all data points with the shortest distance possible between the line and each data point. While there are other techniques for regression analysis, linear and logistic regression are the most widely used. Ultimately, the type of regression analysis model we adopt will be determined by the nature of the data.
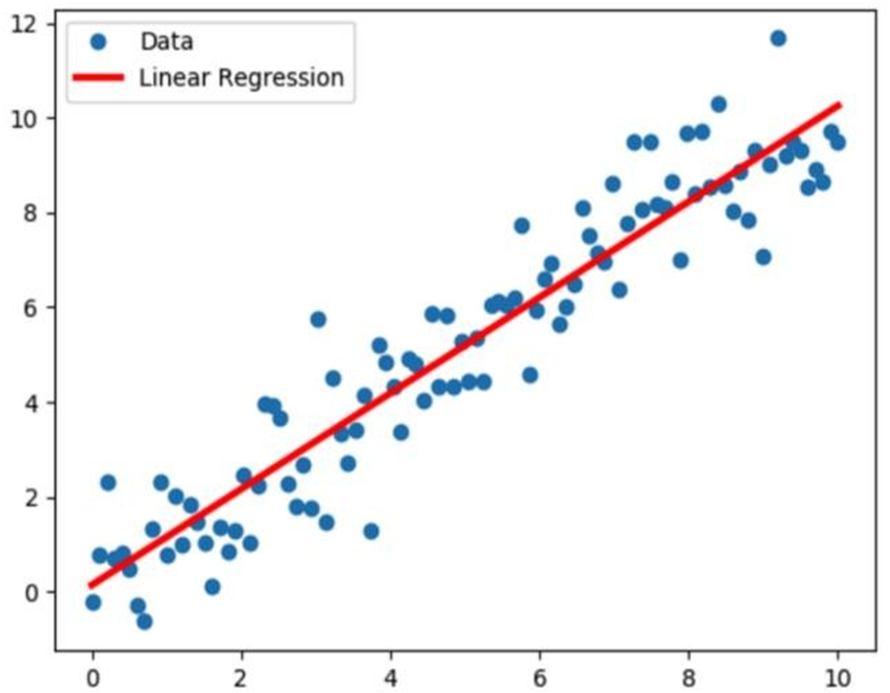
The most extensively used modelling technique is linear regression, which assumes a linear connection between a dependent variable (Y) and an independent variable (X). It employs a regression line, also known as a best fit line. The linear connection is defined as Y = c+m*X + e, where ‘c’ denotes the intercept, ‘m’ denotes the slope of the line, and ‘e’ is the error term.

(IJRASET
ISSN: 2321 9653; IC Value: 45.98; SJ Impact Factor: 7.538 Volume 10 Issue IX Sep 2022 Available at www.ijraset.com
Figure 1 shows the implementation of linear regression over a range of sample data.
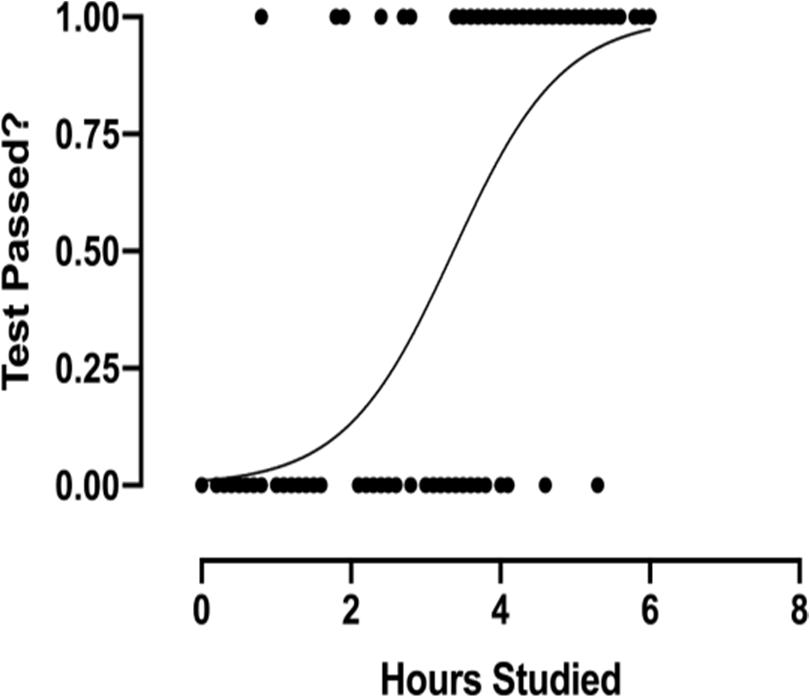
When the dependent variable is discrete, the logistic regression technique is applicable. In other words, this technique is used to compute the probability of mutually exclusive occurrences such as pass/fail, true/false, 0/1, and so forth. Thus, the target variable can take on only one of two values, and a sigmoid curve represents its connection to the independent variable, and probability has a value between 0 and 1.
Figure 2 shows the implemented line for logistic regression over a sample data.
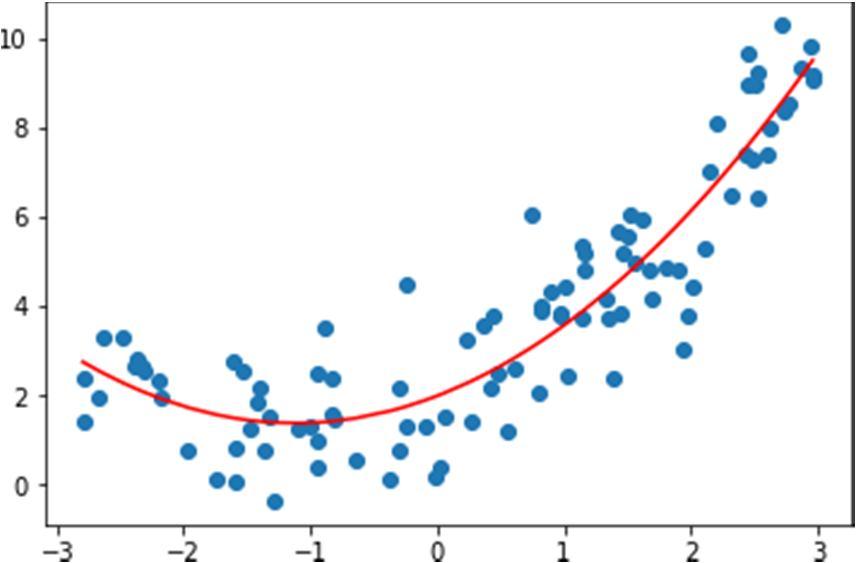
The technique of polynomial regression analysis is used to represent a non linear relationship between dependent and independent variables. It is a variant of the multiple linear regression model, except that the best fit line is curved rather than straight.
Figure 3 Shows the implementation of the polynomial regression over the range of a sample data.
International Journal for Research in Applied Science & Engineering Technology (IJRASET)
ISSN: 2321 9653; IC Value: 45.98; SJ Impact Factor: 7.538 Volume 10 Issue IX Sep 2022 Available at www.ijraset.com
A. U. Mandayam, R. A.C, S. Siddesha and S. K. Niranjan, "Prediction of Covid 19 pandemic based on Regression," 2020 Fifth International Conference on Research in Computational Intelligence and Communication Networks (ICRCICN)[1] have proposed carrying out contrast and comparing, Linear regression and Support Vector Regression by considering the data for different countries. The project was working of the setup of a comparison between different regression models and determine the best model for the implementation of the predictive analysis of the covid 19 cases. The project was able to observe that the covid cases were increasing linearly over time and due to this the linear regression model proved to be a better fit to themodel.
N. Ayan, S. Chaskar, A. Seetharam, A. Ramesh and A. A. de A. Rocha, "Mobility aware COVID 19 Case Prediction using Cellular Network Logs,"[2] have proposed method on, prediction of cases using Cellular Network logs which differs the method that would be applied on the application given here but the process used is very useful as reference. The study used here was carried out on the parameters of RMSE and MAE metrics which determined the amount of spread of the disease.
Y. Bai, "Epidemic Case Prediction of COVID 19: Using Regression and Deep based Models"[3] proposed a method where the use of regression and deep learning based models for the process of deciphering the patterns with the spread of the disease among a people in a given region is presented in this paper. The method proposes the use of the data set collected form the sources like coivd19india.org and covidindia/odisha. The daily data used here was useful in analyzing the trends of the data and helps in the prediction of the cases.
V. K. Gupta, A. Gupta, D. Kumar and A. Sardana, "Prediction of COVID 19 confirmed, death, and cured cases in India using random forest model,”[4] have proposed method on the use of random forest models in the prediction of the covid 19 cases. In this paper, they present an efficient method of prediction of data obtain ed from the sources of Kaggle where the technique of random forest was able to outperform some of the standard methods used in machine learning.
The data represent, the daily data collected over a region, over different countries The details about the covid cases with the vaccinated data should be displayed in a highly user friendly interface. A user friendly dashboard would help the user get details for the vaccination status, cases counter and prediction of cases in the near future Many Features such vaccination alerts, appointment booking, appointment status, cases predictor etc. would be implemented to provide a sound one stop application for all related details. The cases predictor feature help to provide the possibility statistics of the cases in India, use machine learning algorithms which take in account of the past cases and provide a naïve prediction.
The vaccination appointment management system involves providing the user to book vaccination appointments. The user can search any center as required and can book appointment at the required time. The system can also issue alerts to the user for the preferred location. This also includes the issue of the certificate after vaccination. The user can download the certificate and track the appointments as per the scheduled time.
on which many graphs
covid Cases rate with predicted value.
the
which are;
ISSN: 2321 9653; IC Value: 45.98; SJ Impact Factor: 7.538
10 Issue IX Sep 2022 Available at www.ijraset.com
information for the user. The number of services
this
are.
system mainly covers the user management system (Admin) where the user can view the appointments taken, alerts set, profile
vaccination status, certificate information. The system mainly helps the user to verify the details provided during registration and allow the user to activate and deactivate
alerts present for vaccination for the user.
Applications Advantage Disadvantage Tabaud (Kingdom of Saudi Arabia)
Provides two languages, Arabic and English.
It maintains user’s privacy by not requiring personal information. Available in both Android andiPhone Operating System (iOS).
Users of the application volunteer to report that they areinfected. It is not available for the previous versions of iOS (prior to 13.5).
Alhosn UAE (United Arab Emirates)
Data are stored on the user’s mobile. User needs to enter their Emirates ID and mobile number.
SwissCOVID (Switzerland) Itmaintains user’s privacy. Can exchange the random IDs with compatible apps from other countries, but it is not possible to receive notifications via these apps.
cowin Registration for Bug issues vaccine and database inconsistency. No provision to delete the appointment
Covid 19 information It shows predicted cases Database inconsistency management are presented on and services the dashboard in a app linear graph.
Book, view, verify and cancel vaccination appointments.
International Journal for Research in Applied Science & Engineering Technology (IJRASET)
ISSN: 2321 9653; IC Value: 45.98; SJ Impact Factor: 7.538
Volume 10 Issue IX Sep 2022 Available at www.ijraset.com
A novel coronavirus (SARS CoV 2) is an unusual viral pneumonia in patients, first found in late December 2019 , latter it declared a pandemic by World Health Organizations because of its fatal effects on public health. In this present, cases of COVID 19 pandemic are exponentially increasing day by day in the whole world. When it comes to the prediction of cases here, we are detecting the COVID 19 cases, i.e., confirmed, death, and cured cases in India with the help of the model based on various different countries.
The COVID 19 is highly transmissible viral infection and has severe impact on global health. To overcome it many vaccines were introduced but the distribution and handling of such information has become necessary to provide a user friendly interface for the layman in India. The project attempts to address such a problem. Covid information and Vaccination management system is very much demanded application considering the brewing concerns over the past few days. Providing a robust and one stop solution to the end user helps to handle the logistics of the problem much efficiently and make sure the user is able to get the requests addressed fast and securely. The constructed application provides the user a reliable and efficient management system which helps to provide ease in logistics and maintenance of the vaccination services in India.
[1] U. Mandayam, R. A.C, S. Siddesha and S. K. Niranjan, "Prediction of Covid 19 pandemic based on Regression," 2020 Fifth International Conference on Research in Computational Intelligence and Communication Networks (ICRCICN), 2020, pp. 1 5.
[2] N. Ayan, S. Chaskar, A. Seetharam, A. Ramesh and A. de A. Rocha, "Mobility aware COVID 19 Case Prediction using Cellular Network Logs," 2021 IEEE 46th Conference on Local Computer Networks(LCN), 2021,pp. 479 486, doi: 10.1109/LCN52139.2021.9525023.
[3] Y. Bai, "Epidemic Case Prediction of COVID 19: Using Regression and Deep based Models," 2020 2nd International Conference on Machine Learning, Big Data and Business Intelligence (MLBDBI), 2020, pp. 40 45,doi: 10.1109/MLBDBI51377.2020.00015.
[4] V. K. Gupta, A. Gupta, D. Kumar and A. Sardana, "Prediction of COVID 19 confirmed, death, and cured cases in India using random forest model," in Big Data Mining and Analytics, vol. 4, no. 2, pp. 116 123, June2021, doi: 10.26599/BDMA.2020.9020016.
[5] E. Dong, H. Du, L. Gardner An interactive web based dashboard to track COVID 19in real time Lancet Infect Dis (2020),10.1016/S1473 3099(20)30120 1.
[6] World Health Organization, Coronavirus disease (COVID 19) pandemic. https://www.who.int/emergencies/diseases/novel coronavirus 2019/, 2020. (Accessed 29September 2020).
[7] Understanding data visualization of covid 19 https://ieeexplore.ieee.org/document/9404700/authors#au thors
[8] Online dashboard and data analysis https://www.researchgate.net/publication/342011335_Onl ine_dashboard_and_data_analysis_approach_for_assessin g_COVID 19_case_and_death_data.
[9] Covid 19 pandemic in India https://covid19.who.int/ https://en.wikipedia.org/wiki/COVID 19_pandemic_in_India
[10] Worldometers of coronavirus tohttps://www.worldometers.info/coronavirus/