
10 XI November 2022 https://doi.org/10.22214/ijraset.2022.47232
ISSN: 2321 9653; IC Value: 45.98; SJ Impact Factor: 7.538

Volume 10 Issue XI Nov 2022 Available at www.ijraset.com

ISSN: 2321 9653; IC Value: 45.98; SJ Impact Factor: 7.538
Volume 10 Issue XI Nov 2022 Available at www.ijraset.com
Urmila S1 , Dr Rudraswamy S B2
1, 2Department of ECE, JSS Science and Technology University, Mysore
Abstract: It became clear that humanity must learn to live with and adapt to any pandemic such has Covid - 19 , especially in light of the fact that the vaccines currently in developmentdo not prevent the infection but only lessen the intensity of the symptoms. It is crucial to diagnose both pneumonia and COVID 19 since they both have an impact on the lungs. In this study, the automatic detection of the Coronavirus disease was carried out using a data-set of X-ray pictures from patients with common bacterial pneumonia, confirmed Covid 19 disease, and normal occurrences.The current approach for detection and diagnosis of COVID 19 is the RT PCR and rapid test as known rapidtest is not so effective and RT PCR is time consuming and, in lots of instances, no longer less expensive as a consequence the development of new low-price rapid tests of diagnostic gear to aid medical evaluation is needed. The study’s objective is to assess the effectiveness of cutting edge convolutional neural network designs for medical picture categorization that have been recently suggested. In particular, the Transfer Learning method was utilised. Transfer learning makes it possible to detect many problems in small collectionsof medical image data, frequently with outstanding outcomes. The data sets used in this investigation are a collection of 5144 X ray images, including 460 images with verified Covid 19 illness,3418 photos with confirmed common bacterial pneumonia, and 1266 images of healthy conditions. The information was gatheredfrom X-ray pictures that were accessible in public medical repositories. According to the data, Deep Learning combined with X ray imaging may be able to identify important biomarkers for the Covid 19 disease. CNN achieved the highest accuracy99.49% and specificity, followed by VGG 16 at 67.19% and densenet at 91.94

Index Terms: covid - 19,Pneumonia,CNN,VGG - 16,Densenet,Accuracy
Although COVID 19 is an acutely resolving illness, it has the potential to be fatal. Due to extensive alveolar damageand developing respiratory failure, severe illness may cause death when it first manifests . Countries may benefit fromthe early and automatic diagnosis of Covid 19 for the timely referral of the patient to quarantine and the quick incubationof dangerous cases.In specialised hospitals, and the disease’s spread is tracked. Although the diagnosis procedure has be come reasonably quick, the financial problems brought on by the expense concerns both states and patients, particularly in nations, regarding diagnostic examinations. The X rays from healthy instances are now more frequently available to the public than they were in 2020, although additionally from individuals who have Covid 19. As a result, we can examine the medical photographs and recognise any patterns that couldresult in the condition being automatically diagnosed. Pneumonia is a condition when the lungs’ air sacs fill with fluid, causing inflammation in the lungs as a result. This leads to other problems like chills, weariness, and fever aswell as breathing difficulties, coughing, and chest pain. The common cold and the flu are both causes of pneumonia. However, bacterial infections and viral infections can also be problematic at times. This is the cause; one of the factors citedas contributing to pneumonia is COVID 19.
The distinction between COVID 19 infected pneumonia and regular pneumonia has recently been the subject of numerous investigations and experiments conducted in laboratories by medical professionals. In order to illustrate how both have some significant differences, IDSA has developed a thorough knowledge using CT scan images and other sources. Therefore,it is essential to diagnose Pneumonia and COVID.
Deep learning applications seem to have emerged through out the last five years at the perfect time. Automatically identifying features in photographs and classifying them is a major focus of the ”Deep Learning” class of machine learning techniques. Its main applications are in tasks involving the classification of medical images and item identification. Whenit comes to using artificial intelligence to mine, analyse, and uncover patterns in data, deep learning and machine learning are well established fields of research. The contributions madeby those disciplines to clinical decision making and computer aided systems are getting harder to recapture as new databecome accessible.
ISSN: 2321 9653; IC Value: 45.98; SJ Impact Factor: 7.538
Volume 10 Issue XI Nov 2022 Available at www.ijraset.com
Deep neural networks, also known as deep learning, are artificial neural networks (ANN) with several layers. Due to its capacity to manage massive volumes of data, it has emerged during the last few decades as one of the most effective tools and has seen significant literary success. In a number of applications, including pattern recognition, deeper hidden layers are already beginning to perform better than conventional methods. One of the most popular deep neu ral networks is the convolutional neural network (CNN). Convolutional Neural Networks have made groundbreaking discoveries over the past 10 years in a variety of pattern recognition related fields, including speech recognition andpicture processing. The reduction of ANN’s parameter count is CNNs’ most advantageous feature. The most crucial premise regarding issues that CNN solves is that theyshouldn’t includefeatures that are spatially dependent. This is because larger models may be used to handle sophisticated tasks that werenot conceivable with classic ANNs.In other words, we don’t need to focus on where the faces are in the photographs while using a face detection tool, for instance. The only thing that matters is finding them, regardless of where they are in the provided photographs. Obtaining abstract characteristics wheninput propagates toward the deeper layers is another crucial component of CNN.
The author investigated a number of well known pretrained deep CNN models in a transfer learning setup. For the purposeof identifying COVID 19 from chest X ray images.Different setups were tested using the two separate publically accessibledatasets either alone or jointly. Different setups were tested using the two different publically accessible datasets either alone or together. Limitation:The COVID 19 vs. non COVID 19 chest X rayclassification by VGG models was unsuccessful. The COVID 19 vs. non COVID 19 chest X ray classification by VGG models was unsuccessful.(from reference [6])
To assess and contrast the created models, three distinct experiments are conducted in accordance with three prepro cessing approaches. The objective is to assess the effects of data preprocessing on the outcomes and how well they canbe explained. Similar to this, a comprehensive investigationof various variability problems that could potentially ruin the system and its impacts is carried out. The methodology used yields a classification accuracy of 91.5 percent, withan average recall of 87.4 percent for the weakest but most explicable experiment.
Limitation:In this approach, manual methods based on visual observation of the images were used in earlier CT studiesof COVID 19 to test the infection extent evaluation.(fromreference [1]).
A proposed approach for analysing chest X ray pics has been created to come across COVID 19 for binary instructionswith an accuracy of 78 percentage and validation accuracy of 80 percent, wherein the loss is more or less zero.15 percent. This method applies convolution 2D techniques to COVID 19open supply datasets which can be available at GitHub and Kaggle
Limitation:massive dataset working with GPU taking into ac count many more attributes to evaluate for high computationalspeed, performance, and effective deep learning approaches implementation.(from reference [7])
A streaming diagnosis based on a deep learning based retrospective analysis of laboratory data in the form of chest X rays is required in this COVID 19 pendamic situation. In this paper, a method to detect COVID 19 using deep learning to assemble medical images was proposed.
Limitation:For the datasets used to determine if a person is contagious or not, classification techniques must be ap plied.(from reference [2])
The suggested approaches were validated using a dataset that was specifically retrieved for this study. Despite the poor quality of the chest X ray images that are a drawbackof portable equipment, the proposed approaches produced global accuracy values of 79.62 percent, 80.27 percent, and 79.86 percent, respectively. This allowed a reliable analysis ofportable radiographs to support clinical decision making. Limitation: Although the decision making accuracy is lower, the results show that the proposed technique and the tested ap proaches permit a robust and reliable analysis.(from reference[3])
In this article, CNNs are briefly introduced, along withrecently released papers and innovative methods for creating these amazingly outstanding image recognition models. The introduction makes the assumption that you are already famil iar with the basics of ANNs and machine learning.
Limitation:In contrast to other artificial neural network types, convolutional neural networks concentrate on a specific type of input rather than the entire problem domain.(from reference[5])
Textual clinical reports were divided into four categories in this study using conventional and ensemble machine learning techniques. These features were applied to conventional and group machine learning classifiers.
Limitation:By adding more data, models’ effectiveness can beincreased. In order to determine whether men or women are more likely to contract the disease, it can be categorised basedon gender. Deep learning approaches can be applied in the future, but more feature engineering is required for improved outcomes. [4])
ISSN: 2321 9653; IC Value: 45.98; SJ Impact Factor: 7.538 Volume 10 Issue XI Nov 2022 Available at www.ijraset.com
In this study, the author present a unique Support Vector Regression approach to analyse five distinct tasks associated with novel coronaviruses. To improve classification accuracy in this work, supported vectors are also used in place of a simple regression line. Limitation:The encouraging outcomes show its inferior superi ority in terms of both efficiency and accuracy..(from reference[8])
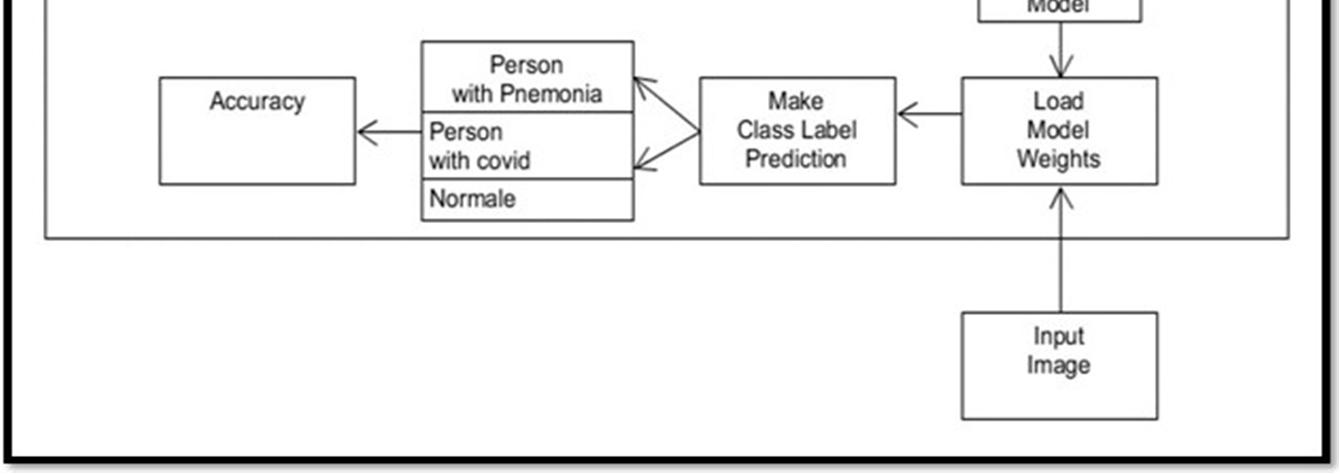
Fig. 1: Proposed Block Diagram
The process of gathering and coordinating information froman unlimited number of various sources is known as datacollection. In order to process the data after the statistics have been collected, the information is recorded as an image (chest x ray). A dataset in machine learning is, to put it simply, a collection of data samples that can be analysedand forecasted by a computer as a single entity. This implies that the data gathered should be uniform and understandable because machines don’t perceive data in the same manner thatpeople do. A good dataset should also adhere to strict quality and quantitystandards. The dataset should also be relevant andevenly distributed for a rapid and simple training procedure. For our work, we created three classes of chest X ray image datasets (normal people, pneumonia patient, and COVID 19 Patients).
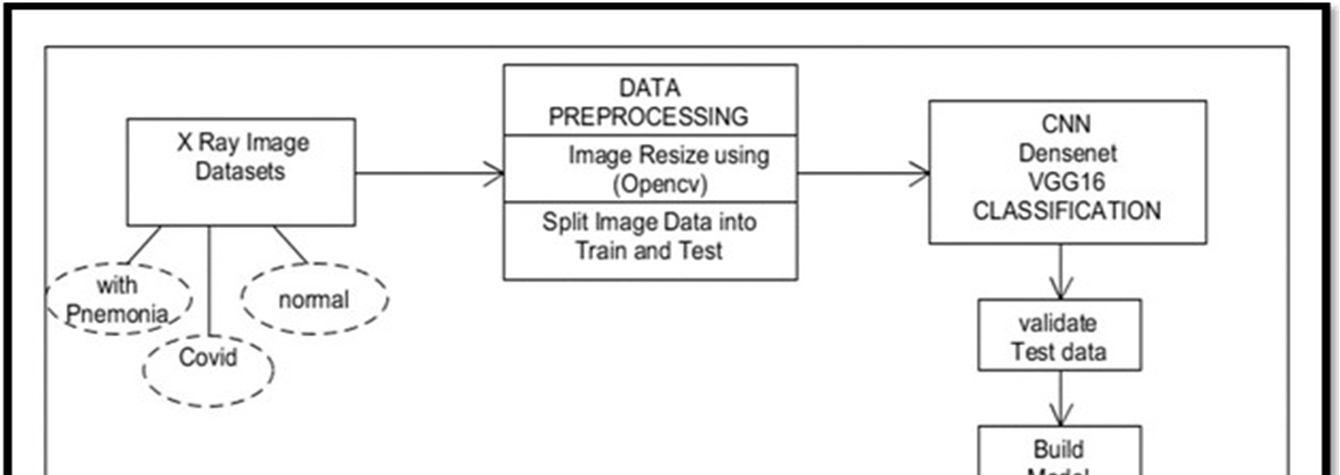
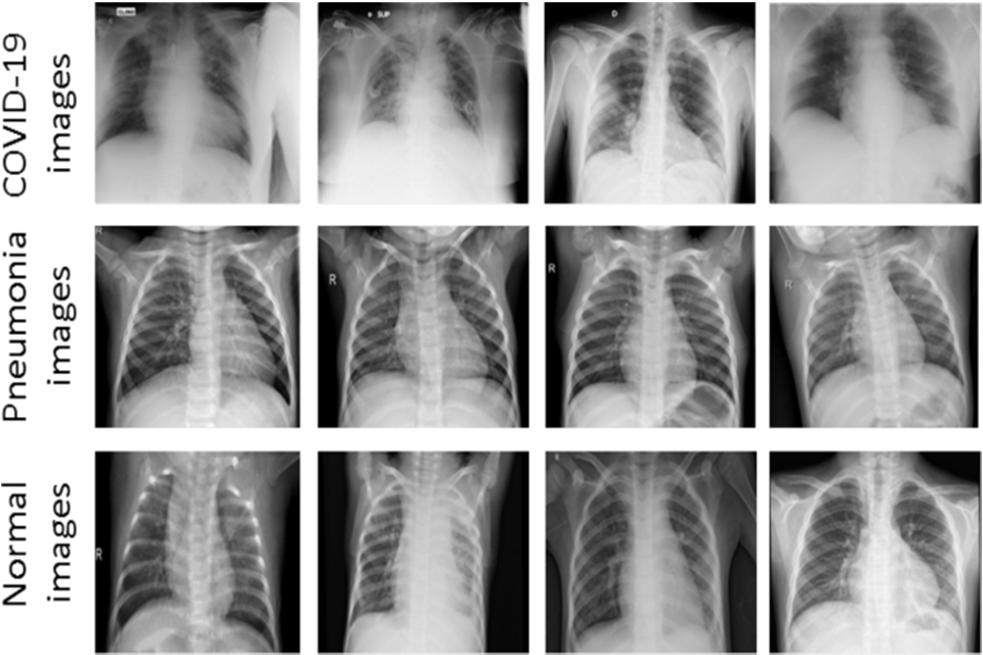
It has 5144 total images, of which 460 are covid 19, 1266 are images of people who are healthy or normal, and 3418 are images of people who have pneumonia. Covid 19 isa recent infection, thus there aren’t many pictures of it. The data set is obtained from the Kaggle website and divided into two portions: 20% for validation and 80% for training.
ISSN: 2321 9653; IC Value: 45.98; SJ Impact Factor: 7.538
Volume 10 Issue XI Nov 2022 Available at www.ijraset.com
Preprocessing is a data mining technique used to transform raw data into a format that is appropriate and useful. The actions needed for data preprocessing are:
1) Data Cleaning: The data may contain many irrelevant and missing pieces. Data cleaning is done in order to control this portion. It involves handling noisy, missing, and other types of data.
2) Data Transformation: This procedure is used to turn the data into forms that are suitable for the data mining process. It involves the following actions:
a) Normalization: To get the values of the data in the specified range, normalisation is done.
b) Attribute Selection:The set of already provided at tributes is used to construct entirely new attributes.
c) Discretization: Restoring the raw values of numeri cal properties at interval levels is done..
d) Concept Hierarchy Generation: Based on hierarchy,the qualities are changed from a low level to a high level.
3) Data Reduction: Since managing large amounts of data requires a certain approach, data mining. It was chal lenging to assess in these situations while working witha significant amount of data. So we used a data reduc tion strategy to get away from this. Reduced expenses and increased storage efficiency were the goals of the reduction.
In order to evaluate how well the machine learning algo rithm is working, data is split into training and testing sets.
1) Train Data set: treated to bring relevance to the model.
2) Test Data set: treated to assess the relevant model.
The major goal is to assess the model’s performance usingthe most recent data, i.e., data that were not utilised in the model’s training. When there are several data sets gathered,the train test methodology is appropriate.
The size of the training and testing data sets is a crucial configuration constant for the course of action. For either the training or testing data sets, it is often shown as a percentage between 0 and 1. For instance, if the size of the training setis 0.60 (60 percent), the testing set will receive the remaining 0.40 (40 percent). For dividing data sets, there is no ideal split %. Taking into account the needs of our project, we choose a percentage to divide the data sets by.
3) Cost of computation for training a model
4) Computed costs for model evaluation
5) Representation of the training set’s behaviour
6) Behaviour of the testing set’s representation
We took into account the aforementioned elements when choosing the percentage to divide the data into training and testing sets for this project. We used the Python machine learning toolkit scikit learn, which provides a training and testing split assessment application. The ”test size” option, which accepts an input of the number of rows or a percentage of the size of the data set between 0 and 1, can be used todescribe the split size.
The deep learning algorithm is a method for the systemof AI capabilities to carry out the activities, typically by anticipating the values as output from previouslyprovided dataas input. The important actions of algorithms of deep learning isimage classification.
Transfer learning is a method that trains a CNN from startto perform a different but related job using new data, often from a smaller population. Transfer learning makes advantageof the data mining knowledge produced by a CNN. In this deep learning process, a CNN is first trained using big datasets for a particular objective (like classification). The availability of data for the first training is the most crucial component for training to be successful since CNN may dis cover critical properties (features) of the image. The suitabilityof this model for transfer learning depends on the CNN’scapacity to recognise and extract the most exceptional visual characteristics. The processing of a brand new collection of images of a different kind and the use of the CNN to extract features based on its experience with feature extraction since its first training constitute the following phase.
ISSN: 2321 9653; IC Value: 45.98; SJ Impact Factor: 7.538 Volume 10 Issue XI Nov 2022 Available at www.ijraset.com
Convolutional neural network (CNN) techniques are typi cally applied to designs with a large number of training layers.Weights and bias are the two factors for every layer. Later layers search for mid level and high level features such as structures, objects, and shapes, while earlier layers concentrateon low level features like corners, edges, and lines. Usingthe prediction result, it is then possible to calculate the loss cost to the ground truth labels. In order to compute eachparameter’s gradient based on the loss cost, the backwardstage secondly uses chain rules. For the future gradient based forward computation, every parameter has been updated and prepared. Following several cycles in both the forward and backward stages, network learning might come to an end.
It would be advantageous to define the term since it isfrequently used to refer to mathematical notions and ideas connected to the feature transformation strategy and procedure.One of the starting functions in mathematics, most notably algebraic topology, is turned into a third function by the mathematical procedure known as convolution. This third function is frequently viewed as a transformed version of the two initial functions in mathematics, u and v. The convolutionis a distinct function that is frequently represented by theletters u and vand discussed by(Hirschman and Widder, 2017)in the context of two real or complex functions, u and v. (uvx)() = tvt(dt)() (1)
The layer is known as Rectified Linear Units. This layerof neurons employs the loss function or non saturating non linearity function: f ( x ) = max ( 0,x )

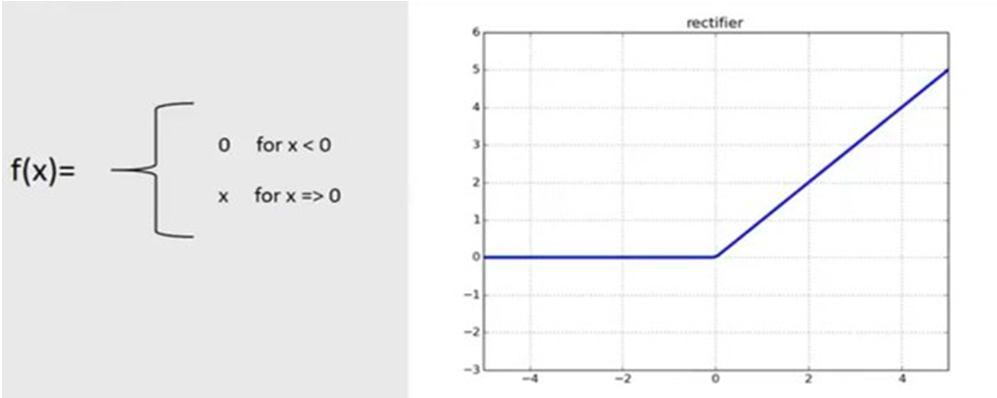
Rectified Linear Unit (ReLU) transform functions only turnon a node if the input value exceeds a specific threshold. Whenthe information rises above a threshold, the output changes from zero while the data is below zero. It and the dependent variable are related linearly.
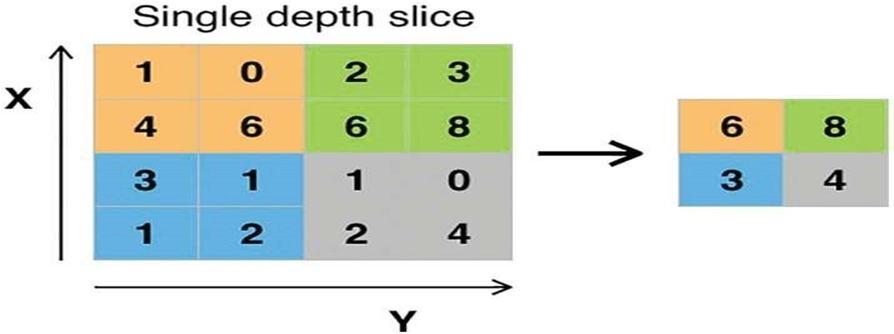
1) Pooling Layer: Condensing or reducing the spatial di mensions of feature map derived data is its mission. The most common type of pooling is maximum pooling because of its enhanced convergence and speed. Average pooling and L2 norm pooling are the other two types (Scherer et al., 2010).In essence, this requires a filter, commonly of size 2 x 2, and an equal length stride. With a filter that convolves after being applied to the input volume, it produces the highest number possible in each subregion.
ISSN: 2321 9653; IC Value: 45.98; SJ Impact Factor: 7.538
Volume 10 Issue XI Nov 2022 Available at www.ijraset.com
An input vector of numbers is provided to this layer. The phrase ”fully connected” describes a system in which every input is coupled with every output. In the CNN procedure, it often comes after the final pooling layer. 90% of the CNN’s parameters are located in fully linked layers, which function similarly to a traditional neural network. This layer basically receives the output of the previous pooling layer and createsan N dimensional vector, where N is the total number of classes the computer can choose from. We can use it to feed a vector with a specific length forward into the neural network. Additionally, the result is a vector of numbers. This
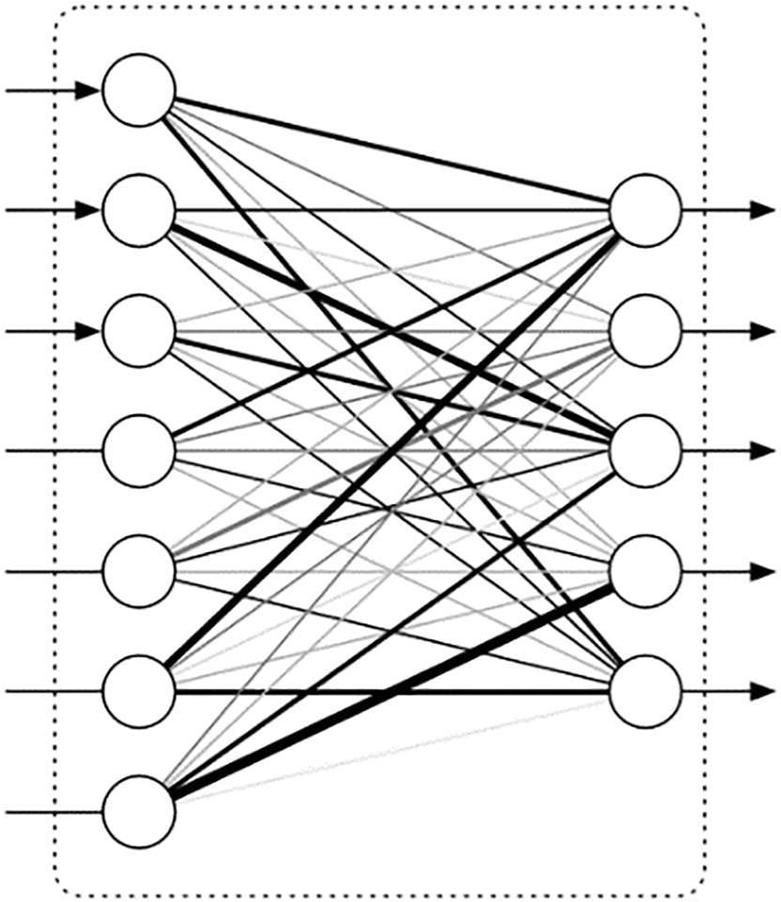
Fig. 6: Fully connected layer simulates higher level reasoning in which all potential routes from the input to the output are taken into account. Afterpassing through two layers of convolution, relu, and pooling, and being converted into a single file or a vector, take the reduced image and place it in the single list.
1) Loss Layer: Loss layer computes a value that represents the model’s performance by using functions that take the model’s output and the target into account. It may serve two primary purposes.:
a) Forward (input, target): based on input and target value, estimates loss value.
b) Backward (input, target): identifies the criterion, calcu lates the gradient of the loss function associated with it, and returns the outcome.
c) In a CNN, the back propagation principle is employedto determine the gradient of the loss function, whichdetermines the cost related to a particular state.
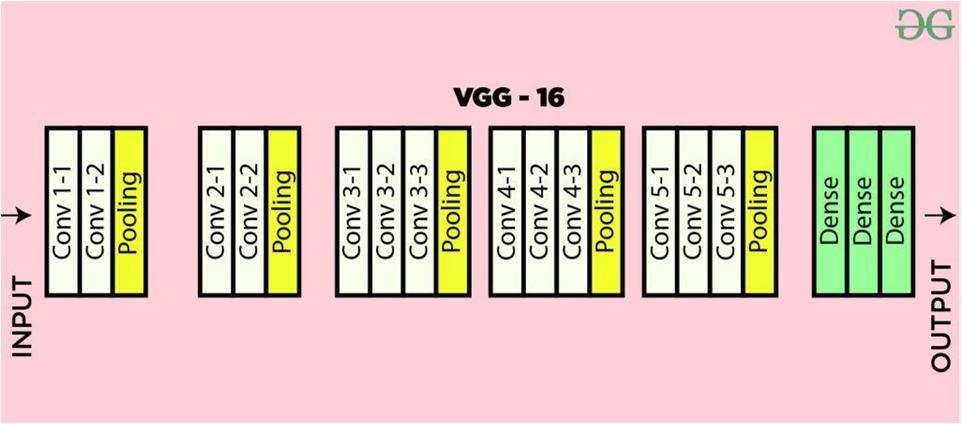
2) VGG 16:
The term ”ConvNets” is frequently used to refer to convo lutional neural networks, a subset of artificial neural networks.Input, output, and multiple hidden layers are the components of a convolutional neural network. One of the most effective computer vision models available right now is the CNN(Convolutional Neural Network) variant known as VGG16.In order to analyse the networks and deepen the model, thedevelopers developed an architecture with incredibly small (3x 3) convolution filters, which was a substantial advance overthe state of the art setups. Around 138 trainable parameterswere created with the depth increased to 16 19 weight layers.An input image with dimensions is sent to the network (224, 224, 3). In the first and second layers, there is the samepadding and 64 channels with a 3*3 filter size. Following astride (2, 2) max pool layer, two layers have convolution layerswith a 128 filter size and a filter size (3, 3). Max pooling stride(2, 2) layer with the exact same properties as the layer before follows. Then, 256 filters are spread out over 2 convolutionlayers with 3 and 3 filter widths.
ISSN: 2321 9653; IC Value: 45.98; SJ Impact Factor: 7.538 Volume 10 Issue XI Nov 2022 Available at www.ijraset.com
A max pool layer comesnext, then two sets of three convolution layers. With the samespacing and 512 filters per filter (3, 3). Then, this image issubjected to the stack of two convolution layers. We employ3*3 filters in these convolution and max pooling layers asopposed to 7*7, ZF 11*11, and AlexNet filters. Additionally,several of the layers change the number of input channels by using 1*1 pixels. A 1 pixel padding is offered after each convolution layer to prevent the spatial characteristic of the image
As Convolution and max pooling layers were added to the stack, and the result was a (7, 7, 512) feature map. A feature vector with the value 1, 25088 is produced by flattening this result. There are then three fully connected layers: the first layer uses the most recent feature vector as input and outputsa vector with a size of (1, 4096); the second layer also doesso; the third layer, however, also produces a vector with a sizeof (1, 1000), which is used to implement the softmax function to divide the data into 1000 categories. Every hidden layer hasa ReLU activation function. ReLU is more efficient since it encourages faster learning and reduces the possibility of error.
One of the most recent advancements in neural networksfor visual object detection is called DenseNet. Despite their apparent closeness, ResNet and DenseNet have some impor tant differences. While DenseNet uses an additive approach tocombine the previous and subsequent levels, ResNet concate nates the layers.
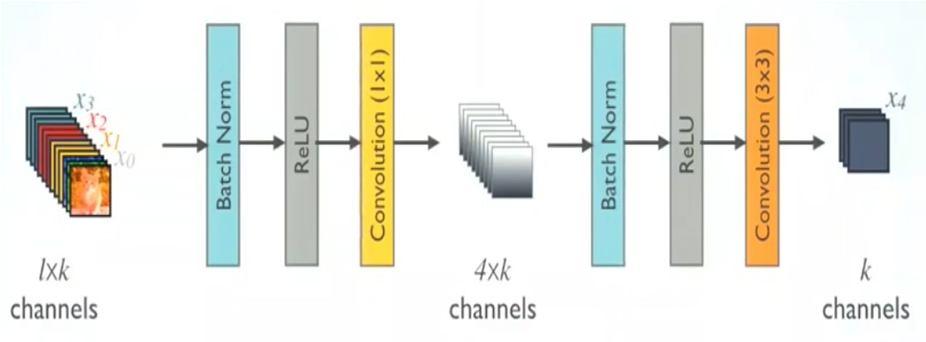
Composition Layer Pre Activation For each composition layer that produces feature maps with k channels, Batch Norm (BN), ReLU, and 33 Conv are executed. For instance, X0, X1,X2, and X3 may all be altered to X4. The concept for this was generated by Pre Activation ResNet.
To reduce the model complexity and size, BN ReLU 1×1 Conv is done before BN ReLU 3×3 Conv.
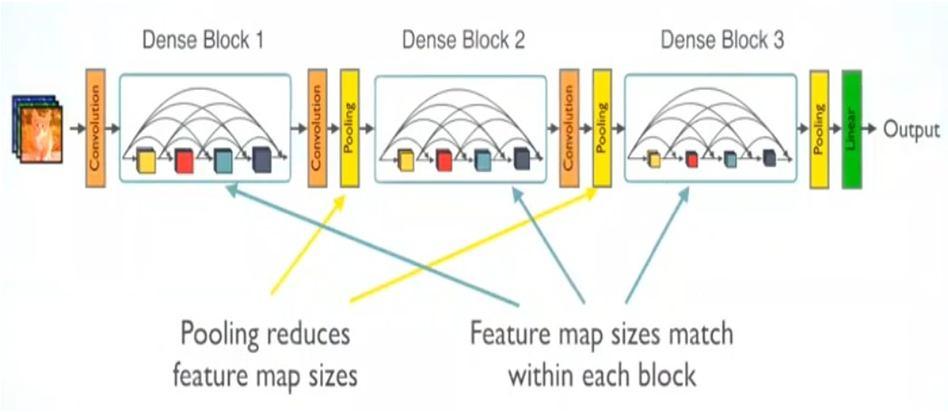
Fig. 9: Multiple Dense Blocks with Transition Layers
ISSN: 2321 9653; IC Value: 45.98; SJ Impact Factor: 7.538 Volume 10 Issue XI Nov 2022 Available at www.ijraset.com
1) Multiple Dense Blocks with Transition Layers: Multiple Dense Blocks In addition to2 x 2 common pooling, 1 x 1 Convis used as the transition layers between neighbouring dense blocks. The dense block has a set of feature maps, each of which is the same size, making it easy to concatenate them. It is easy to concatenate the dense block’s feature maps together due to their similar sizes. Upon completion of global average pooling at the end of the last dense block, a softmax classifier is linked.
The transition layer produces m output feature maps, with 01 being the compression factor, if there are m feature mapsin a dense block. On each transition level when =1, a fixed number of feature maps are present. DenseNet C, also known as DenseNet, had a value of 1 and was equal to 0.5 throughoutthe trial. When the bottleneck layer and the transition layer with 1 are both used, the model is referred as as DenseNet BC. Currently, DenseNets with/without B/C, various L layers,and various k growth rates are also being trained.
The result of the algorithm, which shows if a specific illnessas covid 19 or pnemonia can be predicted based on the data sets, has been trained on a genuine data set and reinforced to recent data.
The study used to show which machine learning algorithm’smodel is best at identifying connections and patterns between different variables in data sets is known as themodel accuracy.
It is a 2x2 binary classification matrix with real values on one axis and predicted values on the other. we introduce two concepts: false positives and false negatives.
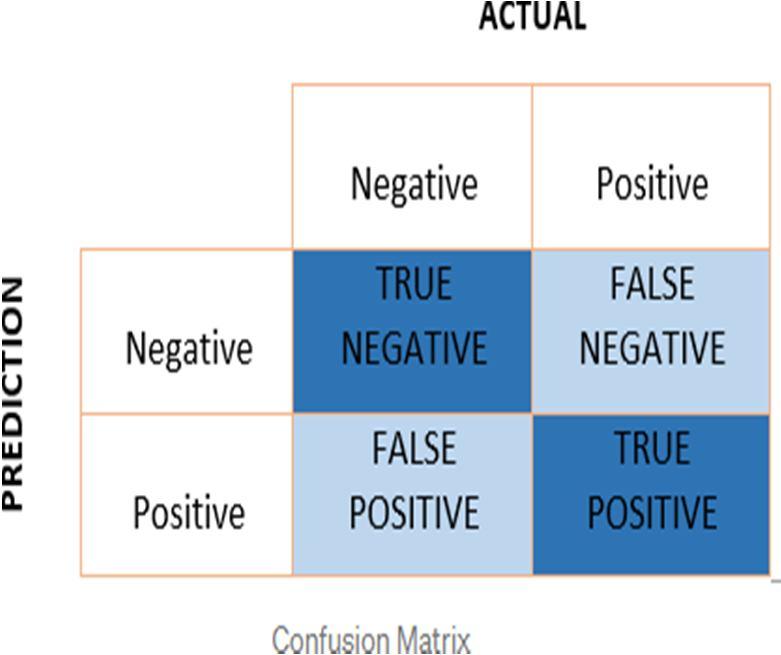
1) True Positive (TP) model successfully predicts the positive class (prediction and actual both are positive).
2) True Negative (TN) model predicts the negative class accurately (prediction and actual both are negative).
3) False Positive (FP) incorrect prediction of the negativeclass is made by the model. (predicted positive, actual negative).
4) False Negative (FN) Model predicts the positive class inaccurately. (predicted negative, actual positive).
ISSN: 2321 9653; IC Value: 45.98; SJ Impact Factor: 7.538 Volume 10 Issue XI Nov 2022 Available at www.ijraset.com
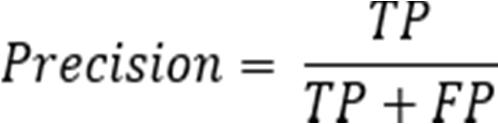
a) Precision: The precision ratio is the sum of the true positives and false positives. i.e. What proportion of all the positive predictions that are actually positive.
The precision number ranges from 0 to 1.
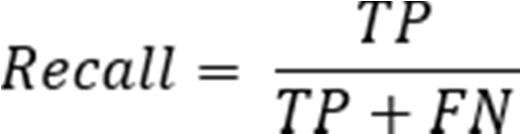
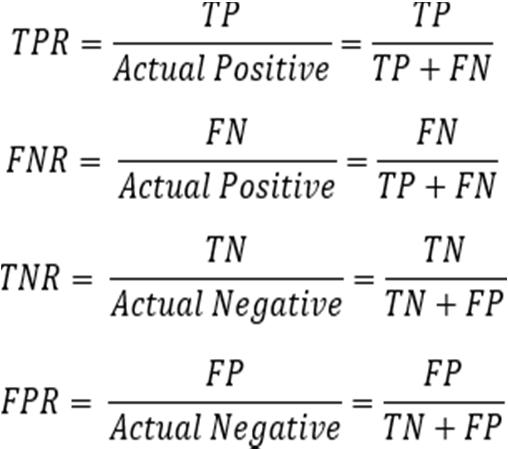
b) Recall: Recall examines the number of erroneous nega tives that were included in the prediction process rather than the number of false positives the model predicted, i.e., what proportion of all positives are anticipated to be positive. It is equivalent to TPR (true positive rate).
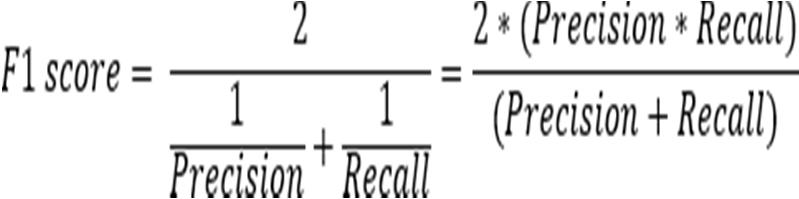
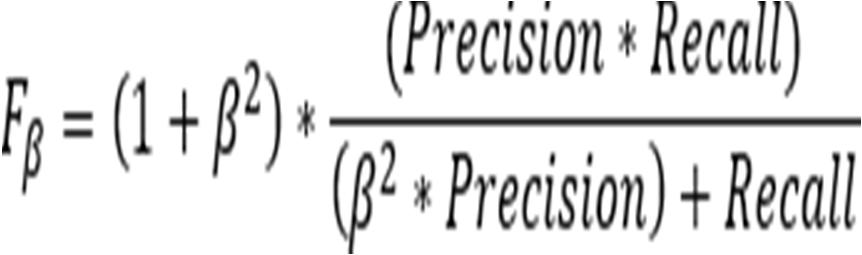
c) F1 Score: It is the precision and recall harmonic mean. It accounts for both false positives and false negatives. Consequently, it works well with an unbalanced dataset.
Recall and precision are given the same weight in the F1 score. We can assign varying weights to recall and precision ina weighted F1 score. Recall and precision are given varying weights in different tasks, as was covered in the preceding section.
Beta measures the frequency with which recall outweighs precision. The value of Beta is 2 if recall matters twice as much as precision.
The results, which were acquired using a variety of algo rithms including CNN, VGG 16, and densenet, are compared, examined, and predicted; theyare then described in moredetailbelow.
We performed the classification of covid 19,Pnemonia in fection utilizing python 3 on jupyter notebook, sklearn modelsand predictions and utilized the CNN algorithms namely CNN,VGG 16,Dense net, and got the accuracy and loss of the models and performed comparison between these algorithms and obtained the below results.
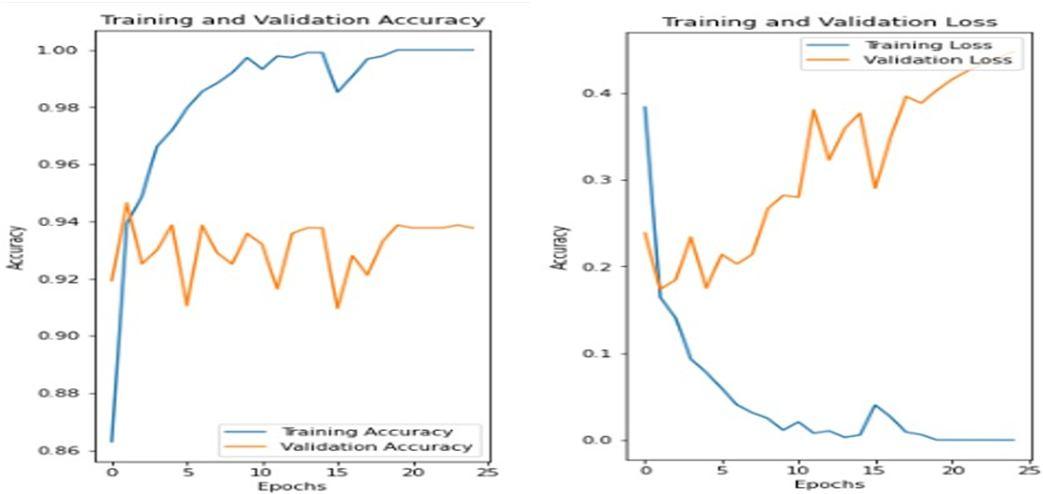
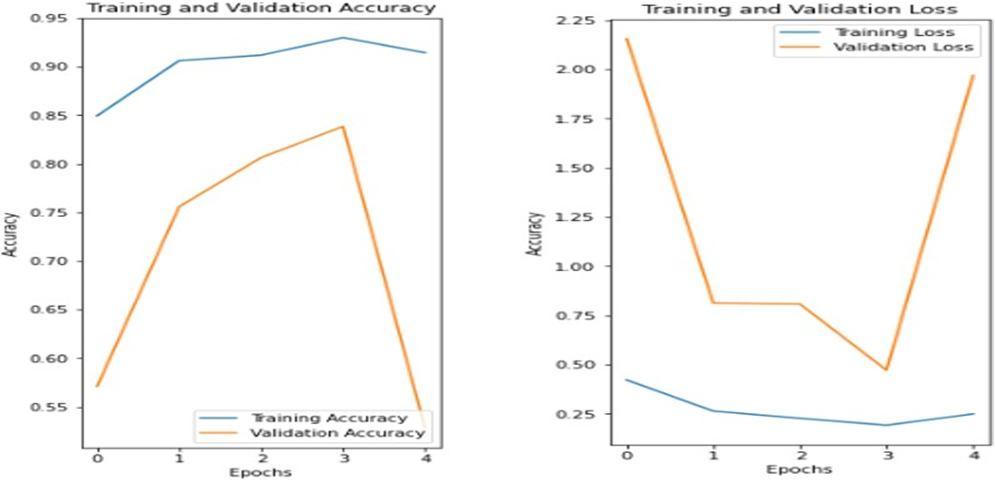
Fig. 11: Graph of Accuracy and Losses for CNN
ISSN: 2321 9653; IC Value: 45.98; SJ Impact Factor: 7.538 Volume 10 Issue XI Nov 2022 Available at www.ijraset.com
The trending graph that shows how training and validation accuracy change with epoch count is shown in the figureabove. The graph suggests that there is a significant increasein training accuracy as soon as the number of epochs rises, based on detailed examination of the data. 32 batches of 25 epochs each are used to train the model. As a result, training across 25 of these epochs produced results that were optimal, with high accuracy of 100% and a minimal loss of 4.0362e 05for training and a similar accuracy of 93.7 % and a loss of 0.44 for validation.
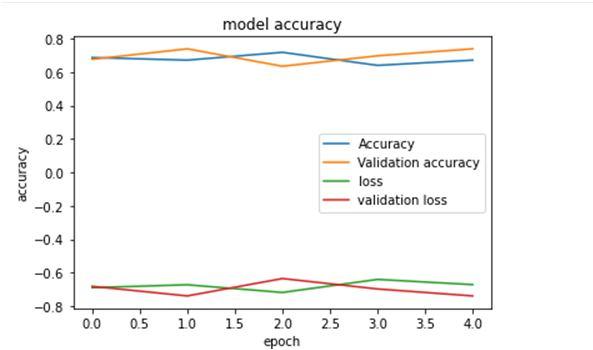
The VGG 16 model was only trained for 5 epochs because it takes much longer time that the training losses and validationlosses both reached negative values, making it clear that the model was overtrained and the over fitting was evident. Conse quently, training for five of these epochs produced results withtraining accuracy of 67% and validation accuracy of 73%.
Due to the lengthy training process, the Densenet modelwas only trained for five epochs. The training phase of the model is conducted across 5 epochs, with a batch size of16 for each epoch, for a total of 100 steps. Consequently, training across 25 of these epochs produced optimum results, with good accuracy of 94 percent and a low loss of 0.22 for training and a similar accuracy of 52 percent and a loss of 1.97 for validation. From the obtained confusion matrix wecan determine performance of the classification models for a given set of test data by calculating the precision,recall andF1 Score values.
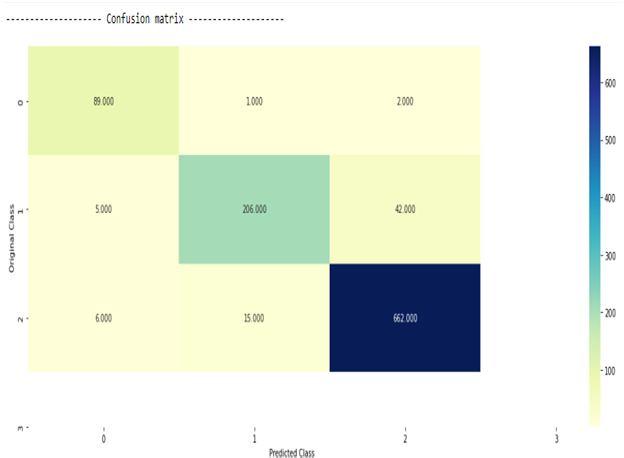
Fig. 14: Confusion Matrix
ISSN: 2321 9653; IC Value: 45.98; SJ Impact Factor: 7.538 Volume 10 Issue XI Nov 2022 Available at www.ijraset.com
TABLE I: Classification Report for Densenet Covid Normal Pneumonia Precision 0.89 0.92 0.93 Recall 0.96 0.81 0.96
F1 Score 0.92 0.86 0.94
The comparison of all three algorithms is provided in the table above so that we can determine which model is idealfor creating web applications. and can also assess how each model behaves.
TABLE II: Training Accuracy
No of epoch CNN VGG 16 Densenet 1 86.30 68.75 84.94 2 93.93 67.19 90.75 3 94.87 71.88 91.44 4 96.62 64 91.75 5 97.96 67 91.06 6 10 99.73 overfitting and longtime longtime 11 25 100 overfitting and longtime longtime
TABLE III: Validation Accuracy
No of epoch CNN VGG 16 Densenet 1 91.93 67.71 57.1 2 94.65 73.96 75.58 3 92.51 63.54 80.64 4 93 69.79 83.85 5 93.87 73.96 52.82 6 10 93.58 overfitting and longtime longtime 11 25 93.77 overfitting and longtime longtime
TABLE IV: Training Losses
No of epoch CNN VGG 16 Densenet 1 38.36 69 42.18 2 16.43 67.28 26.35 3 14.09 71.87 22.07 4 9.3 64.06 19.17 5 7.7 67.19 24.92 6 10 1.14 overfitting and longtime longtime 11 25 4.0362e 05 overfitting and longtime longtime
ISSN: 2321 9653; IC Value: 45.98; SJ Impact Factor: 7.538 Volume 10 Issue XI Nov 2022 Available at www.ijraset.com
TABLE V: Validation Losses
No of epoch CNN VGG 16 Densenet
1 23.86 68.21 71.79 2 17.38 73.96 78.05
3 18.44 63.54 28.04 4 23.39 69.79 42.15
5 17.48 73.96 22.59 6 10 28.18 overfitting and longtime
longtime
longtime 11 25 44.76 overfitting and longtime
From above training and validation accuracy table we observe how the accuracy how accuracy varies for every epoch.we observe that for the first epoch in training accuracy CNN has around 86% and for further the accuracy increases but in VGG 16 its around 60% and for further epochs its around 60% as result of over fitting. Dense accuracy also keeps on increasing for epochs but densenet and VGG 16 whereonly executed for five epochs has its taking loner time.
From above training and validation loss table we can analyze how the losses have reduced for increasing epochs here the CNN exits the very minimal losses(4.0362e 05)hencefrom this comparision its evident that CNN is a best algorithmwhen compared to VGG 16 and Densenet in our study.

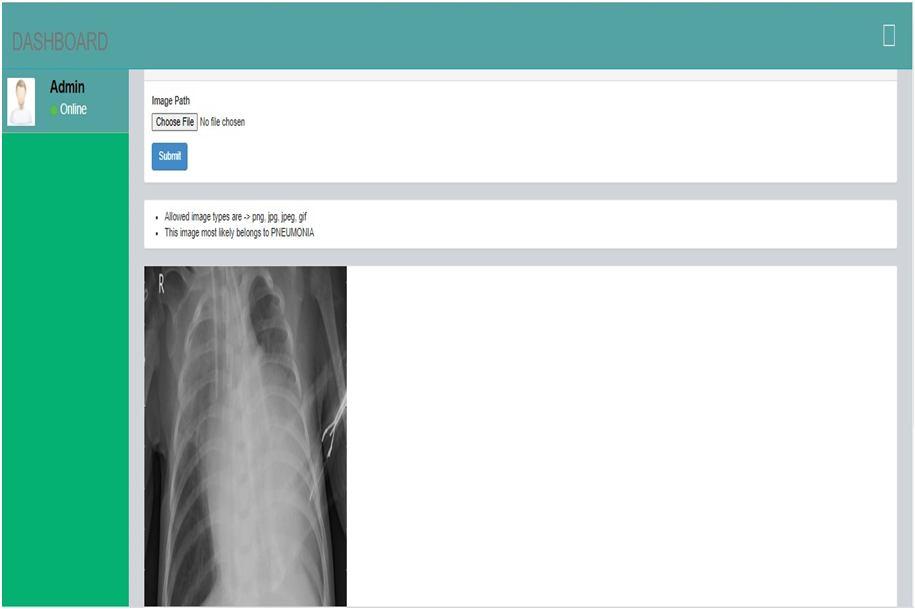
It is clear from the comparison table that the CNN model has good accuracy, which is why a web application was developed for it. The results exhibits how the the developed web application is identifying the X rays belonging to three different classes covid 19 , Pneumonia and normal.
ISSN: 2321 9653; IC Value: 45.98; SJ Impact Factor: 7.538 Volume 10 Issue XI Nov 2022 Available at www.ijraset.com
1) Detection of Covid 19 , Pnuemonia and Healthy chest x ray: Here the X ray images are fed by clicking on choose file in dash board after that we need to select file in which the images are present and upload it once after uploading needto click on submit button once after the submiting image we can observe result whether the given X ray belong to covidor pneumonia or normal.The same procedure is followed for many iteration to check whether develop web application is accurate by feeding different types of X ray images.
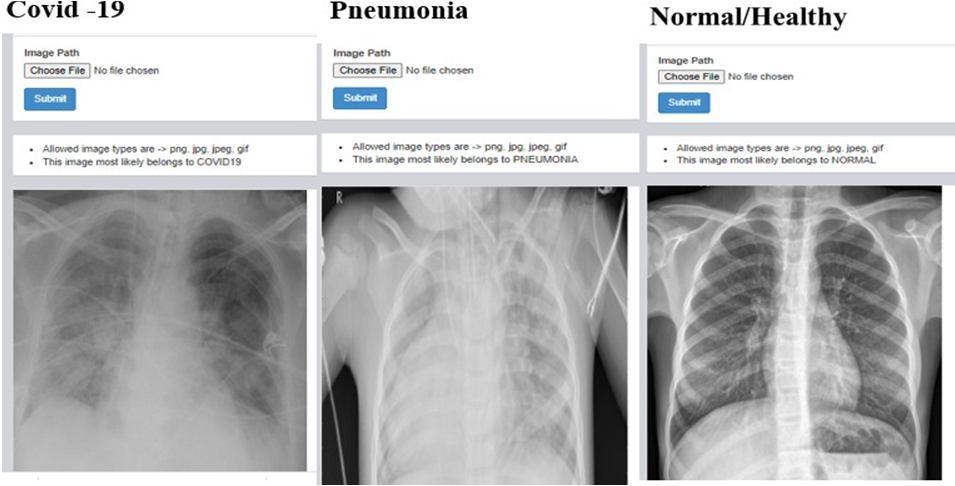
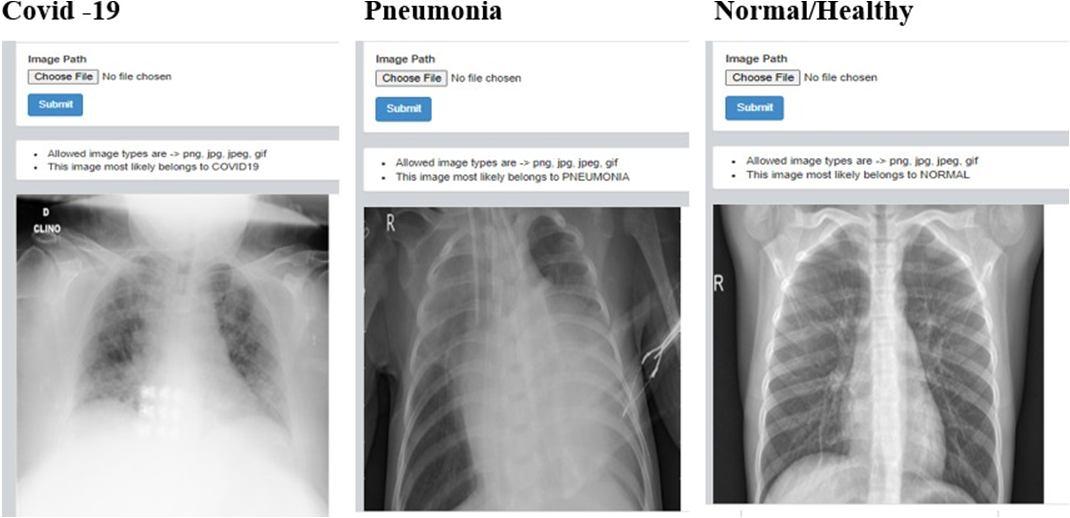
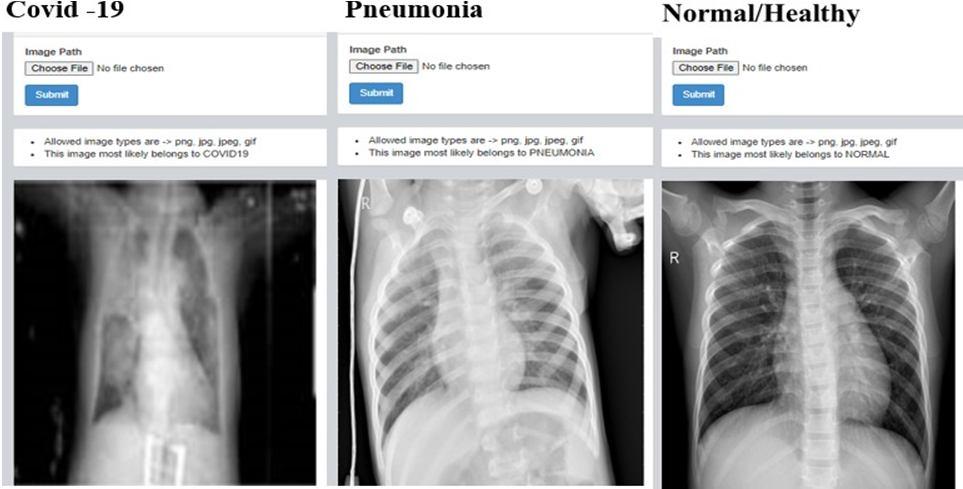
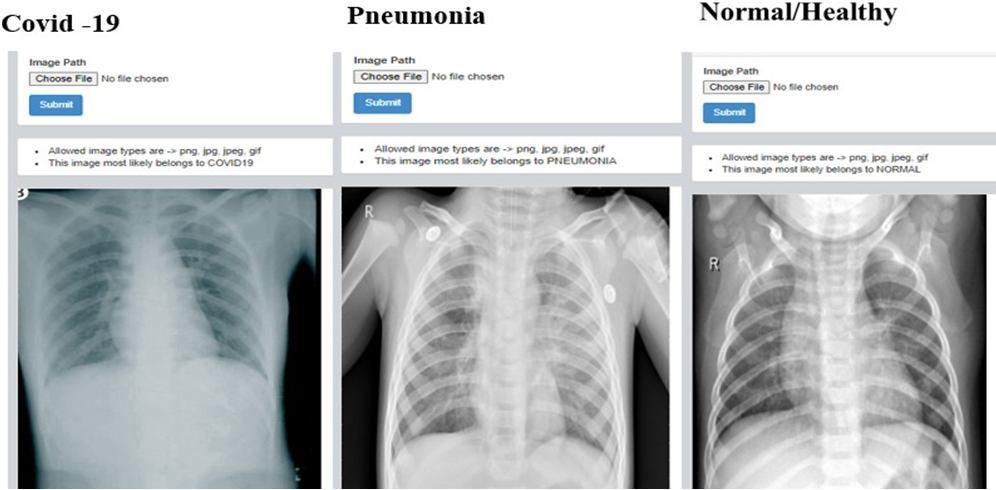
Fig. 17: Iteration 1
Fig. 18: Iteration 2 Fig. 19: Iteration 3 Fig. 20: Iteration 4
ISSN: 2321 9653; IC Value: 45.98; SJ Impact Factor: 7.538 Volume 10 Issue XI Nov 2022 Available at www.ijraset.com
Fig. 21: Iteration 5
Fig. 22: Iteration 6
In this study, CNN, dense net, and vgg16 were enhancedto better detect COVID, viral pneumonia, and to differentiate COVID 19 cases from non COVID 19 cases on chest X ray pictures. The proposed model eliminates the need for human feature extraction due to its automated nature and end to end structure. Less cases were used to train the deep models inthe vast majority of earlier research. A variety of example edged images are produced by the proposed model’s multi image augmentation technique, which is supported by firstand second order derivative edge operators. The classification accuracy of xray scans and photographs is evaluated using
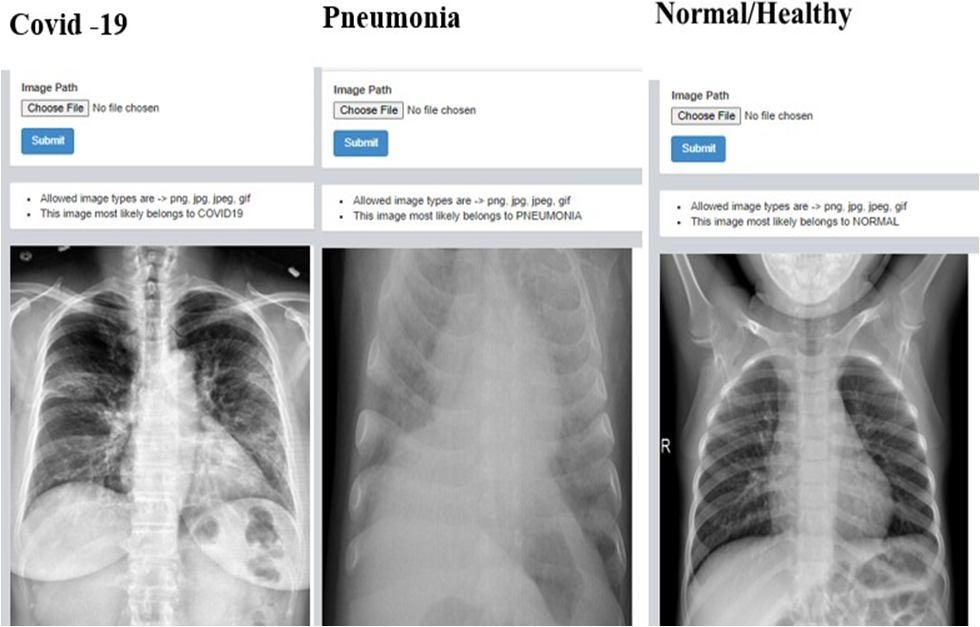
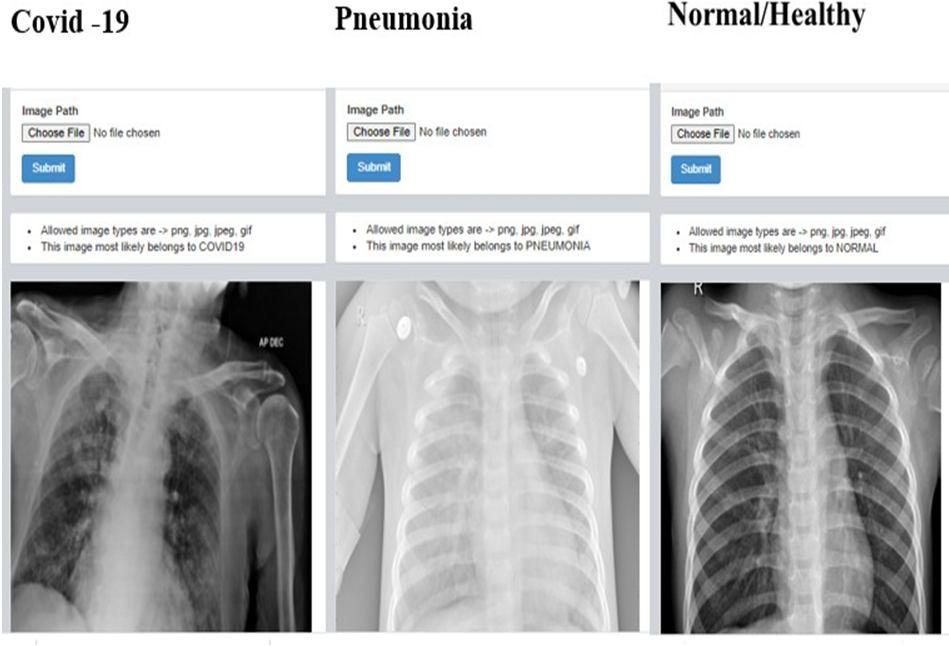
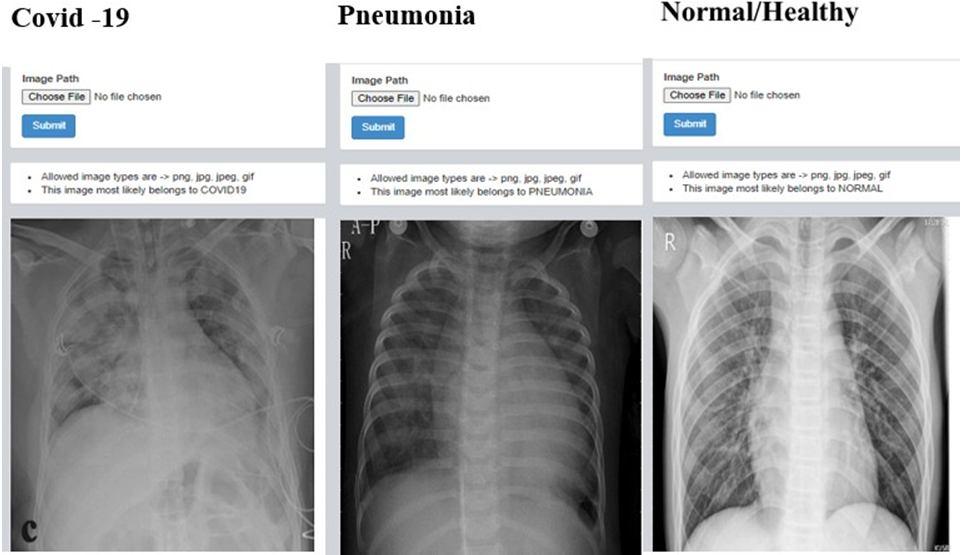
Fig. 23: Iteration 7
CNN that has been trained using these improved images. CNNhas a classification accuracy of 100% for X Ray pictures and photos when it is trained with these improved images. The experimental outcomes were deemed to be quite convincing, and they were helpful for COVID 19 screening on chest X rayimages of individuals who potentially have a corona.
ISSN: 2321 9653; IC Value: 45.98; SJ Impact Factor: 7.538 Volume 10 Issue XI Nov 2022 Available at www.ijraset.com
Future research may focus on the early diagnosis of several illnesses, such as pneumonia, bronchitis, and tuberculosis, as well as the COVID 19 of those who are suspected of havinga respiratory disorder. Our suggested multi model ensemble detection strategy has improved compared to the original detection effect for CNN, even though the detection effect for VGG 16 is still insufficient because of over fitting. The lengthytraining schedule is another problem. To improve the model’s accuracy, each of these elements should be considered. Futurestudy will focus on developing more precise classificationsystems for the diagnosis of two types of pneumonia caused bybacteria and viruses. The CNN based version is a promising way to use X rays to identify the disease, according to the description that was previously provided.
[1] Julia ´ n D Arias London ˜ o, Jorge A Gomez Garcia, Laureano Moro Vela ´ zquez, and Juan I Godino Llorente. Artificial intelligence applied to chest x ray images for the automatic detection of covid 19. a thoughtful evaluation approach. Ieee Access, 8:226811 226827, 2020.
[2] Asma Channa, Nirvana Popescu, et al. Robust technique to detect covid 19 using chest x ray images. In 2020 International Conference on e Health and Bioengineering (EHB), pages 1 6. IEEE, 2020.
[3] Joaquim De Moura, Lucıa Ramos Garcıa, Placido Francisco Lizancos Vidal, Milena Cruz, Laura Abelairas Lopez, Eva Castro Lopez, Jorge Novo, and Marcos Ortega. Deep convolutional approaches for the analysisof covid 19 using chest x ray images from portable devices. Ieee Access, 8:195594 195607, 2020.
[4] Akib Mohi Ud Din Khanday, Syed Tanzeel Rabani, Qamar Rayees Khan, Nusrat Rouf, and Masarat Mohi Ud Din. Machine learning based approaches for detecting covid 19 using clinical text data. International Journal of Information Technology, 12(3):731 739, 2020.
[5] Hagyeong Lee and Jongwoo Song. Introduction to convolutional neural network using keras; an understanding from a statistician. Communica tions for Statistical Applications and Methods, 26(6):591 610, 2019.
[6] Iosif Mporas and Prasitthichai Naronglerdrit. Covid 19 identification from chest x rays. In 2020 International conference on biomedical innovations and applications (BIA), pages 69 72. IEEE, 2020.
[7] T Padma and Ch Usha Kumari. Deep learning based chest x ray imageas a diagnostic tool for covid 19. In 2020 international conference on smart electronics and communication (ICOSEC), pages 589 592. IEEE, 2020.
[8] Milind Yadav, Murukessan Perumal, and M Srinivas. Analysis on novel coronavirus (covid 19) using machine learning methods. Chaos, Solitons & Fractals, 139:110050, 2020.