10 XII December 2022 https://doi.org/10.22214/ijraset.2022.48161
ISSN: 2321-9653; IC Value: 45.98; SJ Impact Factor: 7.538 Volume 10 Issue XII Dec 2022- Available at www.ijraset.com

ISSN: 2321-9653; IC Value: 45.98; SJ Impact Factor: 7.538 Volume 10 Issue XII Dec 2022- Available at www.ijraset.com
1
2
 Research Scholar,
 Professor, School of Earth Sciences, Swami Ramanand Teerth Marathwada University Nanded, Maharashtra India
Abstract: This article investigates the correlation between urban literacy and the urban sex ratio in the Parbhani district. Education forms an important component in the overall development of individuals, enabling them to have greater awareness, and better comprehension of their social, political, and cultural environment and also facilitating the importance of their socioeconomic conditions. Literacy rate (LR) is defined as the percentage of literates among the population aged seven years and above. Literacy is one of the significant indicators for the overall development of the human being. The sex ratio is used to determine gender equality in the population. In India, the number of females per 1000 males determines the sex ratio of the people. The literacy rate of the total population of the urban Parbhani district has increased from 52.58 percent to 69.21 percent in 1991 and in 2011 respectively. The increasing percentage is 16.63 during the two-decade period in the district. There is an overall development in the literacy rate of the district.in 1991 the urban sex ratio of the district was 924 and according to the census of 2011, the sex ratio is 958 respectively.
Keywords: Literacy, Sex ratio, Correlation, Urban, Parbhani, Geographical Analysis
The human development is mainly indexed by the literacy rate of the area and it indicates the status of human life in the area. It indicates levels of economic development and mainly the birth rate of the area gets affected. Living standards of area, status of women in the area and development of the technology in the area gets developed by the increasing literacy rate of the area. Human development is mainly caused by the education and it is accepted as the main component for it. It makes the society of the area accountable and comprehensible. Sex ratio is one of the basic demographic characteristics of population, which is directly depends on birth death and marriage. It is expressed in terms of numbers of female with respect to per thousand males. The imbalances between two sexes create serious problem in community. Yannawar V.B. (2015) It is one of the important factors in the development of country and has social as well as demographic implications. It also helps in analysis and planning of other demographic characters like migration, fertility, morality and economic structure. The slower growth and lower fertility are consequences of the major imbalances in sex ratio. For a proper understanding of demographic attributes in any region sex ratio analysis is crucial element. The sex ratio also influences marriage and growth rate of the population. The selected Parbhani district as study area of sex ratio during research, we found that there was decrease in sex ratio, sex ratio for Parbhani district was always the highest whereas Maharashtra state recorded the lowest sex ratio throughout the investigated period. The highest decline trend since 1981 was observed in Parbhani district, while in the 2011, entire study area recorded lowest number of females per thousand males. Hence, for the detail and micro level analysis tehsil-wise, spatio temporal analysis has been made in the research, it also helped to examine the geographical and other factors affecting the sex ratio of the study region Yannawar et al., (2013). There are many tools of statistical analysis and one of them is the correlation. it is used to determine the relationship between the two variables. Various methods are used in correlation analysis and different techniques are used for studying and measuring the scope of variables of the correlation and its relationship between them, by the simple definition correlation means relation between two variables that is, these variables are dependent and independent in nature Waghmare et al., (2013).
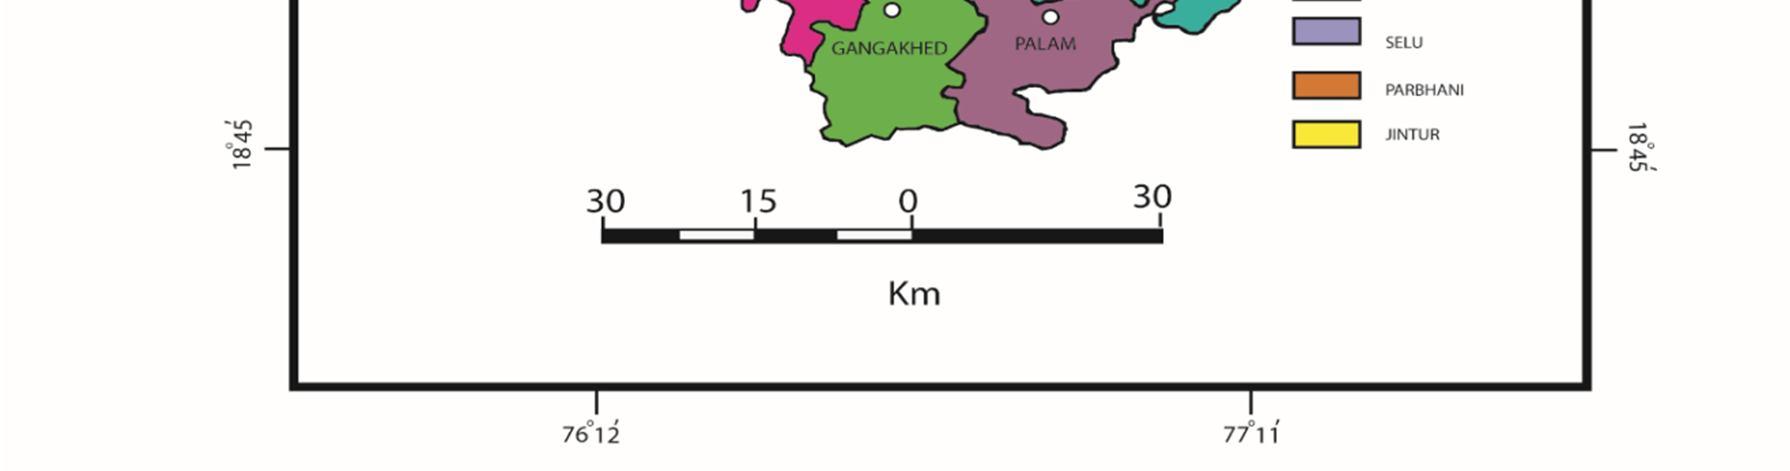
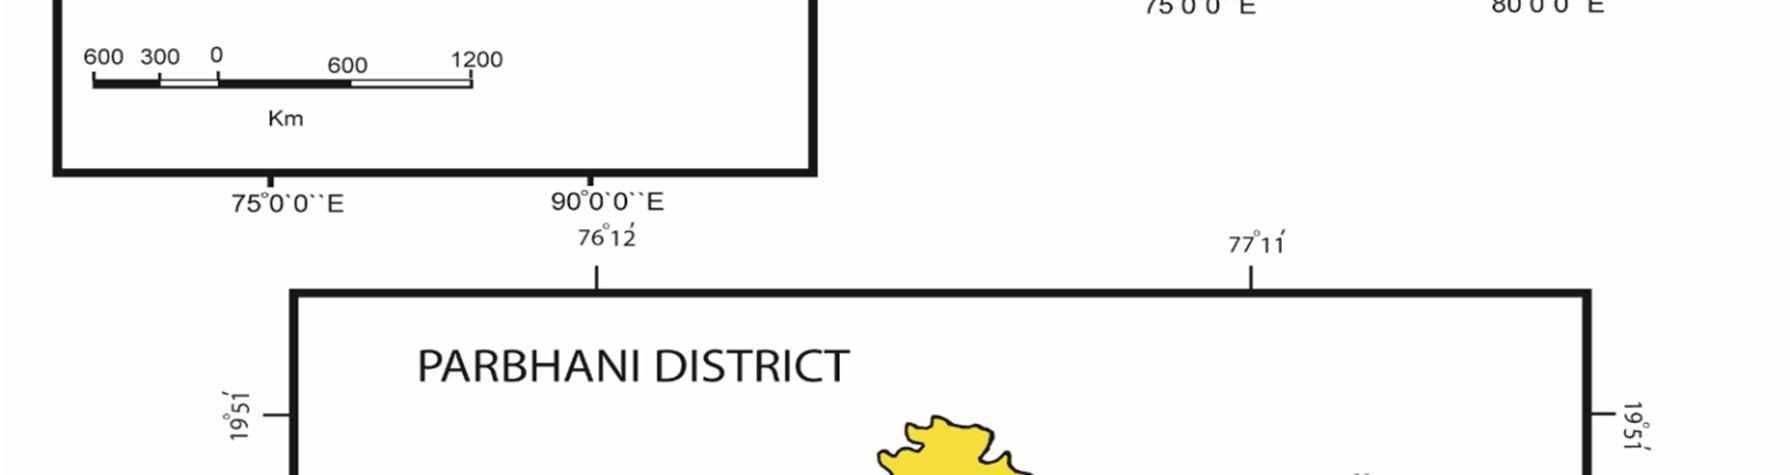
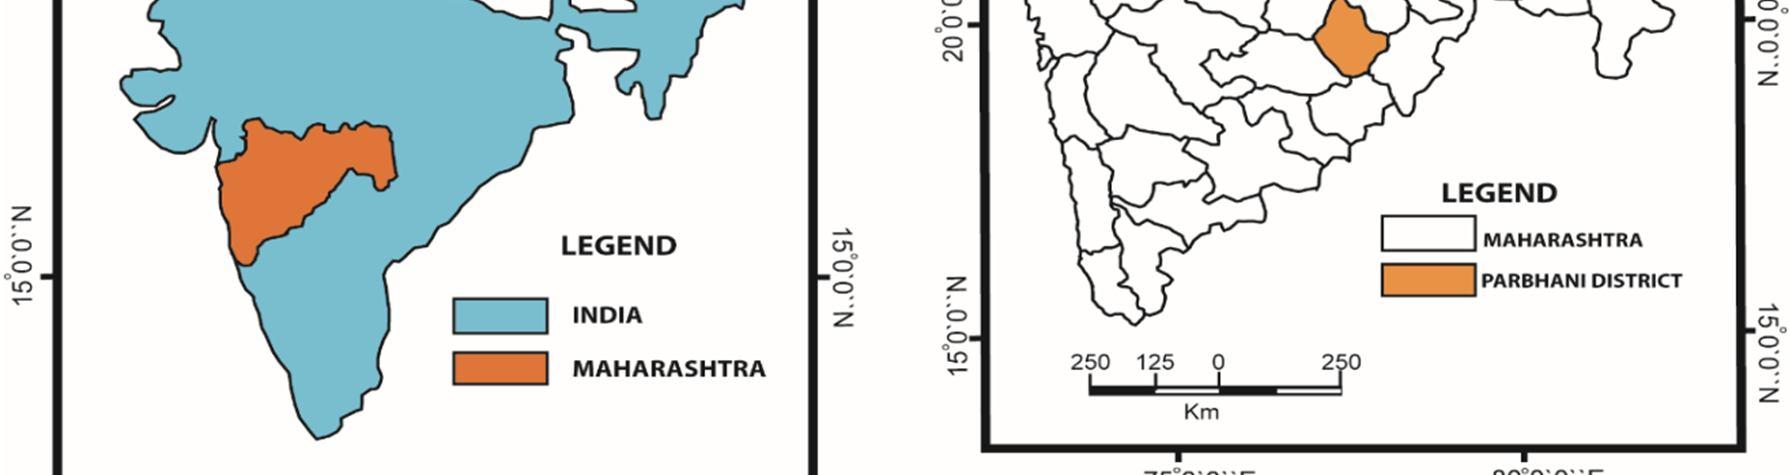
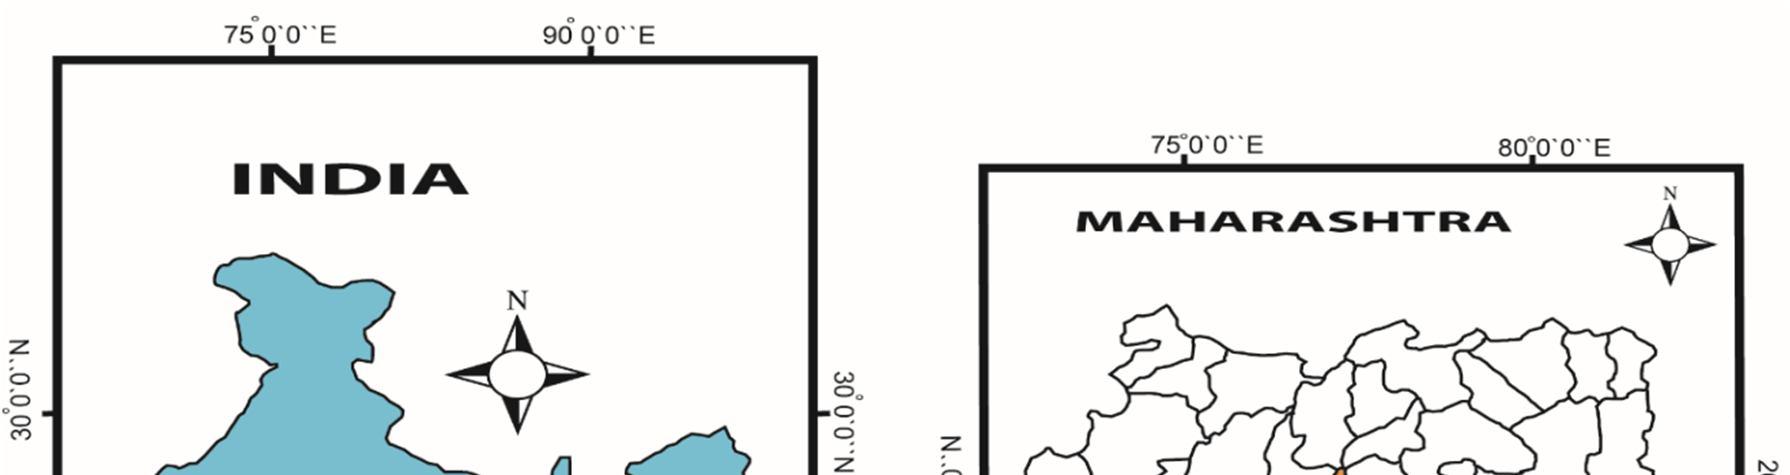
The Parbhani district part of Marathwada region of Maharashtra and present between 18˚ 45' North to 20˚ 01' latitudes and 76˚ 13'East to 77˚ 26' East longitude.
ISSN: 2321-9653; IC Value: 45.98; SJ Impact Factor: 7.538 Volume 10 Issue XII Dec 2022- Available at www.ijraset.com
The total population of Parbhani districts was 1836086 persons according to (2011 census) which is 1.63 percent of total population in Maharashtra and male 942870 and female are 893216. The Parbhani district covers an area of 6214 sq. km which forms 2.11% of the total geographical area of Maharashtra state. with average height 357.50 meters from mean sea level. In the northern side Buldhana, western side Jalana, southern side Beed and Latur and in the eastern side Nanded district are present. Parbhani district includes 9 tehsil Parbhani, Jintur, Gangakhed, Pathri, Purna, Palam, Selu, Sonpeth and Manwath Khadke and Waghmare (2017).
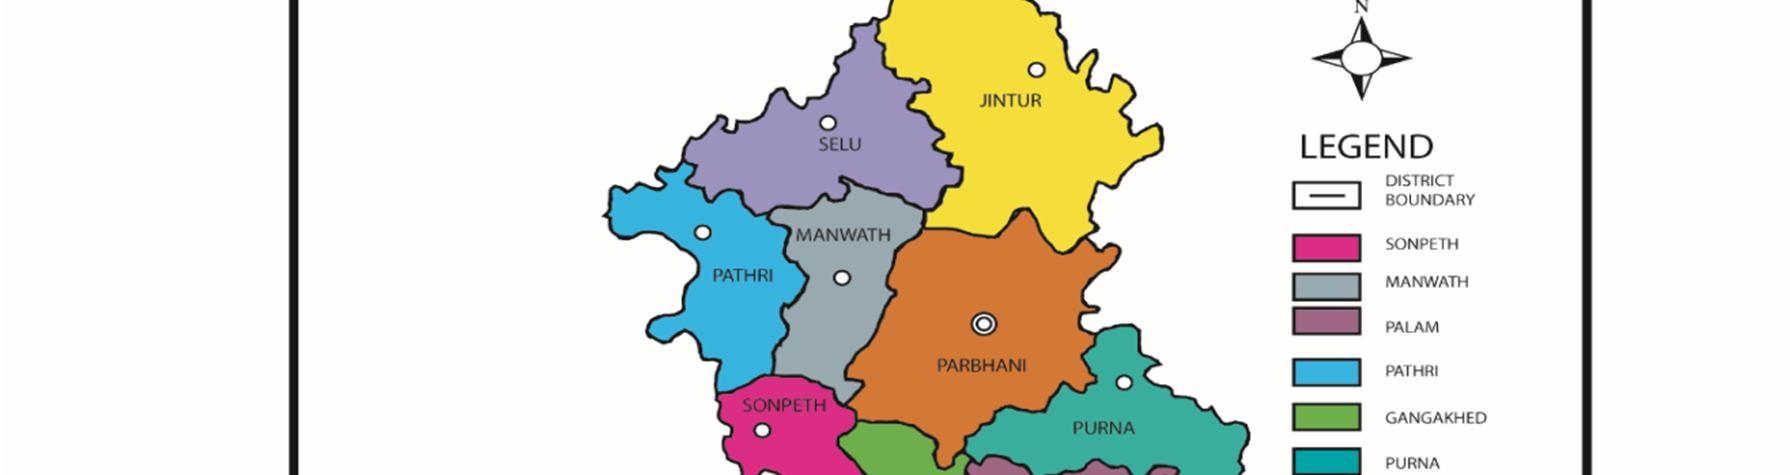
Fig. 1.1: Showing the study areas map along with different tehsils in the Parbhani
ISSN: 2321-9653; IC Value: 45.98; SJ Impact Factor: 7.538 Volume 10 Issue XII Dec 2022- Available at www.ijraset.com
The study based on secondary data which is obtained from the census of India 1991, 2001, 2011 respectively. In the present study two variables are used the variables are literacy and sex ratio of urban Parbhani. The spearman`s correlation statistical method is used for analysis of secondary data to achieve the main aim. The achieved data has been tabulated by graphs and maps Shinde (2016). The formula used for the analysis of variables are spearman`s rank correlation Sopher (1974) and Sopher (1980).
P= 1-6Ʃd2/n3 -n
Where: n = is the total number of observations d = is the difference in the rank of two variables.
The literacy rate of the country is increasing day by day and also the literacy rate of Maharashtra and urban Parbhani is also increasing. In 1991 the literates of the Maharashtra were 67.07 percent and according to the census of India 2011 the literate rate of Maharashtra is 78.85 percent. There is 11.78 percent increase in the literacy rate during the two decades In 1991 the literate rate of the Parbhani was 52.58 percent and in 2011it is 69.21 percent has been recorded. There is 16.63 percent increase in the literacy rate of the urban Parbhani during two decades. The overall literate rate of India is 52.2 in 1991 and 74.00 percent in 2011 respectively. However, literacy of Parbhani is in 1991 and it is low in 2011 as compare to India, Suvasree (2013) and Suman and Seema (2014)
B. Town & City Wise Comparison of Urban Literacy Literacy rate of male and female of town and city were calculated with the help of census year 1991, 2001 and 2011 distinctly.
C. Persons Literacy Percentage (%)
Level of Literacy %
Low (Below 60)
Table 3.1: Urban Person Literacy
1991 2001 2011
Sailu, Jintur, Manwath, Pathri, Gangakhed, Parbhani, Purna, Sonpeth (8)
Medium (60 to 65) -
High (65 to 70) -
Pathri, Sonpeth, Gangakhed (3) -
Sailu, Jintur, Manwath (3) Sonpeth (1)
Parbhani, Purna (2)
Sailu, Jintur, Manwath, Pathri, Gangakhed (5)
Very High (Above 70) - - Parbhani, Purna (2)
Source - Compiled by researcher based on census 1991, 2001 and 2011
In 1991 all above mentioned towns (Sailu, Jintur, Manwath, Pathri, Gangakhed, Purna, Sonpeth) and Parbhani city shows Literacy rate below 60 percent. In 2001 below 60 percent literacy rate was found in Pathri, Sonpeth and Gangakhed towns. The 60 to 65 percent literacy was found in Sailu, Jintur and Manwath. Purna town and Parbhani city shows the 65 to 70 percent literacy rate. 2001, there is no any town and city above 70 percent literacy. In 2011, there is no any towns and city below 60 percent literacy rate category. Sonpeth town have 60 to 65 percent literacy. Percentage with 65 to 70 percent literacy is found in Sailu, Jintur, Manwath, Pathri, and Gangakhed town. Parbhani city and Purna town shows above 70 percent very high literacy rate
Science & Engineering Technology (IJRASET
ISSN: 2321-9653; IC Value: 45.98; SJ Impact Factor: 7.538 Volume 10 Issue XII Dec 2022- Available at www.ijraset.com
Table 3.2: Urban Male Literacy in the study areas
Level of Literacy % 1991 2001 2011
Low (Below 65)
Sailu, Jintur, Manwath, Pathri, Gangakhed Parbhani, Sonpeth (7) -Medium (65 to 70) Purna (1)
Jintur, Pathri, Sonpeth, Gangakhed (4)High (70 to 75)Parbhani, Purna, Manwath (3)
Sailu, Jintur, Manwath, Pathri, Gangakhed Sonpeth (6) Very High (Above 75) - Purna (1) Parbhani, Purna (2)
Table 3.3: Urban Female Literacy
Level of Literacy % 1991 2001 2011
Very Low (Below 40)
Sailu, Jintur, Manwath, Pathri, Sonpeth Gangakhed (6) -Low (40 to 45) Parbhani, Purna (2) -(45 to 50) - Sonpeth (1)(50 to 55)Jintur, Manwath, Pathri, Gangakhed (4)(55 to 60) - Sailu, Parbhani, Purna (3) Sonpeth (1) (60 to 65) -Sailu, Jintur, Manwath, Pathri, Gangakhed (5) 65 above - - Parbhani, Purna (2)
Table No. 3.4: The trends of urban sex ratio in India, MH and Parbhani (1901 to 2011)
Sr. No Year Parbhani Maharashtra India 1 1901 996 978 972 2 1911 993 966 964 3 1921 978 950 955 4 1931 963 947 950 5 1941 960 949 945 6 1951 974 941 946 7 1961 969 936 941 8 1971 954 940 930 9 1981 968 937 934 10 1991 954 934 927 11 2001 958 922 933 12 2011 947 929 943
Table No. 3.4 displays changing pattern of the sex ratio of Parbhani district from 1901 to 2011. The sex ratio of Parbhani always remained below 1000. The Parbhani district always has higher sex ratio than the Maharashtra and India. Within India sex ratio decreases from 910 to 941 females within 1901 to 1961 after that continuous increasing trend is observed.
ISSN: 2321-9653; IC Value: 45.98; SJ Impact Factor: 7.538 Volume 10 Issue XII Dec 2022- Available at www.ijraset.com
The sex ratio of Maharashtra state 978 in 1901 which has reached 929 females per 1000 males in the 2011 with increasing and decreasing trends in between years. From 1901 to 1941 sex ratio of Parbhani district shows decreasing trend from 978 to 949 after that trend is not constant some years show increase where as some years show decrease in the sex ratio. The recent sex ratio of Parbhani district is 947 according to 2011 census. Which is lowest of all the decades in 2011 census India and Maharashtra having sex ratio 943 and 929 respectively.
Table No. 3.5: Parbhani District urban sex ratio (1901 to 2011)
Sr. No. Year Males Females Total Sex Ratio Decadal change Females % of Population
1 1901 17029 16918 33947 993 48.84
2 1911 19625 19101 38726 973 -20 49.32
3 1921 23518 22244 45762 946 -27 48.61
4 1931 32906 30172 63078 917 -29 47.83
5 1941 37542 34920 72462 930 13 48.19
6 1951 51714 49413 101127 956 25 48.86
7 1961 56846 52706 109552 927 -28 48.11
8 1971 86736 78879 165615 909 -18 47.63
9 1981 125834 117223 243057 932 22 47.83
10 1991 189179 174861 364040 924 -7 48.03
11 2001 250462 234724 485186 937 13 48.38
12 2011 290984 278822 569806 958 21 48.93
The observed urban sex ratio of the Parbhani district during the decade of 1901 to 2011 is given in the table No. 3.5. The highest sex ratio though out the decades was shown by the 1901 census data and the exact proportion was observed i.e., 16918 females against 17029 males in this way it talks about the ratio of 993 females every 1000 males. The census data of 1971 observed the lowest sex ratio throughout the decade and it was clearly mentioned that 78879 females against 86736 males which produced a sex ratio of 909 females every 1000 males. The decreasing trend observed during the census data of 1911 to 1931. Such as 973 females and 917 females per 1000 males in 1911 and 1931 census respectively. The increased sex ratio i.e., 49413 females against 51714 males observed in 1951 census data and produced a ratio of 956 females behind the 1000 males. The urban sex ratio data was slightly increased during the 1981 to 2011 census data. The observed data shows 909 females behind the 1000 males in 1971 census while 958 females every 1000 males observed in 2011 which shows gradual increase in sex ratio.
Table No. 3.6: Parbhani District town and city wise sex ratio
Sr. No Town
Changes of Sex Ratio 1981 1991 2001 2011 1981 to 1991 1991 to 2001 2001 to 2011 1 Selu 948 940 923 944 -8 -17 21 2 Jintur 951 925 912 958 -26 -13 46 3 Parbhani 908 915 936 962 7 21 26 4 Manwath 966 955 964 966 -11 9 2 5 Pathri 953 941 944 937 -12 3 -7 6 Sonpeth 977 941 936 942 -36 -5 6 7 Gangakhed 954 928 950 952 -26 22 2 8 Purna 930 918 947 970 -12 29 23
Sex Ratio
District Average 932 924 937 958 -8 13 21
ISSN: 2321-9653; IC Value: 45.98; SJ Impact Factor: 7.538 Volume 10 Issue XII Dec 2022- Available at www.ijraset.com
The town wise sex ratio of Parbhani district illustrated below. The Parbhani city is showing constant increase in sex ratio from 1981 to 2011in contrast with other town and cities which are shows initial decreased and after that increasing trend is observed. According to 1981 census Sonpeth town is having highest (977) sex ratio whereas Parbhani city shows lowest value 908. Sex ratio in Selu, Jintur and Sonpeth towns shows decreasing trend from 1981 up to 2011 and after that increasing trend recorded in the 2011 census A simple 4 different types of trends are observed in sex ratio during the period1981 to 2011 viz. (1) In three town namely Selu (-8,17), Jintur (-26, -13) and Sonpeth (-36, -5) sex ratio decreased in 1981 to 2001 and in 2011 it increases 21, 46 and 6 for the town Selu, Jintur and Sonpeth respectively. (2) In Parbhani city, positive trend is observed in sex ratio from 1981 to 2011 (7, 21 and 26). (3) Towns like Gangakhed (-26, 22 and 2), Manwath (-11,9 and 2) and Purna (-12,29 and 23) shows negative sex ratio for the year 1981 to 1991, but from 2001 to 2011it shows slightly positive value. (4) Pathri is the only town where sex ratio (-13) for the period 1981 to 1991; increases in 2001 (from -13 to 3), but again in 2011 it decreases (from 3 to -7).
Table No. 3.7: Urban Sex Ratio in the Parbhani
Sex ratio 1981 1991 2001 2011
Below 910 Parbhani (1) -910 to 930 Purna (1) Jintur, Parbhani Purna Gangakhed (4) Selu, Jintur (2)930 to 960 Selu, Jintur, Gangakhed Pathri (4) Selu, Pathri, Sonpeth, Manwath (4) Parbhani, Pathri, Sonpeth, Gangakhed (4) Selu, Jintur, Sonpeth Gangakhed Pathri (5)
Above 960 Sonpeth, Manwath (2) - Manwath, Purna (2) Parbhani, Purna, Manwath (3)
Table No. 3.8: Correlation between Urban Literacy and Urban Sex ratio in Parbhani (1991)
Sr. No Name of Town Urban Literacy Rate Urban Sex Ratio R1 R2
D (R1-R2) D2 1 Sailu 54.46 940 2 4 -2 4 2 Jintur 48.90 925 6 6 0 0 3 Parbhani 54.90 915 1 8 -7 49 4 Manwath 48.42 955 5 1 4 16 5 Pathri 47.33 941 7 2.5 4.5 20.25 6 Sonpeth 45.12 941 8 2.5 5.5 30.25 7 Gangakhed 51.42 928 4 5 -1 1 8 Purna 53.39 918 3 7 -4 16 District 52.58 924 - - - ΣD2 =136.5 (R1= Rank of sex ratio, R2= Rank of density, d= differences in the rank of two variables) P = 1-[(6ƩD2) / (N3-N)] P = 1- [(6×136.5) / (83-8)] P = 1- (819/512-8) P = 1- 819/504 P = 1-1.625 P = - 0.62
ISSN: 2321-9653; IC Value: 45.98; SJ Impact Factor: 7.538 Volume 10 Issue XII Dec 2022- Available at www.ijraset.com
Sr. No Name of Town Urban Literacy Rate Urban Sex Ratio R1 R2
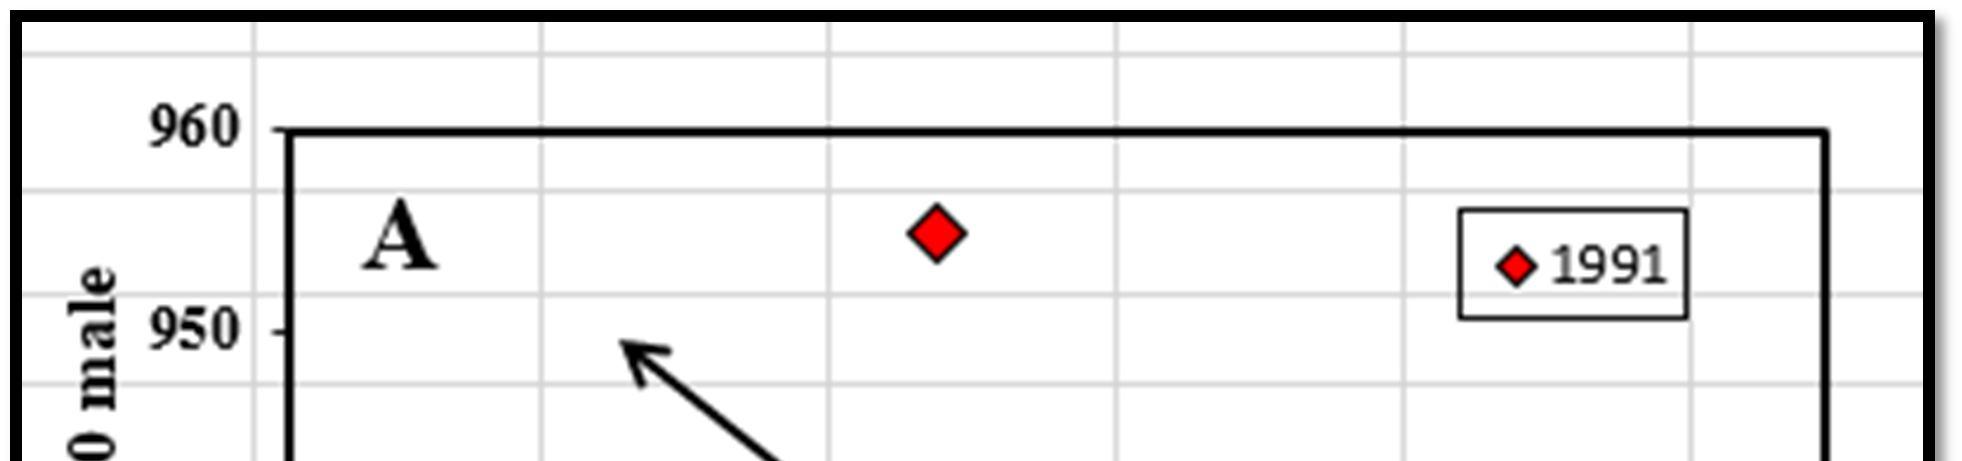
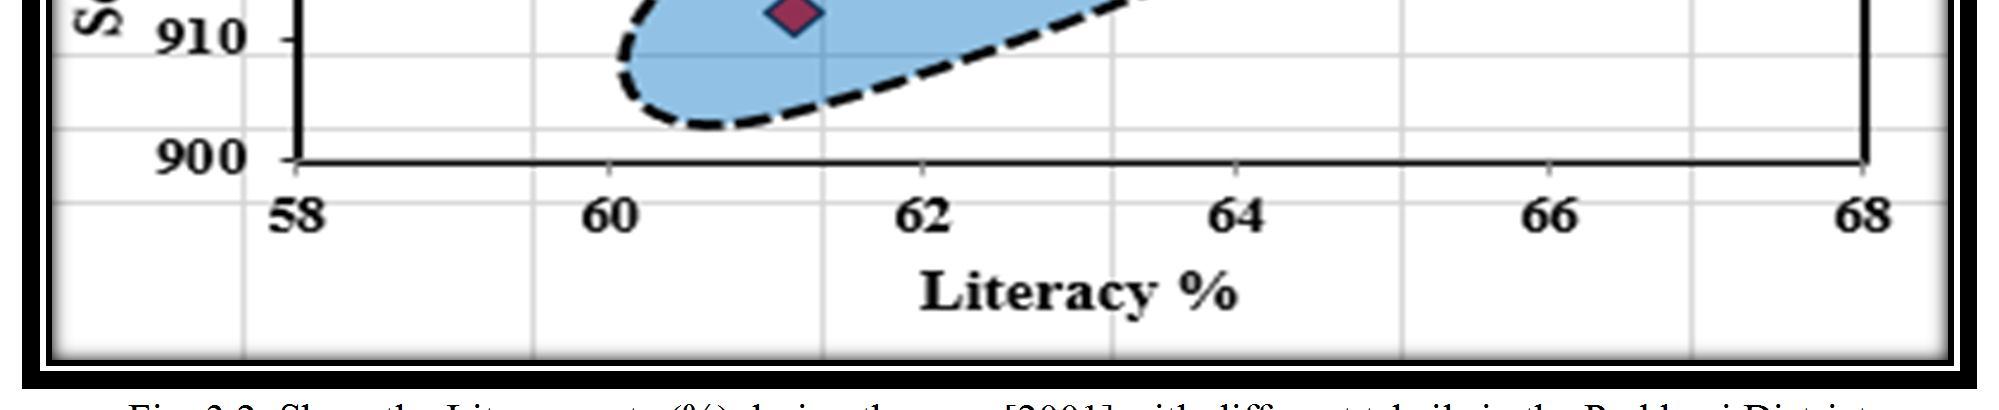
Fig. 3.1: Show the Literacy rate during the year [1991] with different tehsils in the Parbhani Table No. 3.9: Correlation between Urban Literacy and Urban Sex ratio in Parbhani (2001) (R1= Rank of sex ratio, R2= Rank of density, d= differences in the rank of two variables) P = 1-[(6ƩD2) / (N3-N)] P = 1- [(6×92.5) / (83-8)] P = 1- (555/512-8) P = 1- 555/504 P = 1-1.1011 P = - 0.10
D (R1-R2) D2 1 Sailu 63.95 923 3 7 -4 16 2 Jintur 61.16 912 5 8 -3 9 3 Parbhani 65.72 936 2 5.5 -3.5 12.25 4 Manwath 61.74 964 4 1 3 9 5 Pathri 59.80 944 6 4 2 4 6 Sonpeth 58.91 936 7 5.5 1.5 2.25 7 Gangakhed 59.29 950 8 2 6 36 8 Purna 67.19 947 1 3 -2 4 District 63.97 937 - - - ΣD2 = 92.5
ISSN: 2321-9653; IC Value: 45.98; SJ Impact Factor: 7.538 Volume 10 Issue XII Dec 2022- Available at www.ijraset.com
ISSN: 2321-9653; IC Value: 45.98; SJ Impact Factor: 7.538 Volume 10 Issue XII Dec 2022- Available at www.ijraset.com
Table No. 3.10: Correlation between Urban Literacy and Urban Sex ratio in Parbhani (2011)
Sr. No Name of Town Urban Literacy Rate Urban Sex Ratio R1 R2
D (R1-R2) D2
1 Sailu 67.45 944 3 6 -3 9 2 Jintur 66.66 958 5 4 1 1 3 Parbhani 70.71 962 2 3 -1 1 4 Manwath 67.35 966 4 2 2 4 5 Pathri 66.40 937 7 8 -1 1 6 Sonpeth 64.75 942 8 7 1 1 7 Gangakhed 66.62 952 6 5 1 1 8 Purna 71.96 970 1 1 0 0 District 69.21 958 - - - ΣD2 = 18
(R1= Rank of sex ratio, R2= Rank of density, d= differences in the rank of two variables) P = 1-[(6ƩD2) / (N3-N)] P = 1- [(6×18) / (83-8)] P = 1- (108/512-8) P = 1- 108/504 P = 1-0.214 P = 0.78
Sailu Jintur Parbhani Manwath Pathri Sonpeth Gangakhed Purna
75
70
65
60
55
50
45
80 1991 2001 2011
Literacy % Year
40
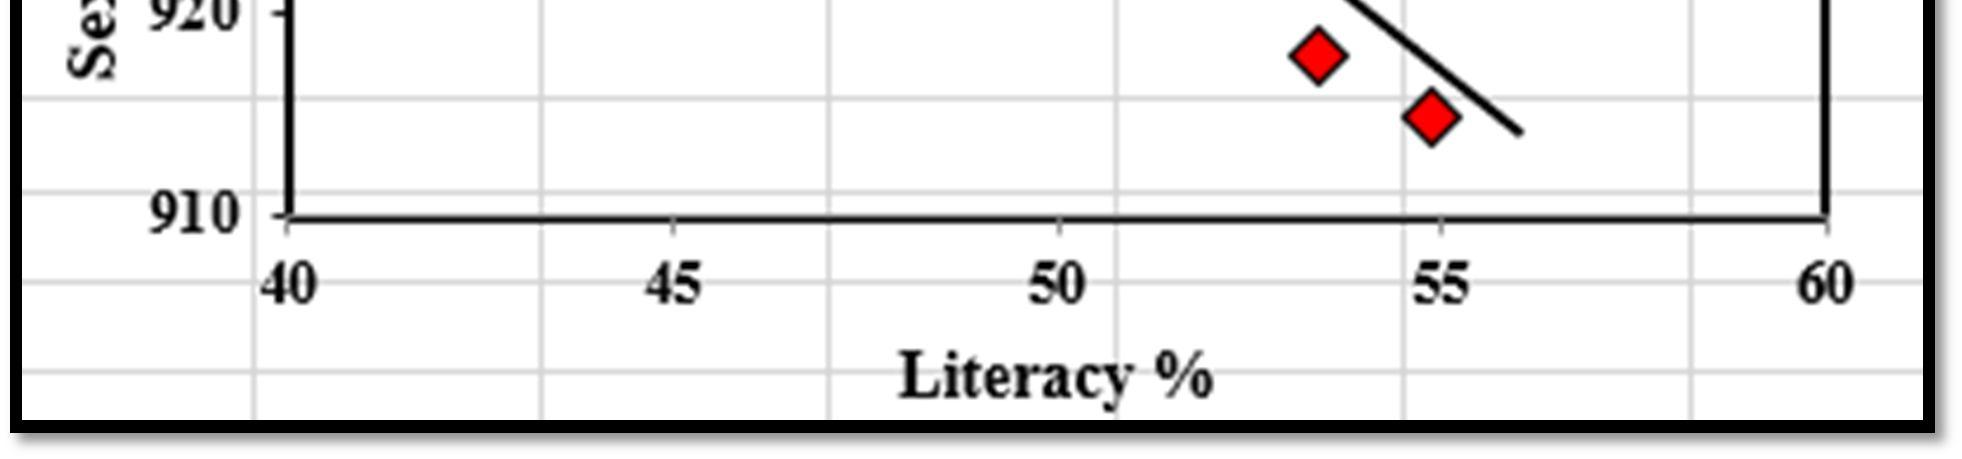
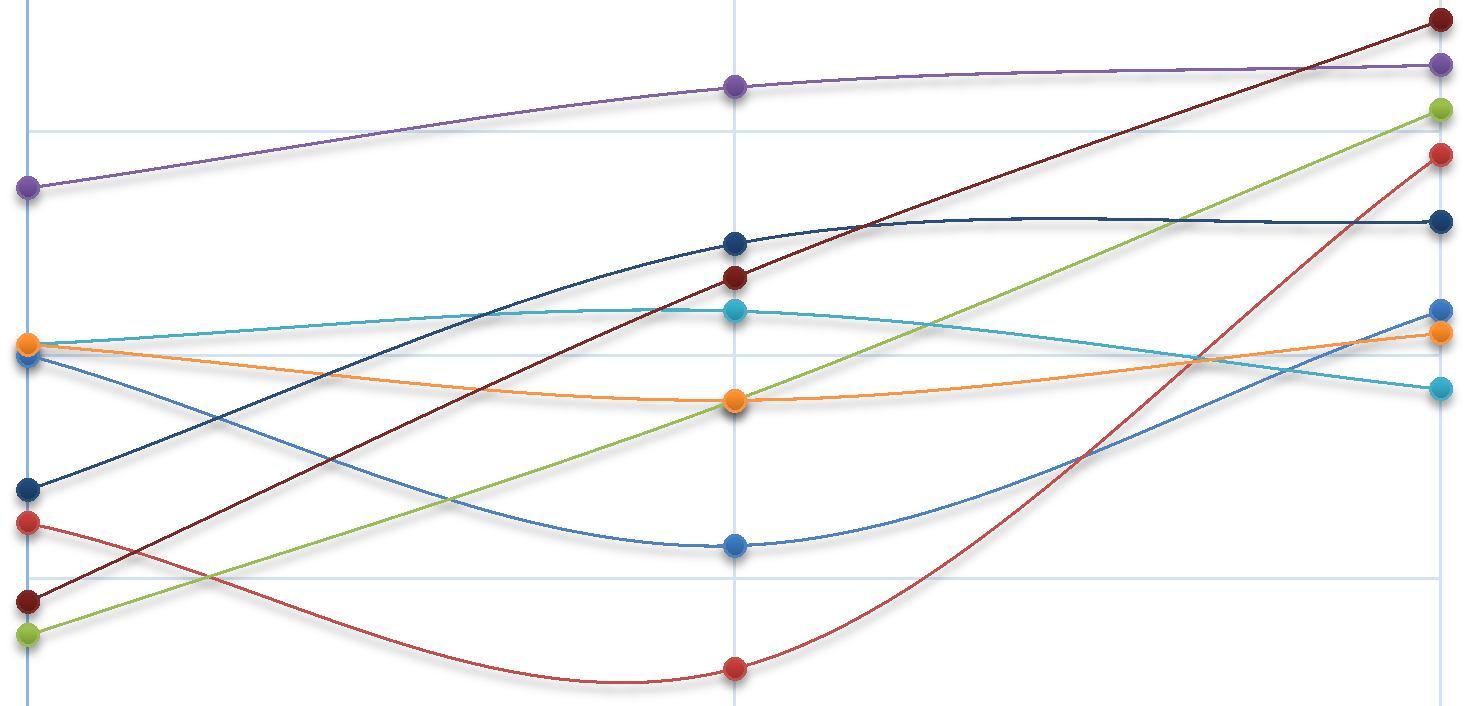
Fig. 3.4: Showing the correlation between urban literacy of last three decades from the Parbhani District The figure 3.4 as above showing the correlation between urban literacy of last three decades from the Parbhani district. The noticed correlation between Urban Literacy and Urban Sex ratio in Parbhani district during the last three decades viz. 1991, 2001, 2011 respectively. In the figure 3.5 below showing the association among urban literacy of last three decades from the Parbhani district correspondingly.
ISSN: 2321-9653; IC Value: 45.98; SJ Impact Factor: 7.538 Volume 10 Issue XII Dec 2022- Available at www.ijraset.com
960
940
920
980 1991 2001 2011
Sex Ratio per 1000 male Year Sailu Jintur Parbhani Manwath Pathri Sonpeth Gangakhed Purna
900
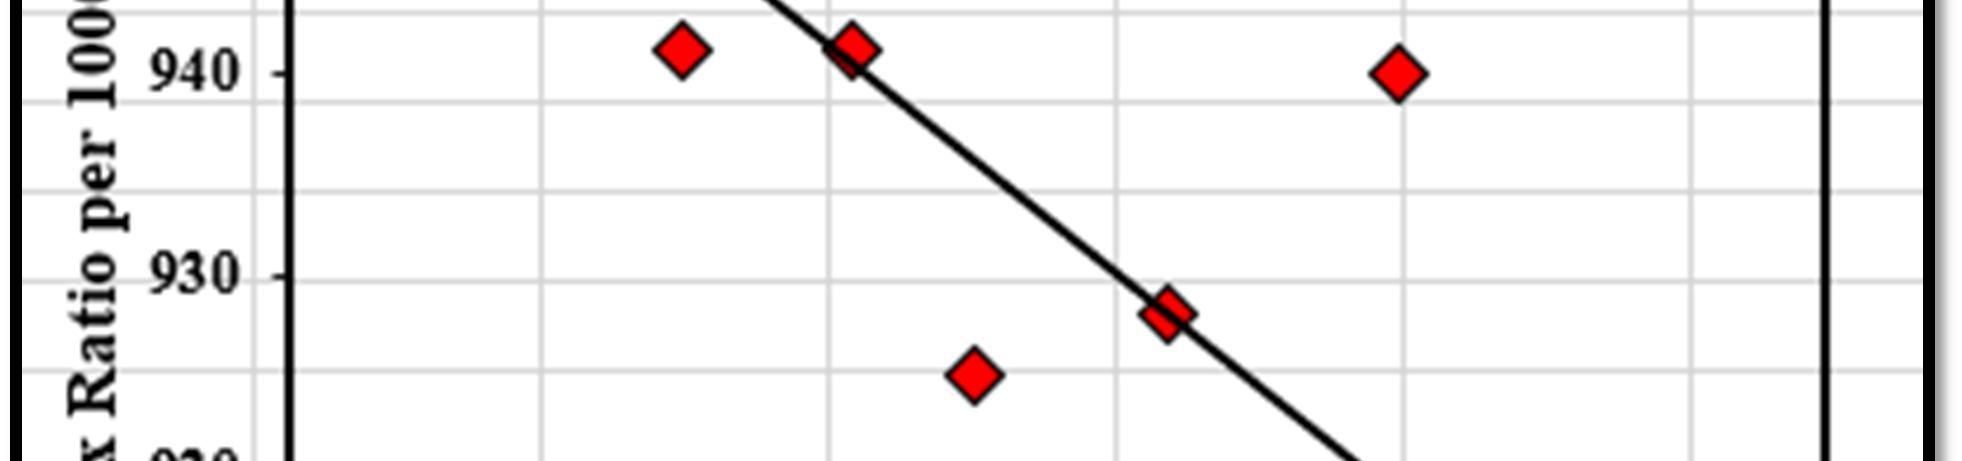
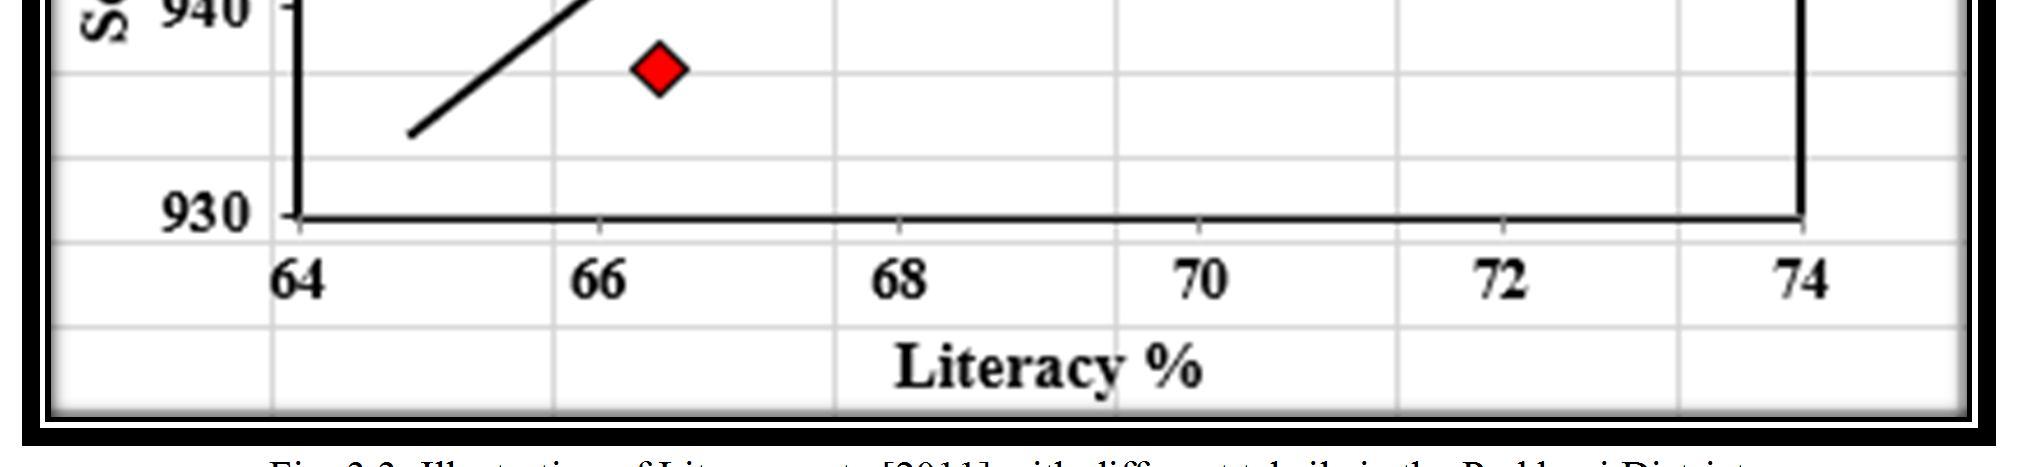
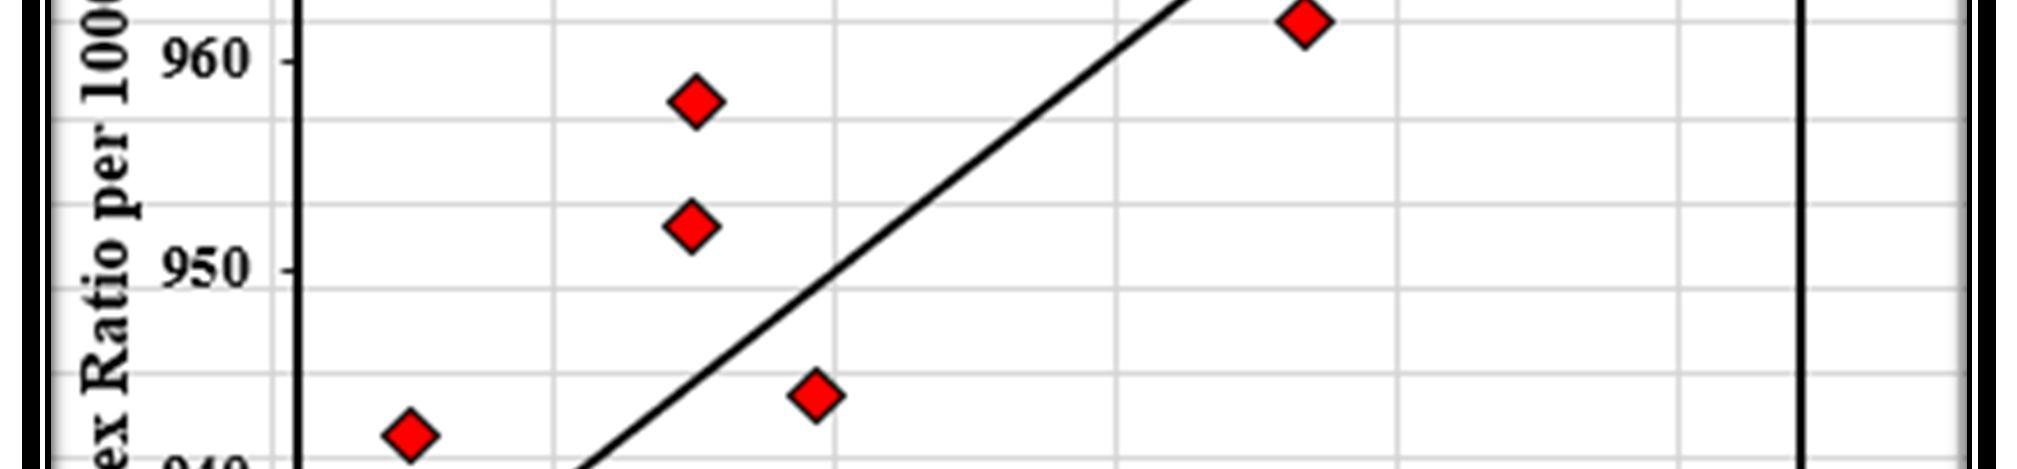
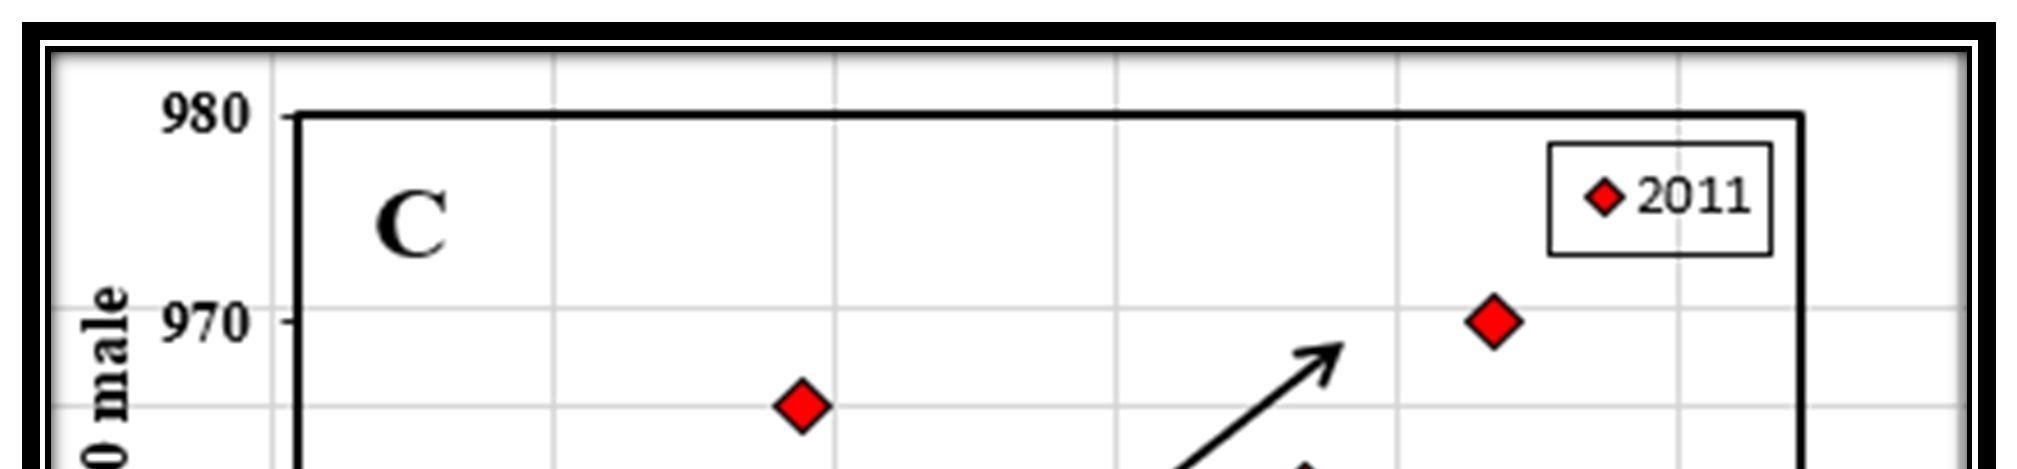
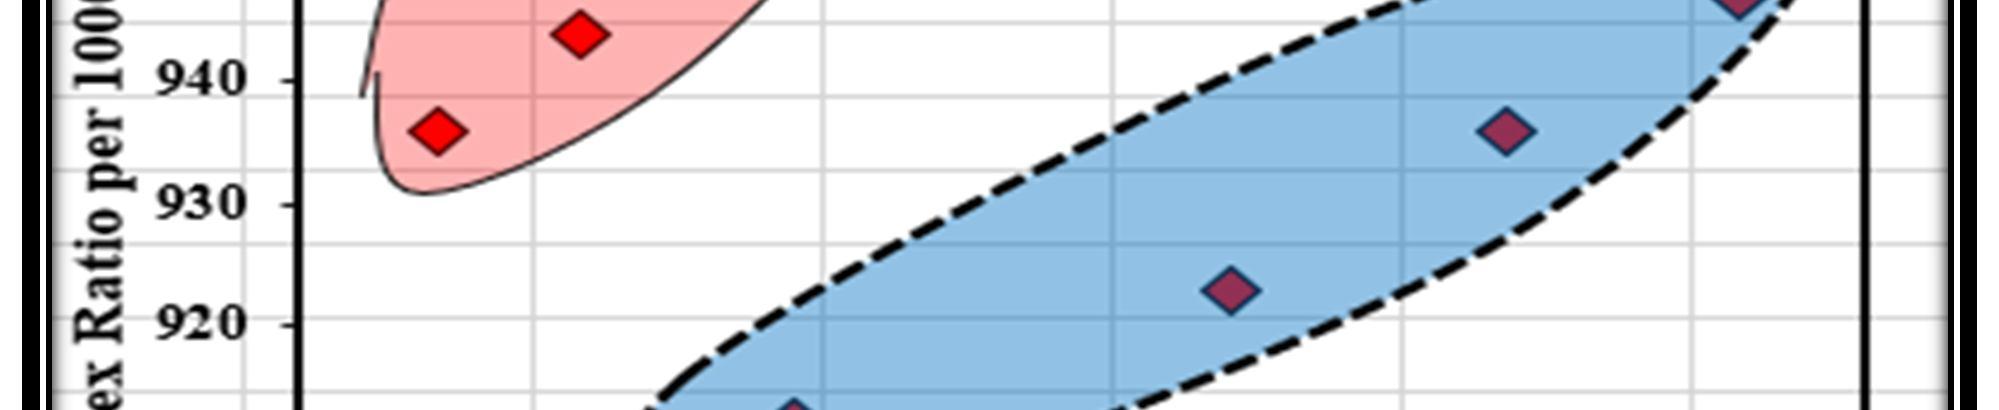
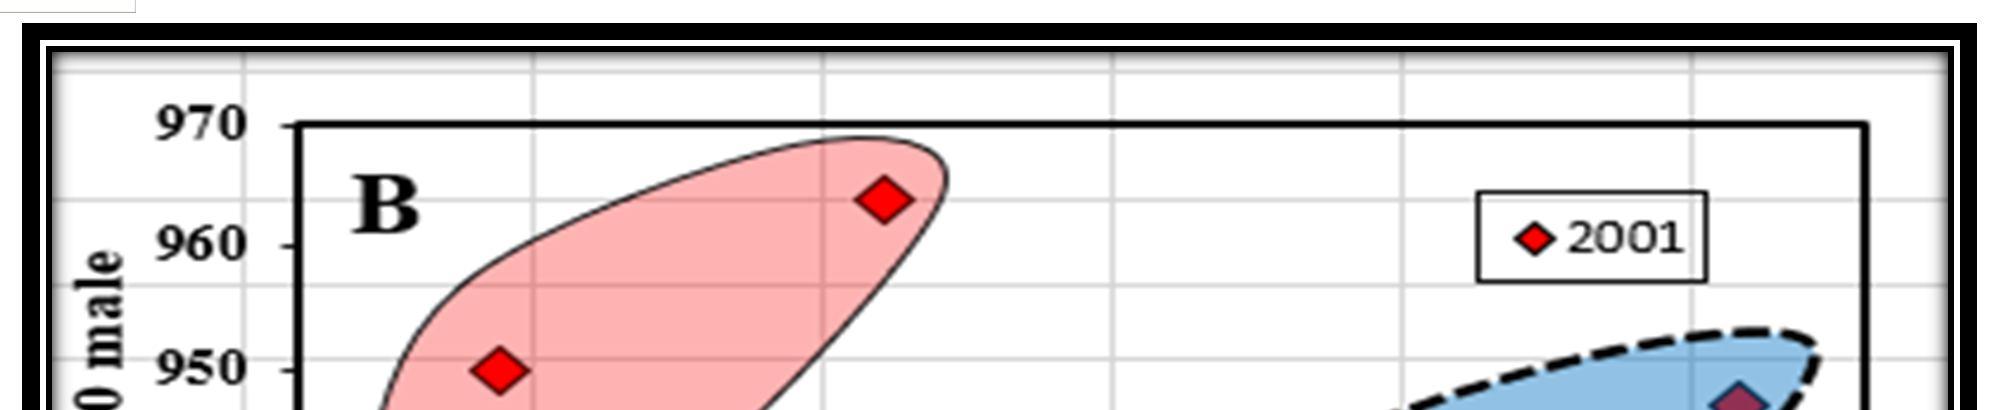
Fig. 3.5: Showing the association among urban literacy of last three decades from the Parbhani District
This article investigates the correlation between urban literacy and urban sex ratio in Parbhani district. Literacy rate to the total population of the urban Parbhani district has increased from 52.58 percent to 69.21 percent in 1991 and in 2011 respectively. The increasing percent is 16.63 during the two-decade period of in the district. There is the overall development in the literacy rate of the district is 1991. The urban sex ratio of the district was 924 and according to the census of 2011 the sex ratio is 958 respectively in the district respectively
1) Declaration: The authors of this manuscript do not oppose the interest.
2) Acknowledgement: We are thankful to the Mahatma Jyotiba Phule Research & Training Institute (MAHAJYOTI), for financial support to this research and the school of Earth Sciences, Swami Ramanand Teerth Marathwada University, Nanded, Maharashtra, India for providing laboratory and library facilities that are helping me to carry on with my work in an effective way.
[1] Khadke P.A. and Waghmare P.B., (2017), “Disparities of sex ratio in Maharashtra state of India”, International Journal of Research in social sciences, Vol. 7, Issue 8, Page 627-642.
[2] Shinde T.P. (2016) “Correlation between female literacy and child sex ratio in Satara district Maharashtra: A geographical analysis”, American international journal of research in humanities, Arts and social sciences, Vol. 13 No. 1, PP 71-73.
[3] Sopher D. E. (1974), “Measurement of Disparity,” the Professional Geographer, 26 (4): 380-392.
[4] Sopher, D. E. (1980), “Sex disparity in Indian literacy,” In D. E. Sopher (Ed.), An exploration of India: Geographical perspectives on society and culture. New York: Cornell Press. 130-188.
[5] Suman and MS Seema (2014) “Impact of Female Literacy on Sex Ratio: A Case Study of Haryana,” International Journal of Current Trends in Science and Technology, Vol. 7, Issue. 8, Page no: 20281-20286.
[6] Suvasree Dutta (2013) “Disparity in the Literacy Level among the Scheduled and Non-Scheduled Population: Indian Scenario in the 21st Century,” Transactions, 35 (2).
[7] Waghmare P. B. and Khadke P A (2013) A Geographical Study of Literacy of Nanded District”, in Research Front Journal Vol. 1 No. 3, PP. 15-22.
[8] Yannawar VB, Bhosle AB, Khadke PA and Waghmare PB, (2013), Monitoring Physical Growth of Nanded City by Using Geoinformatics Techniques, Researcher, Vol. 5 No. 2, pp. 80-86.
[9] Yannawar Vyankatesh B. (2015): The Nanded Information System, Lap Lambert Academic publishing, Germany.