10 XII December 2022 https://doi.org/10.22214/ijraset.2022.48311
ISSN: 2321-9653; IC Value: 45.98; SJ Impact Factor: 7.538 Volume 10 Issue XII Dec 2022- Available at www.ijraset.com

ISSN: 2321-9653; IC Value: 45.98; SJ Impact Factor: 7.538 Volume 10 Issue XII Dec 2022- Available at www.ijraset.com
Nisha Sawant1, Dnyandev Ravindra Khadapkar2
1Department of Computer Applications and IT, Goa Multi-Faculty College, Dharbandora, Goa 2Department of Information Technology, Goa College of Engineering, Goa
Abstract: Most educational institutions worldwide have been closed since March 2020 in an effort to slow the spread of the Covid-19 epidemic. More than 90% of students around the world have been influenced by this. In this study, we'll make a prediction about whether or not the Covid-19 epidemic has benefited student performance. Our data will be divided into training and testing datasets, with 80% of the data utilised for training and 20% for testing. To calculate the accuracy of our predictions, we'll use six different algorithms, including the RandomForestClassifier Algorithm, the GaussianNB Algorithm, the K Neighbors Classifier Algorithm, the Logistic Regression Algorithm, the Linear Discriminant Analysis Algorithm, and the DecisionTree Classifier Algorithm.

Keywords: predictive analytics, GaussianNB Algorithm, the K Neighbors Classifier Algorithm, the Logistic Regression Algorithm, the Linear Discriminant Analysis Algorithm, and the DecisionTree Classifier Algorithm
A. RandomForestClassifier: Suitable for Binary, Continuous and categorical data type.
The Random Forest Algorithm consists of several decision trees on various subsets of a given dataset. Based on the concept of ensemble learning process, it creates decision trees based on data samples. It gets the prediction from each of them and selects the best solution by means of voting.
Reduces risk of over fitting and the required training time.
Runs efficiently in large database while producing highly accurate predictions by estimating missing data.
Compared to a decision tree, it is slower.
It requires significant memory for storage due to the need for retaining the information from several hundred individual trees.
B. LogisticRegression: Suitable for Binary data type.
Logistical Regression is a statistical method used for building machine learning models. It is considered as one of the simplest Machine Learning Algorithm which can be applied on various classification problems such as Spam Detection, Diabetes, Prediction, Cancer detection etc. There are only two possible outcomes in a logistic Regression formula(Dichotomous).
No problems scaling input features and does not require tuning.
It is highly interpretable and does not require too many computational resources.
Easy to implement and train a model using Logistic Regression.
ISSN: 2321-9653; IC Value: 45.98; SJ Impact Factor: 7.538
Volume 10 Issue XII Dec 2022- Available at www.ijraset.com
Constructs Linear Boundaries.
It’s inefficient when the number of observations are lesser than the number of features. Which can lead to overfitting.
The LDA is a supervised algorithm that aims to find the linear discriminant to represent the axes that maximize separation between different classes of data. This reduces the number of features which reduces the computing cost significantly (similar to principal component analysis). It is used in face recognition, prediction, customer identification, medical fields etc.
It is a simple, fast and portable algorithm.
It can beat Linear Regression when its assumptions are met.
Requires normal distribution assumption on features/predictors.
Sometimes not good for few categories variables.
D. KNeighbours: Suitable for Individual Data.
The K nearest Neighbour is useful when you are performing a pattern recognition test. It classifies a data point based on it's neighbor's classification and stores all available cases. Although it is mostly recommended for Classification problems, it can also be used for regression. The algorithm is Non-Parametric, which means it does not make any assumption on underlying data.
Simple to implement with just one parameter.
It is more effective if training data is large.
Used for Classification, Regression, Ranking, Recommendations, imputations etc.
The Value of k must always be determined which can be complex.
Calculating the distance between the data points for all the training samples results in a higher computation cost.
Size of the model grows with new data incorporated.
It is a distance based-approach hence the model can be badly affected by outliers. Making it prone to Overfitting.
A decision tree is a graphical representation for getting all the possible solutions to a problem/decision based on given conditions. They can be used in both regression and classification tasks. A decision tree comprises of two nodes, a decision node and Leaf Node. Decision nodes are used to make any decision and have multiple branches, whereas Leaf Nodes are the output of these decisions
1) Advantages
Decision Trees mimics the human thinking ability while making a decision, which makes it easy to understand/interpret. There is less requirement of data cleaning compared to other algorithms.
The Decision tree contains lots of layers, which makes it complex.
It may have Overfitting Issues.
Gaussian Naive Bayes is a variant of Naïve Bayes that follows Gaussian normal distribution and supports Continuous data. The Gaussian or Normal distribution is the simplest to implement as the user is required to calculate the mean and standard deviation for the training data. It overall provides better performance by eliminating insignificant specifications. The algorithm uses probability for many classification functions while other functions are used to estimate data distribution.
ISSN: 2321-9653; IC Value: 45.98; SJ Impact Factor: 7.538
Volume 10 Issue XII Dec 2022- Available at www.ijraset.com
Fast and Flexible Model that works well with Large data.
No need to spend much time for training.
Large data records are required to achieve good results. Shows lower performance than the other classifiers according to the type of problem.
A survey was given to Goa students in various classrooms via online Google forms in order to get information on the learning curve of students during COVID-19. There were options to choose from when answering the survey's questions. The best choice that reflected their values had to be selected by the pupils. This allowed us to collect responses from around the State by disseminating the poll from September 30 to October 10, 2021. After reviewing the data, we chose approximately 461 records with the intention of obtaining a wide range of replies.
We gathered the information by sending out questionnaires via Google Forms to our Goa-based students, friends, family, and other well-wishers.
Email address, name, educational level, name of the institution, age, gender, taluka, and a few other columns have sub-questions make up the total of 36 columns, including the timestamp which is the default.
Excel was utilised to pre-process the data, and a Jupyter notebook was used for analysis and analytics. You may create and share documents with live code, equations, visualisations, and text with this open source web application. We used a variety of steps for pre-processing. First, we converted any suitable string values to numeric numbers. The data was then filtered, and outliers were eliminated from the necessary rows. This decreased the number of rows from 561 to 423 rows. We then generated 5 graphs using the filtered data that were required for further investigation.
After cleansing and preprocessing the data, feature selection was done. To achieve the best accuracy, we took 22 columns out of 35 columns. Then, 2 columns Sum and Final Result were added. The sum column contains the total count for each row that was calculated, and the final result column contains the average of all responses for each individual. All of this was done using simply Excel, where 0 means performance has not increased and 1 means performance has.
To achieve the best accuracy, we used feature selection on our dataset and removed 22 of the dataset's 35 columns. The data was then divided into training and testing. The Random Forest Classifier technique was then used to create baseline models, and five other algorithms were employed to assess the accuracy.
The pupils were given a multiple-choice grid with five distinct options for each statement (only one of these could be selected for each statement). Agree, Disagree, Neutral, Strongly Agree, and Strongly Disagree were the available responses for each statement. The statements were categorised into five main groups: the ability to adapt to online classes, problems with online classes, mental health problems caused by online classes, the effectiveness of the online teaching and learning process, and the overall effect on personality.
ISSN: 2321-9653; IC Value: 45.98; SJ Impact Factor: 7.538 Volume 10 Issue XII Dec 2022- Available at www.ijraset.com
50% of students believe that e-learning tools are easy to use and 50% say they can do tasks faster in online mode. Most of the students strongly believe that online classes are not better than normal classroom classes. 70% agree that teachers are putting lots of efforts into making it easier for students to learn online .
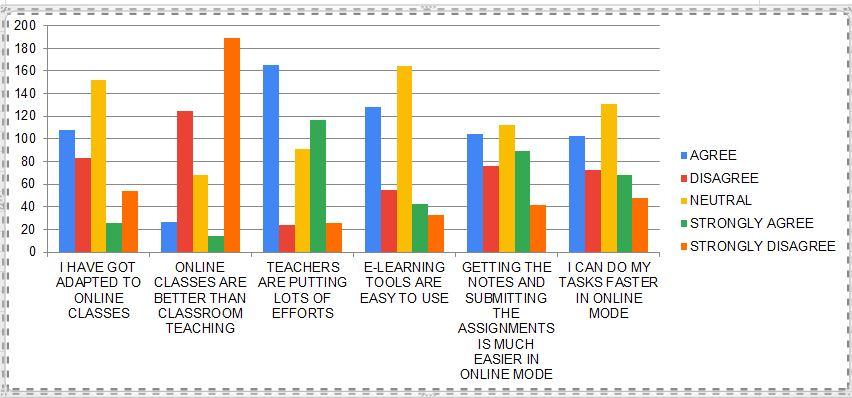
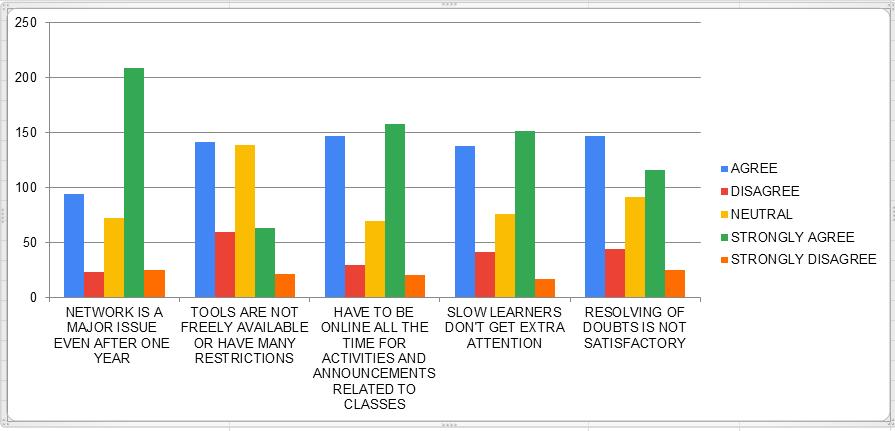
More than 40% students have same opinion that they have to be online all the time for activities and announcements related to online classes. Very few disagree with the statement that slow learners don't get extra attention. Most of the students says that resolving of problem is not satisfactory.
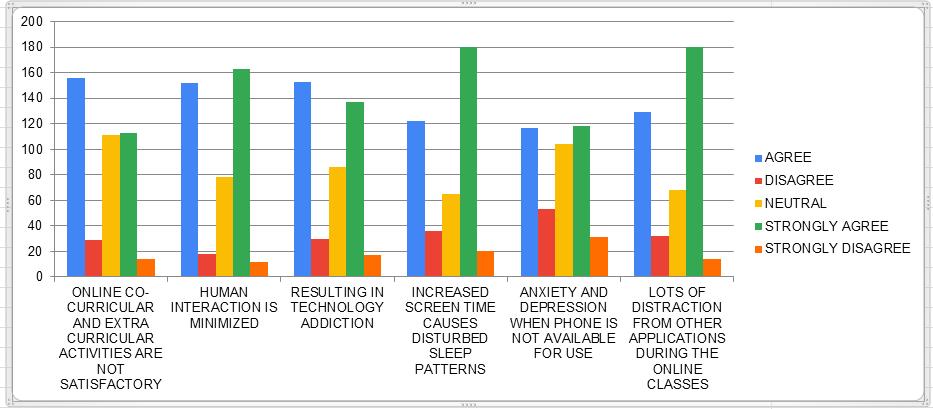
60% of students agree that increased screen time results in disturbed sleep patterns. 80% students strongly believe that human interaction is minimized due to online classes. Less than 10% students believe that online classes are not resulting in technology addiction. More than 60% students agreed that online cocurricular and extracurricular activities are not satisfactory.
Fig. 3 Mental issues due to online classes
ISSN: 2321-9653; IC Value: 45.98; SJ Impact Factor: 7.538 Volume 10 Issue XII Dec 2022- Available at www.ijraset.com
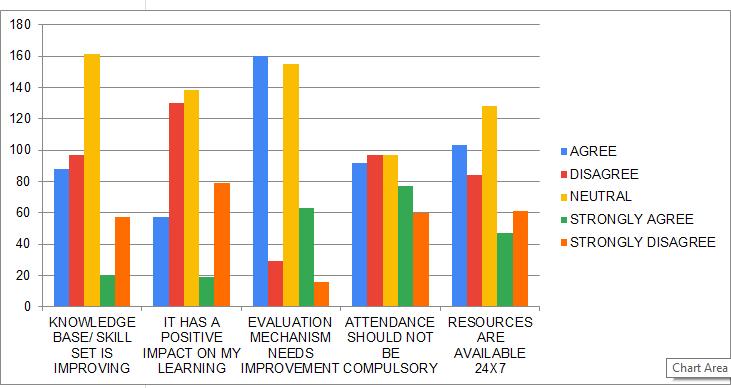
Few students believe that e-learning has improved their knowledge and other skills. Majority of students says that improvement is needed for evaluation mechanism. Over 30% students disagrees that attendance should not be compulsory for online classes. Most of the students don't have any opinion on availability of resources 24/7
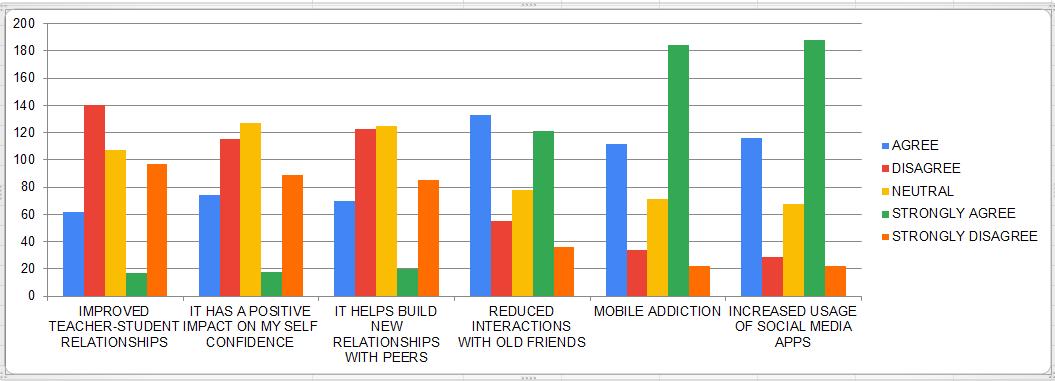
Students were asked to analyze how e-learning has impacted the personality of the students. Majority of students believes that online classes resulted in mobile addiction and increased the usage of social media apps. The overall analysis shows that the online classes has bad impact on student's personality. Around 60% students agrees that it has reduced interactions with old friends.
After cleansing and preprocessing the data, feature selection was done. To achieve the best accuracy, we took 22 columns out of 35 columns. Then, 2 columns Sum and Final Result were added. For the purpose of determining if the performance has improved (1) or not, we computed the total count for each row and saved it in the Sum Column (0). The 26–50 range was used to evaluate performance. By summing the allowable minimum and maximum values for each column, we arrived at this range. By utilising the constraint that the aggregate must be larger than 26 and less than 50, we were able to determine if the performance had improved or not (0).
ISSN: 2321-9653; IC Value: 45.98; SJ Impact Factor: 7.538 Volume 10 Issue XII Dec 2022- Available at www.ijraset.com
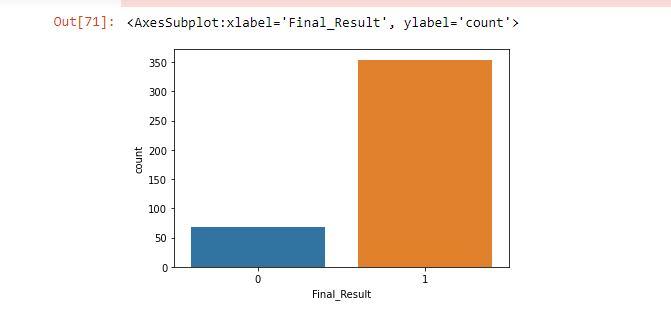
On the x-axis of the preceding graph, we can see the Final Result feature, and on the y-axis, the count feature. In this, 0 indicates that student performance has not improved, while 1 indicates that it has. We can also see that 0 (Not Improved performance) is less, i.e. 59, while 1 (Improved performance) is above 350 (count) (count).
It makes use of advanced statistical techniques and artificial intelligence to tap the potential of the analysed data to create predictions about the future. Therefore, using the provided dataset as a basis, we will make predictions in this.
To achieve the best accuracy, we used feature selection on our dataset, removing 22 of the dataset's 35 columns. We must first divide the data before making a prediction.
In order to split the data we need to import more libraries which are required for splitting data. Once we have imported libraries next we will split the data.
Fig. 7
In this code y value that is output or prediction we need to find or make. We are dropping Final_Result. After this we are splitting the data into training and testing with test_size 0.2 that means 80% training and 20% testing. After splitting next we are going to test the accuracy of our model using six different algorithms.
1) So first we are going to see the RandomForestClassifier() algorithm.
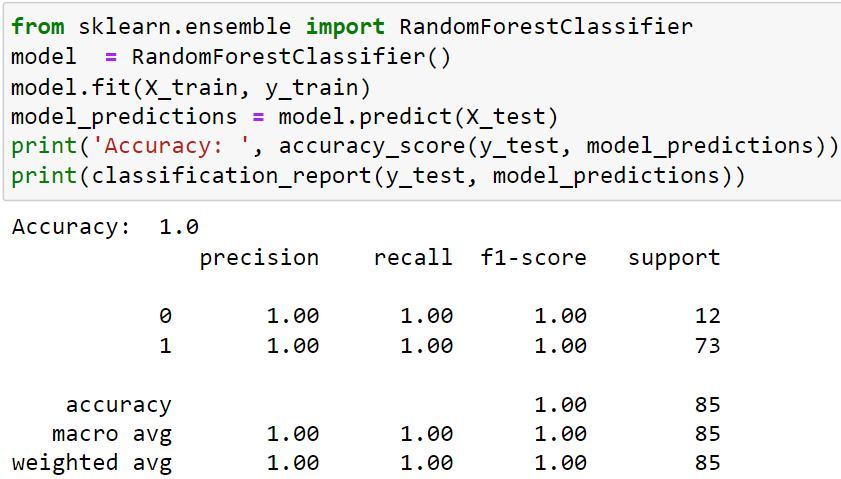
Fig. 8
We will utilise the RandomForestClassifier() technique in this code. We store RandomForestClassifire() in the model object, and then we use ".fit" (x train, y train) to fit the training data into the model. Then, in model predictions, we will forecast the test (x test),
ISSN: 2321-9653; IC Value: 45.98; SJ Impact Factor: 7.538 Volume 10 Issue XII Dec 2022- Available at www.ijraset.com
after which we will print the model's accuracy score and check the y value's accuracy (y test), and finally, we will print the classification report with both the y test and the model predictions.
We can see from the results that our model is 100% accurate.
The definition of "support" is anytime we say for 0 (Not Improved) 12 times that our answer was accurate and whenever we say for 1 (Improved) 73 times that our answer was correct.
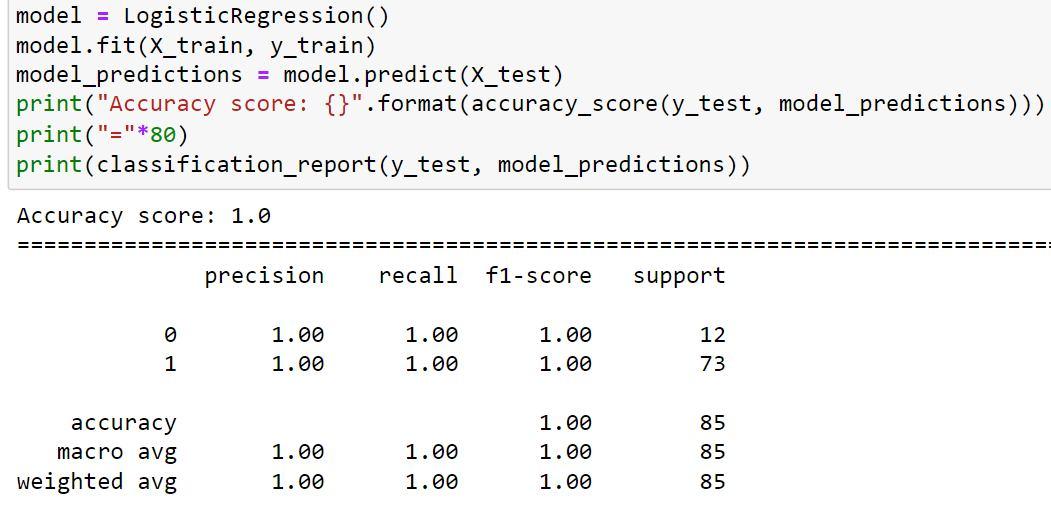
2) Next we are going to predict and see the accuracy of LogisticRegression() algorithm.
Fig. 9
We can infer from the LogisticRegression() algorithm's output that the accuracy score remained constant (100% accuracy).
3) Next we are going to predict and see the accuracy of LinearDiscriminantAnalysis() algorithm.
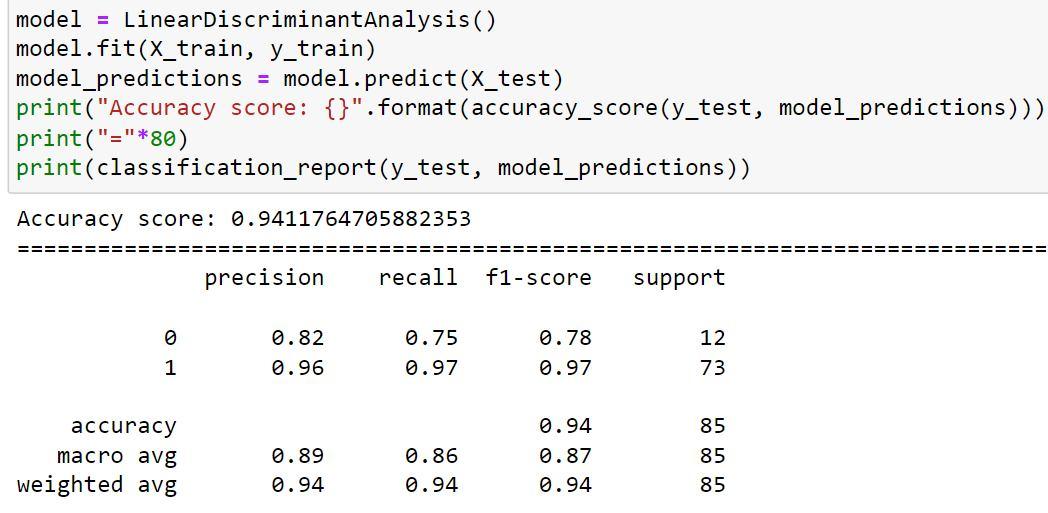
Fig. 10
By comparing the accuracy score of the LinearDiscriminantAnalysis() algorithm (accuracy 94.11%) to those of the RandomForestClassifier() algorithm (accuracy 100%) and the LogisticRegression() algorithm (accuracy 100%), we can conclude that the accuracy score has fallen.
ISSN: 2321-9653; IC Value: 45.98; SJ Impact Factor: 7.538 Volume 10 Issue XII Dec 2022- Available at www.ijraset.com
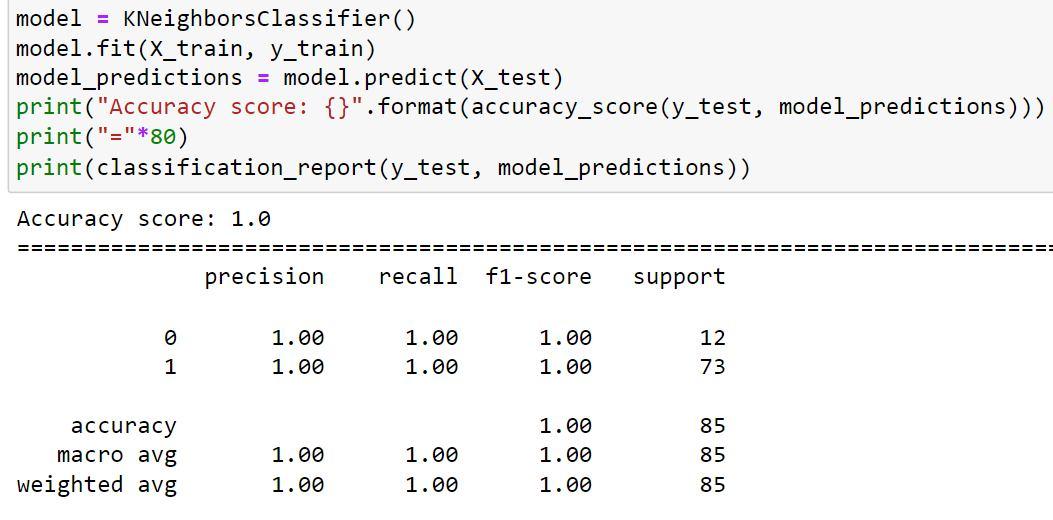
4) Next we are going to predict and see the accuracy of KNeighborsClassifier() algorithm.
By examining the KNeighborsClassifier() algorithm's output, we may conclude that the accuracy score remained the same (100% accuracy).
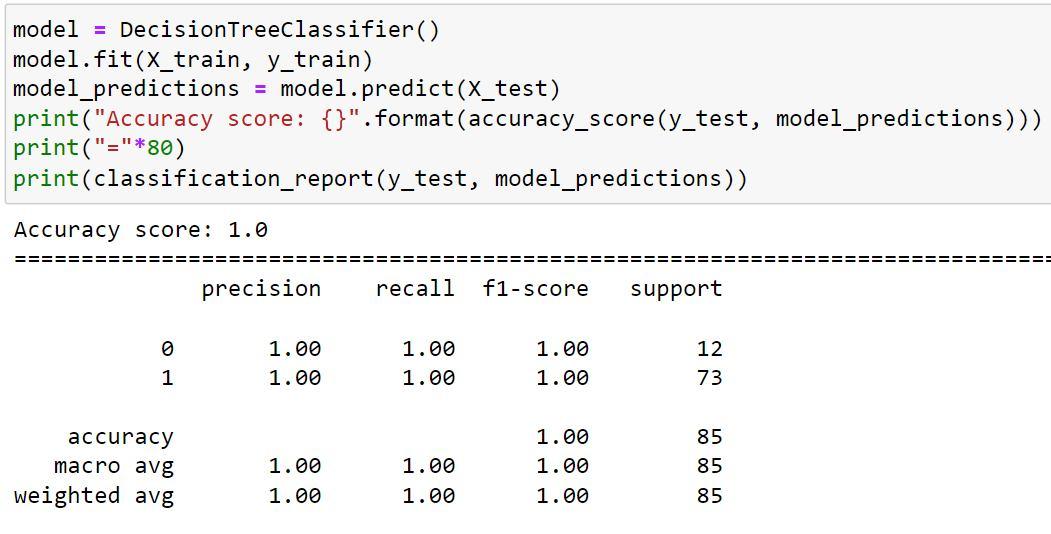
5) Next we are going to predict and see the accuracy of DecisionTreeClassifier() algorithm.
Fig. 12
By examining the DecisionTreeClassifier() algorithm's output, we may conclude that the accuracy score remained the same (100 percent accuracy).
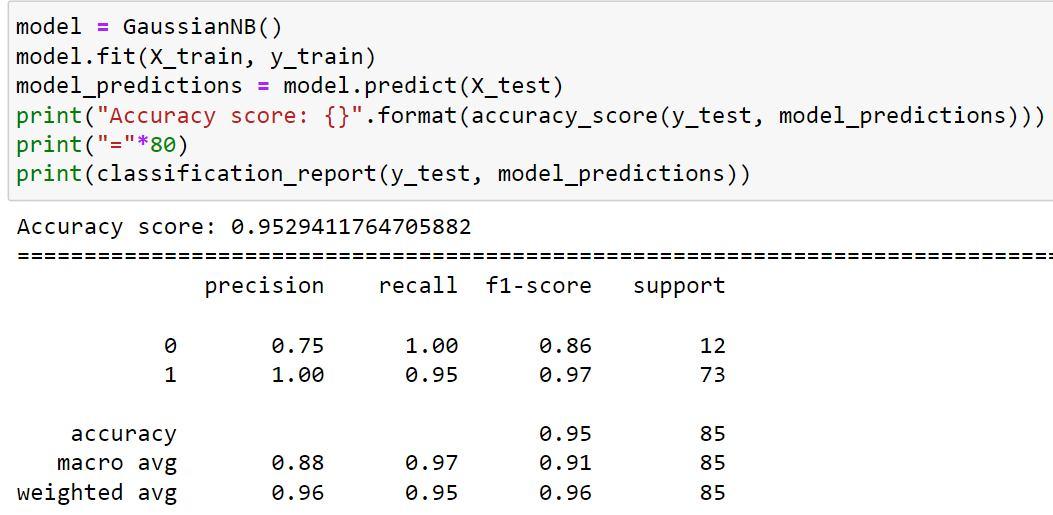
6) Next we are going to predict and see the accuracy of GaussianNB() algorithm.
Fig.13
ISSN: 2321-9653; IC Value: 45.98; SJ Impact Factor: 7.538 Volume 10 Issue XII Dec 2022- Available at www.ijraset.com
The accuracy of the GaussianNB() algorithms has increased when compared to the LinearDiscriminantAnalysis() algorithm, but it has decreased (by 95.29%) when compared to the RandomForestClassifier() algorithm, LogisticRegression() algorithm, K NeighborsClassifier() algorithm, and DecisionTreeClassifier() algorithm, all of which have accuracy scores of 100%.
ALGORITHM ACCURACY SR.NO. ALGORITHMS ACCURACY 1 RandomForestClassifier() Algorithm 100% 2 LogisticRegression() Algorithm 100% 3 LinearDiscriminantAnalysis() Algorithm 94.11% 4 KNeighboursClassifier() Algorithm 100% 5 DecisionTreeClassifier() Algorithm 100% 6 GaussianNB() Algorithm 95.29%
According to the preceding table, all four techniques, with the exception of LinearDiscriminantAnalysis() and GaussianNB(), provide 100% accuracy. 354 students' grades have increased, whereas 69 students' grades have not.
[1] Abdelsalam M.M., Ebitisam K.E., Shadi A., Hasan R. &Hadeel A. (2021). The Covid-19 Pandemic And E-Learning: Challenges AND OPPORTUNITIES from The Perspective Of Students And Instructors. Journal of Computing In Higher Education. Doi.org/10.1007/s12528-021-09274-2
[2] Dr. Wahab Ali (2020). Online and remote learning in higher education institutes: A necessity in light of Covid-19 Pandemic. Higher Education Studies. Vol.10, No.3.
[3] EdyBudiman. (2020). Mobile Data Usage On Online Learning During Covid-19 Pandemic In Higher Education. iJIM. Vol. 14. No. 19.
[4] F. Zheng, N. Abbas Khan, S. Hussain. (2020). The Covid-19 Pandemic And Digital Higher Education: The Impact Of Students’ Proactive Personality On Social Capital Through Internet Self-Efficacy And Online Interaction Quality. Children And Youth Services Review. Doi:https://doi.org/10.1016/j.childyouth.2020.1055694
[5] GhadaRefaat El Said. (2021). How Did Covid-19 Pandemic Affect Higher Education Learning Experience? An Empirical Investigation of Learners’ academic Performance at a University in a Developing Country. Advances in Human-Computer Interaction. Vol. 2021. ID6649524.
[6] Haozhe J., Atiquil A.Y.M., Xiaoqing G. & Jonathan M.S.(2021). Online Learning Satisfaction in Higher Education during the Covid-19 Pandemic: A Regional Comparison between Eastern and Western Chinese Universities. Education and Information Technologies. https://doi.org/10.1007/s1063-021-10519-x.
[7] Joana P., Ariadna L., Frances S., Marc A. & Daniel A. (2021). A Methodology to Study the University’s Online Teaching Activity from Virtual Platform Indicators: The Effect Of The Covid-19 Pandemic at UniversitatPolitecnia De Catalunya. Sustainability 2021, 13, 5177. https://doi.org/10.3390/su13095177
[8] Lokanath M., Tushar G. &Abha S.(2020). Online teaching-learning in higher education during lockdown period of Covid-19 pandemic. International Journal of Educational Research Open. 2020. 100012
[9] Maria J.S., Sandro S. (2020). The Covid-19 Pandemic as an Opportunity to Foster the Sustainable Development of Teaching In Higher Education. Sustainability 2020. 12. 8525; doi:10.3390/su12208525
[10] Marion H., Melanie S., Michaela G., Barbel K., Svenja B., & Albert Z.(2020). Digital readiness and its effect on higher education students’ socio-emotional perceptions in the context of the Covid-19 pandemic. Journal of Research on Technology in education, DOI:10.1080/15391523.2020.1846147
[11] Monika S., Ashish K., &Gursharan K. (2020). Research Perception, Motivation and Attitude among Undergraduate Students: A Factor Analysis Approach. Procedia Computer Science. Vol. 167. 185-192
[12] N. Kapasia, P. Paul, A. Roy, J. Saha, A. Zaveri, R. Mallick, B. Barman, P. Das, P. Chouhan. (2020). Impact Of Lockdown On Learning Status Of Undergraduate And Postgraduate Students During Covid-19 Pandemic In West Bengal, India. Children and Youth Services Review. doi: https://doi.org/10.1016/j.childyouth.2020.105194