10 XII December 2022 https://doi.org/10.22214/ijraset.2022.48448
ISSN: 2321-9653; IC Value: 45.98; SJ Impact Factor: 7.538

Volume 10 Issue XII Dec 2022- Available at www.ijraset.com

ISSN: 2321-9653; IC Value: 45.98; SJ Impact Factor: 7.538
Volume 10 Issue XII Dec 2022- Available at www.ijraset.com
Abstract: In order to increase reliability and prevent early failure, heat produced by electronic components and circuits must be drained. Heat sinks, fans, and other air-cooling devices, as well as alternative computer cooling methods like liquid cooling, can all be used as heat dissipation techniques. Here the paper's main focus is on a numerical analysis of temperature distribution in a GPU scenario with various input velocity circumstances, including v = 1 m/s, 3 m/s, and 5 m/s. Air and water are the two distinct fluids employed in this investigation to cool the graphics card. An analysis of the fluid flow and heat transfer simulation of a desktop graphics card heat sink is conducted using the CFD software ANSYS Fluent. According to the findings, cooling with water was 10% more effective than cooling with air. The outcome also shows an inverse correlation between the graphic card chip's intake velocity and temperature. The rate of heat transfer to the heat sink increases as the inflow velocity rises which is helped by the convection.
Keywords: GPU, Convection, Conduction, Heat Transfer, Steady state.
In recent years, the quantity of heat created by PCs or other electronic devices has increased in tandem with improvements in the performance of GPU, CPU, RAM, and other components. To increase reliability and prevent early failure, heat produced by electronic devices and circuits must be dissipated. (Tasawur et al, 2010) As temperature increases, the performance of the graphics card causing a drop in graphic performance and in an extreme case, causing a computer operation to stop (Zambri et al, 2019). So, in order to prevent thermal throttling and increase the efficiency of the graphic card different heat sinks were developed for air cooling based upon the power consumed and the purpose used for. In order to address the problem of the graphics card overheating, a computational fluid dynamics (CFD) simulation is run to examine and monitor the transfer of heat flow within a computer case and heat sink.
The heat flow happens due to Conduction and Convection mainly. Conduction is the process whereby energy is transferred from the more energetic material particles to the nearby, less energetic ones as a result of particle contact Convection is the method of transferring heat from a solid surface to the nearby moving liquid or gas (Yunus, 1997). In this scenario the conduction happens when chip transfers heat to the heat sink by surface contact and convection when fluid flows and absorbs the heat. (Martin, 1995) created a multimode heat sink for an electrical module. In specifically, the rig was positioned so that conduction or convection cooling could take place inside an electronic module mounting rack.

Many researches have done on cooling systems for different types of graphic card using different types of cooling system. A few of them are According to study (Zambri et al, 2019) the rate of heat transmission was boosted by modifying the form and size of the heat sink. Different heat sinks of various types were created to cool the graphic card, and when tested at various temperatures, one of the designs was shown to be more effective than the others at drawing heat away from the graphic card. Convection develops over time, the heat generated by the graphics card initially targets the region around it. Later, using a convection mechanism, the heat steadily moved to the top section of the CPU case.
In another study (T. Abbas, 2010) when using the pipe method, you get high temperature readings and maximum temperature enhancement, while using the thermoelectric cooler method results in less temperature enhancement, a slower process, and a processor temperature that is roughly constant. When using the water-cooling method, you get a large heat transfer rate and maximum temperature enhancement. The results of this inquiry show that the thermoelectric cooler technique is the best approach since the processor temperature is stable and the operating temperature increases are minimal, but the procedure takes a long time because of the system's exhaust.
ISSN: 2321-9653; IC Value: 45.98; SJ Impact Factor: 7.538 Volume 10 Issue XII Dec 2022- Available at www.ijraset.com
Study (Baojun, 2020) shows that thermal control is a challenge that can only be solved by liquid cooling technology. It is possible to identify the direction of development of liquid cooling technology by comprehending and studying the function, principle, features, and applications of the technology. The future of will be highly open for liquid cooling technologies.
The methodology in the paper is divided into several parts but mainly into four parts. Firstly, the graphic card is modelled into the Autodesk Inventor. Secondly, it is defined by encloser. Thirdly, it is meshed using ANSYS software and finally with applying boundary conditions to analyse on ANSYS Fluent.
The design for graphic card is divided into two sections one for fluid as air and the other as water A graphic card which was similar in the market was chosen for analysis. GT 710 inspired model was modelled on the graphic card with similar dimensions but reduction in the number of fins and the increasing the distance between the fins. This graphic card acts as an entry level and daily driver for many.
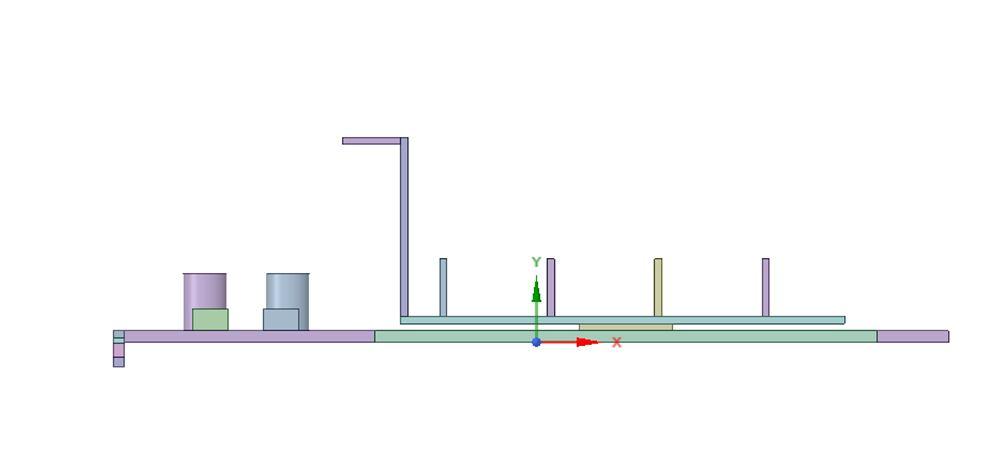
1) Fluid as AIR: This type of graphic cards heat sinks are equipped with fins. Fins are expanded surfaces or fins are typically employed to improve heat transmission between the primary surface and the surrounding fluid (Ambarish, 2019).
Figure I. Isometric View
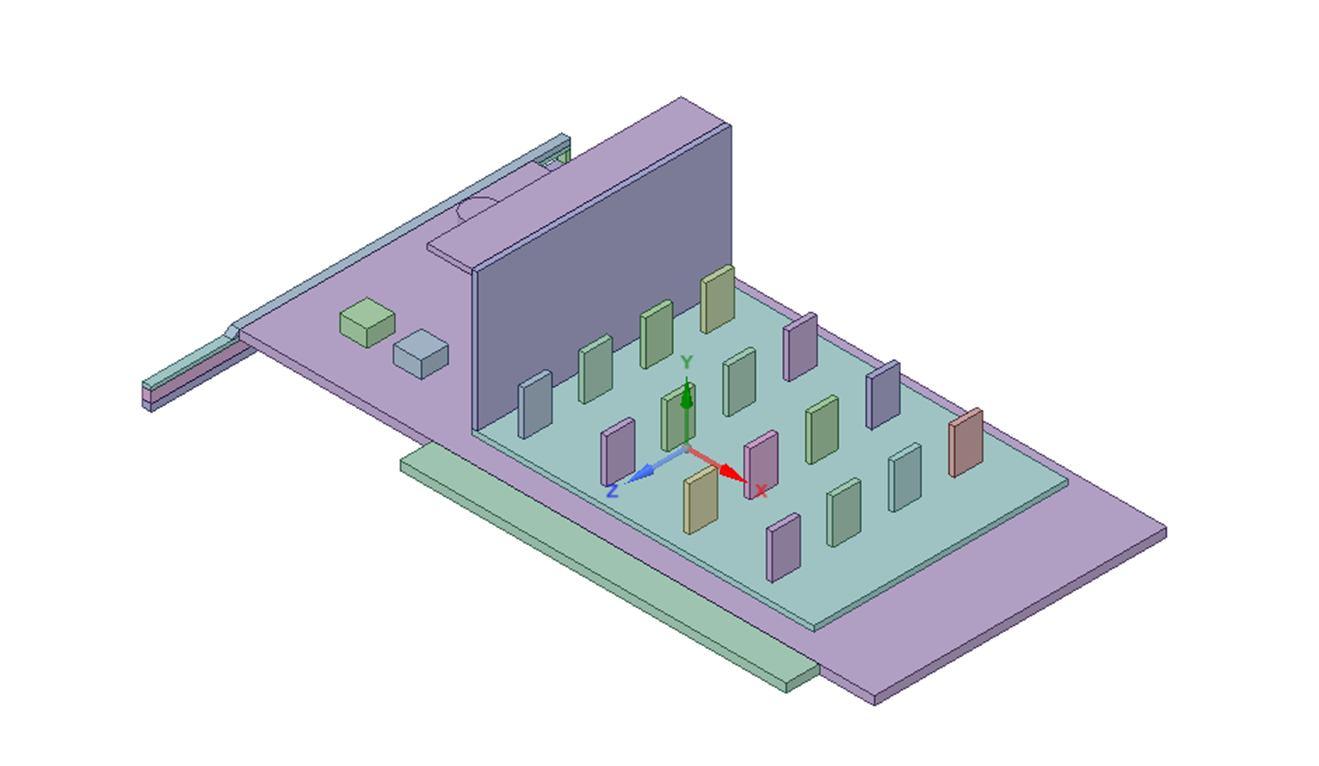
Figure II. Side View
Table I. Design specifications of the GPU Part Dimension (mm)
Length of base plate 115
Width of base plate 59
Length of the heat sink 62
Width of the heat sink 46
Length of the chip 13


Width of the chip 13
Height of the chip 1
Length of each fin 5
Breadth of each fin 1
Height of each fin 7

ISSN: 2321-9653; IC Value: 45.98; SJ Impact Factor: 7.538 Volume 10 Issue XII Dec 2022- Available at www.ijraset.com
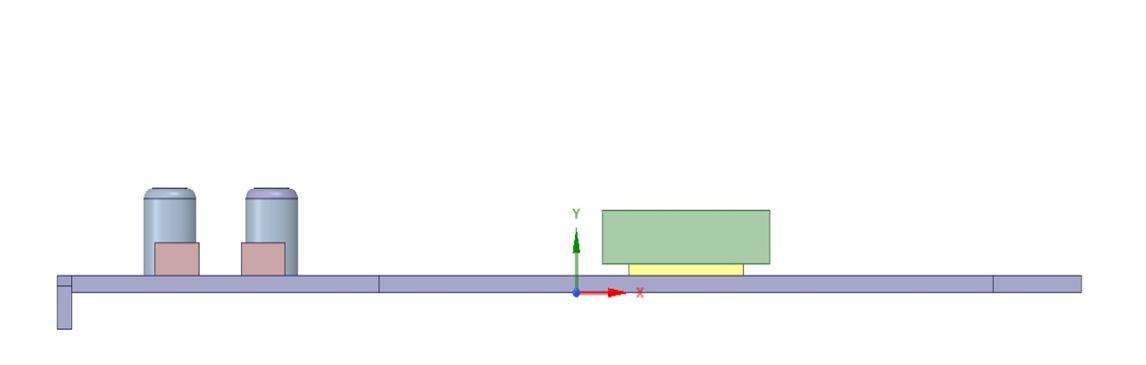
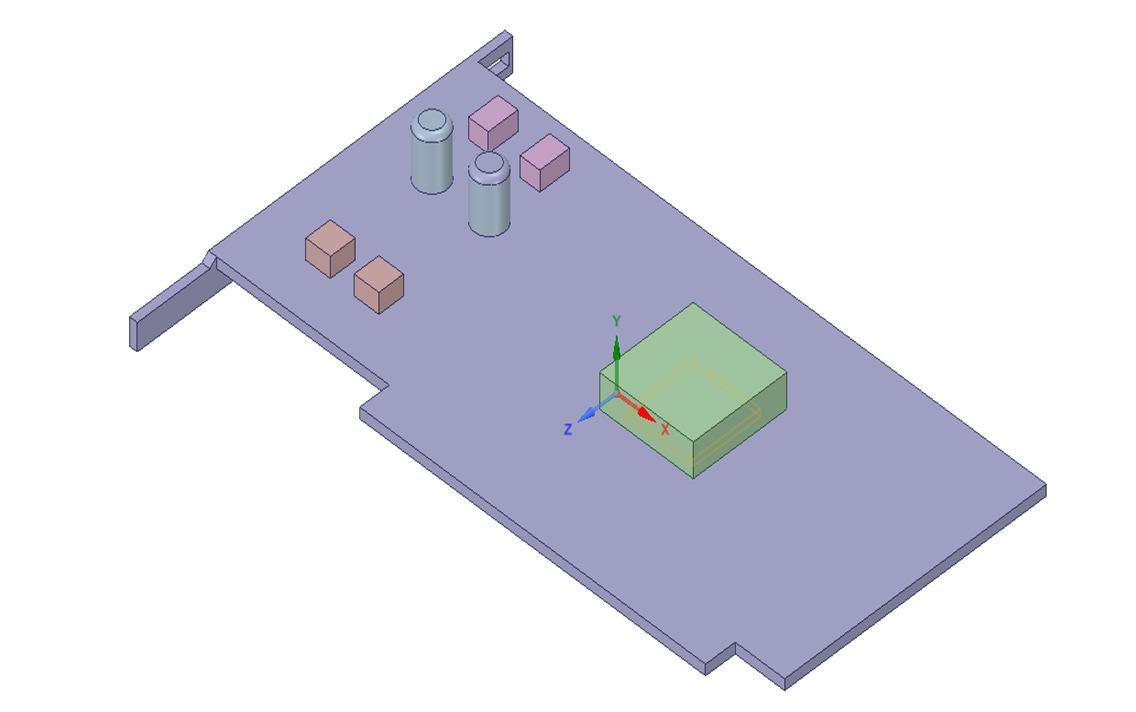
A type of metal block known as a water-cooling block, which is constructed of copper or aluminium and connects with the CPU to absorb heat from the CPU, has an internal water circuit (Baojun Liu, 2020) As a result, this component serves the same purpose as air conditioning.
Table II. Design specifications of the GPU
Part Dimension (mm)
Length of base plate 115
Width of base plate 59
Length of the heat sink 62
Width of the heat sink 46
Length of the chip 13


Width of the chip 13
Height of the chip 1
Length of copper block 19
Breadth of copper block 19
Height of copper block 5
In order for the material containing the bodies of a model to be assigned to something in the ANSYS Mechanical programme, such as a gas or fluid, the bodies of the model must be enclosed using the Enclosure feature. The feature generates a frozen enclosure body around the input bodies either all of them or just a few of the model, then chops the bodies out of the enclosure. When the frozen enclosing body is selected, the Fluid/Solid Property, which can be seen in the Details View, will be set to fluid


ISSN: 2321-9653; IC Value: 45.98; SJ Impact Factor: 7.538 Volume 10 Issue XII Dec 2022- Available at www.ijraset.com


One of the most crucial elements in running a precise simulateon is meshing. A mesh is composed of elements that have nodes coordinate positions in space that might change depending on the element type that symbolise the geometry's form. Uneven forms are difficult for a simulation solver to deal with, but cubes and other standard shapes make it much happy. Meshing is the process of transforming amorphous forms into "elements” (Marisa et al, 2021)
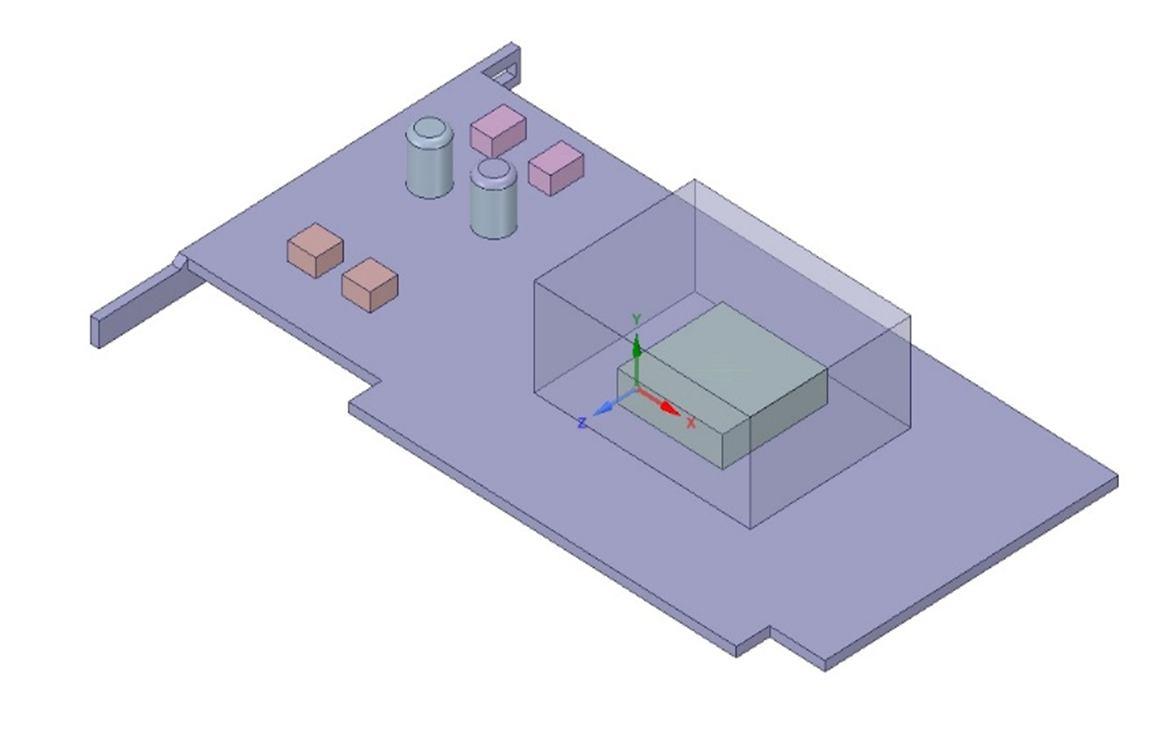
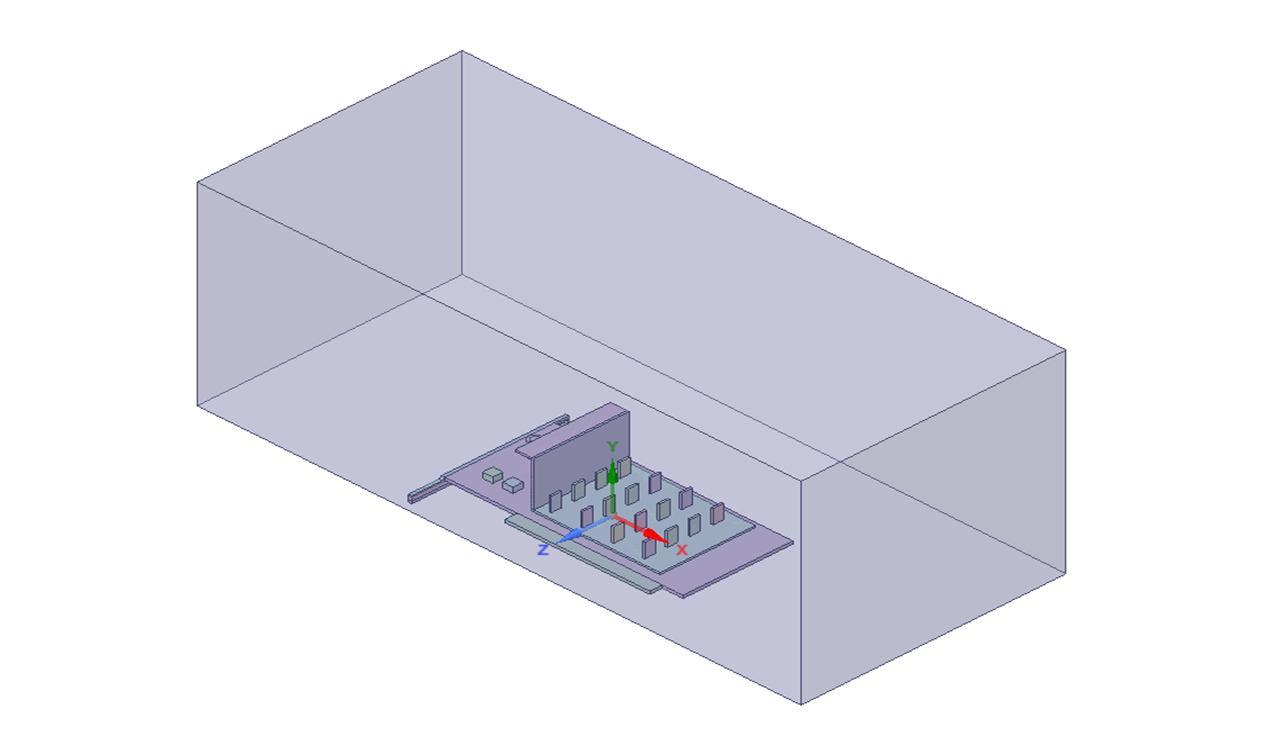
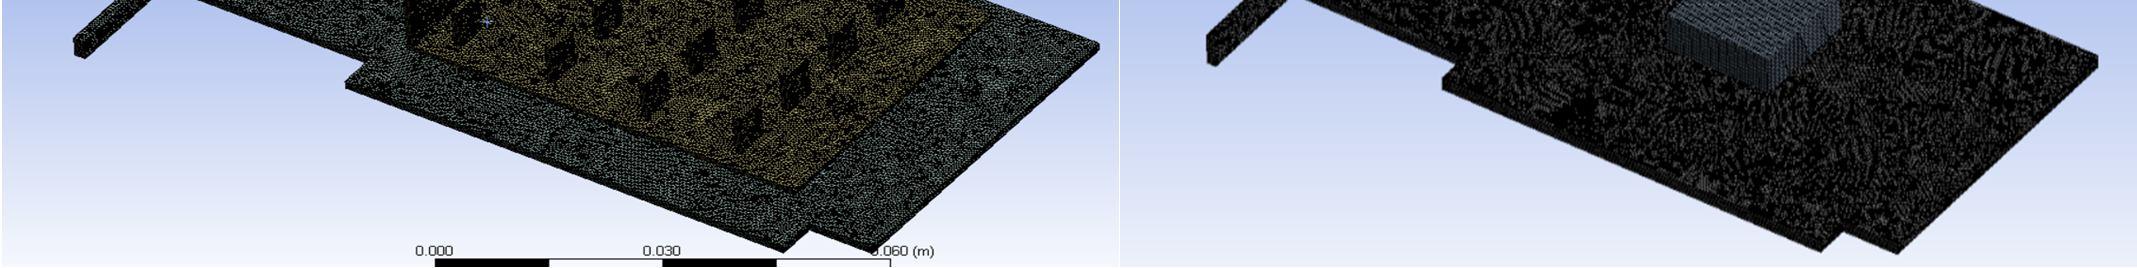
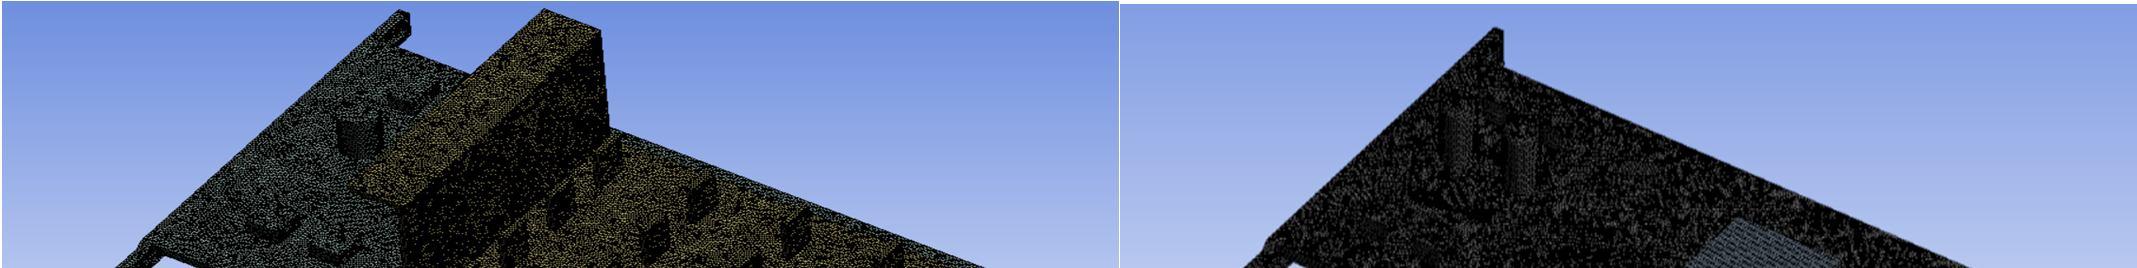
Figure VI. shows the meshing of the whole system, GPU, heat sink and internal structure of GPU. The cells are more concentrated on the critical area such as heat sink. The type of mesh used is triangular meshing, and the element size being 1.683 x 10⁻⁴ and number of elements being 5864013 and figure VII. shows the meshing of the whole system, GPU, cooling block and internal structure of GPU. The cells are more concentrated on the critical area such as copper block. The type of mesh used is triangular meshing, and the element size being 3.581 x 10⁻⁴ and number of elements being 766759.
The most intriguing of the materials used for a GPU is probably silicon, which is layered with tantalum and palladium transistors and capacitors for better storage on a smaller chip. RAM cards are made of a dizzying array of materials, including copper, boron, cobalt, and tungsten, just to name a few (Andrew, 2018).
While many different materials can be used to manufacture a graphic card the material which is used for the graphic card analysing here is for GPU being silicon, backplate/baseplate (acts as an additional cooling device that will reduce temperatures by drawing heat away from the graphic card) is steel , fins(air-based cooling) is aluminium due to excellent corrosion resistance, high thermal conductivity, and ease of casting, machining, and forming (Alaco, 2005) and water block(water-based cooling) is copper due to excellent conducting property of heat and electricity.
ISSN: 2321-9653; IC Value: 45.98; SJ Impact Factor: 7.538 Volume 10 Issue XII Dec 2022- Available at www.ijraset.com
Table III. Material used for different parts of graphic card Part Material used GPU Silicon Backplate/Baseplate
Steel
Fins (air-based cooling) Aluminium Cooling Block (water-based cooling) Copper
TDP stands for thermal design power or thermal design profile, depending on who you ask. The TDP value indicates the maximum amount of heat that a computer processor, like a CPU or GPU, may produce in watts. It is frequently employed as a fundamental power consumption indicator as well (Scharon, 2022), More cooling will be needed the higher the TDP, whether it be through passive technologies, fan-based coolers, or liquid platforms Even if thermal design power, which is really measured in watts, is used in our 50W TDP GPU example, doesn't mean the CPU will require 50W of power from the power supply. Manufacturers use TDP as a notional amount for cooling systems to be developed around rather than displaying what the component would need in terms of raw input. It's also extremely unlikely that you will ever exceed a CPU or GPU's TDP unless you use intensive programmes and processes (Rich, 2016).
Total heat energy generated per volume by the GPU is given by = and where TDP is taken as 50W and Volume of the GPU to be 13x13x1 mm3. Upon calculating we get w = 2.95e+08.
The air flow is made up of an air intake and a pressure outlet, each with various inlet velocity speed. Assuming continuous flow and incompressibility throughout the flow, the air's density is considered to be constant at 1.225 kg/m3 when fluid is air and water density to be 1000 kg/m3. It is believed that the air is 27 °C, the optimal room temperature. It is believed that the air has an ideal atmospheric pressure of 1,01,325 Pa. In order to calculate the flow type of the fluid i.e., laminar or turbulent we calculate ‘Reynolds number’ Higher the Reynolds number greater the tendency that flow is turbulent (Yunus et al, 1997). Reynolds number is Re defined (Incropera et al, 2007) as Re = ∗ ∗ (1)
Were, ρ = density of fluid v = velocity of fluid L = characteristic length (Length of the graphic card) μ= dynamic viscosity of the fluid
When calculation of Reynolds number is done for fluid as water with initial conditions as ρ = 1.225 Kg/m3 , μ = 1.7894 x 10⁻⁵ Kg/ms, L = 0.115 m, Vmax = 5 m/s we get Re = 39,363. Similarly, for fluid as water with initial conditions as ρ = 1000 Kg/m3 , μ = 1 x 10⁻³ Kg/m-s, L = 0.019 m, Vmax = 5 m/s we get Re = 95,000. Hence for both the Reynolds number being greater than 4,000 we can conclude as turbulent flow (Yunus et al, 1997). Hence, we us the k-epsilon (2 equation). For forecasting flow behaviour in regions far from the wall, the k-epsilon model is ideal (Autodesk, 2019).
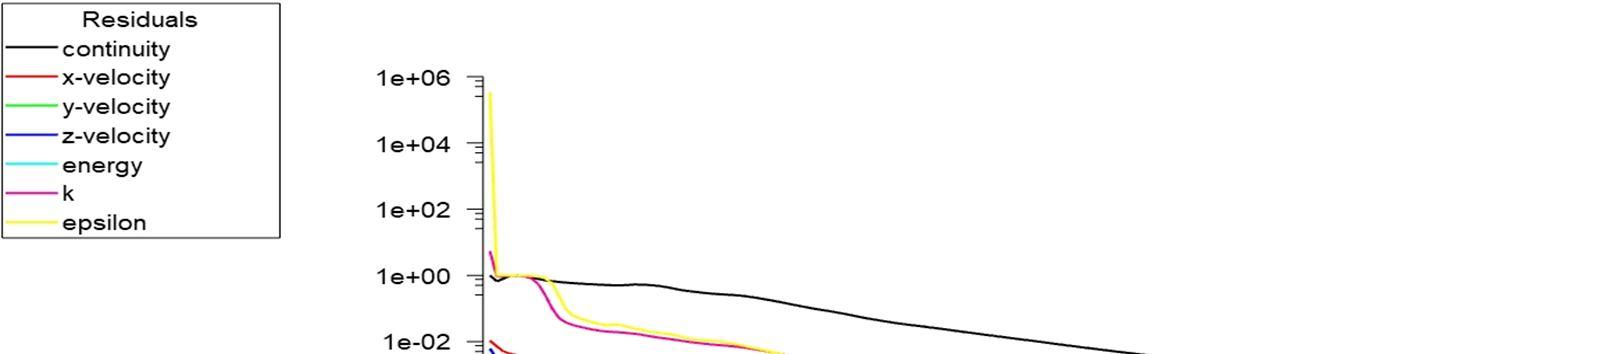
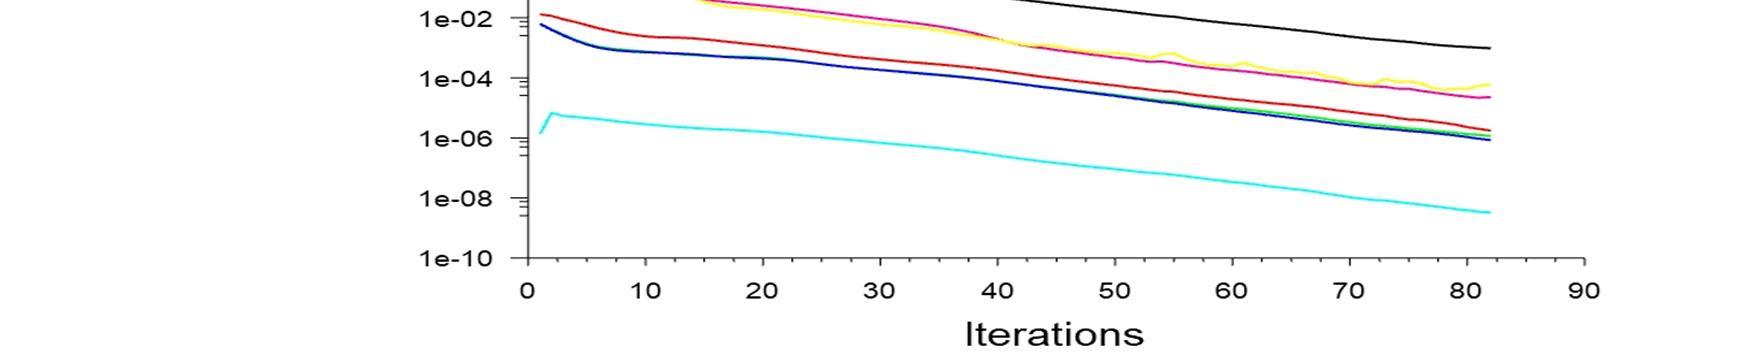
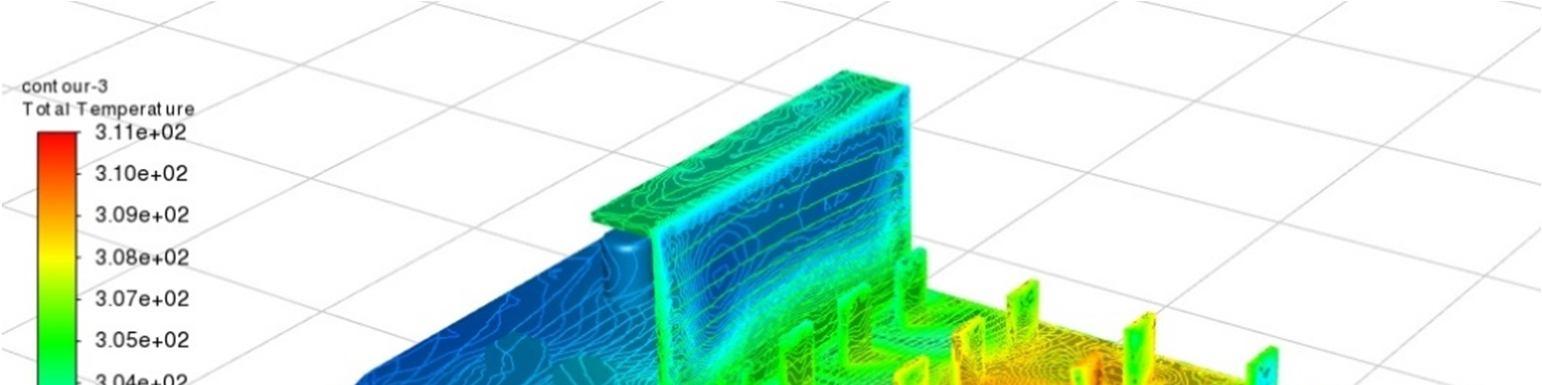
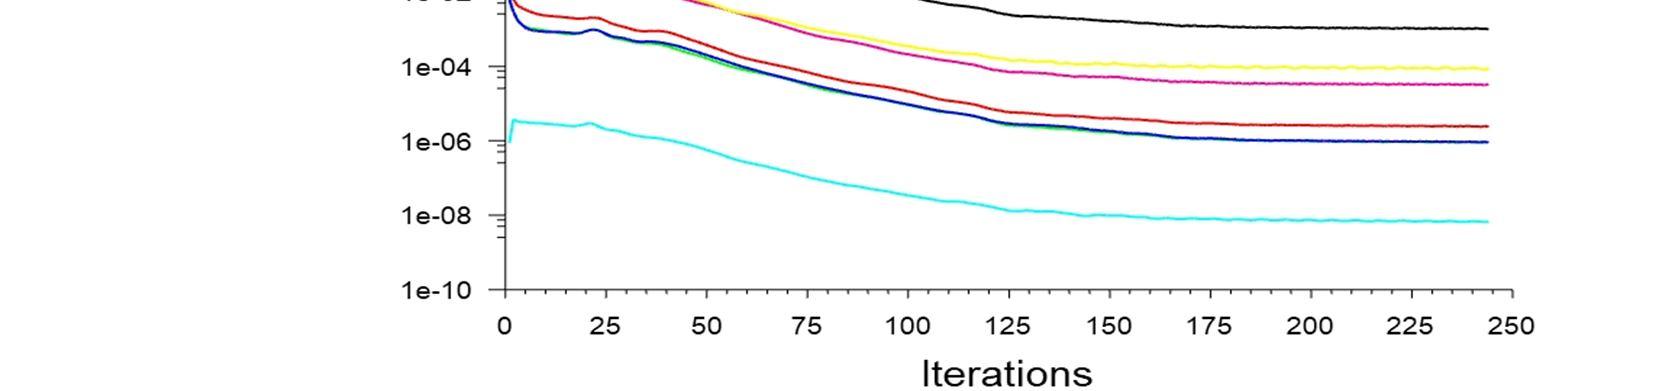
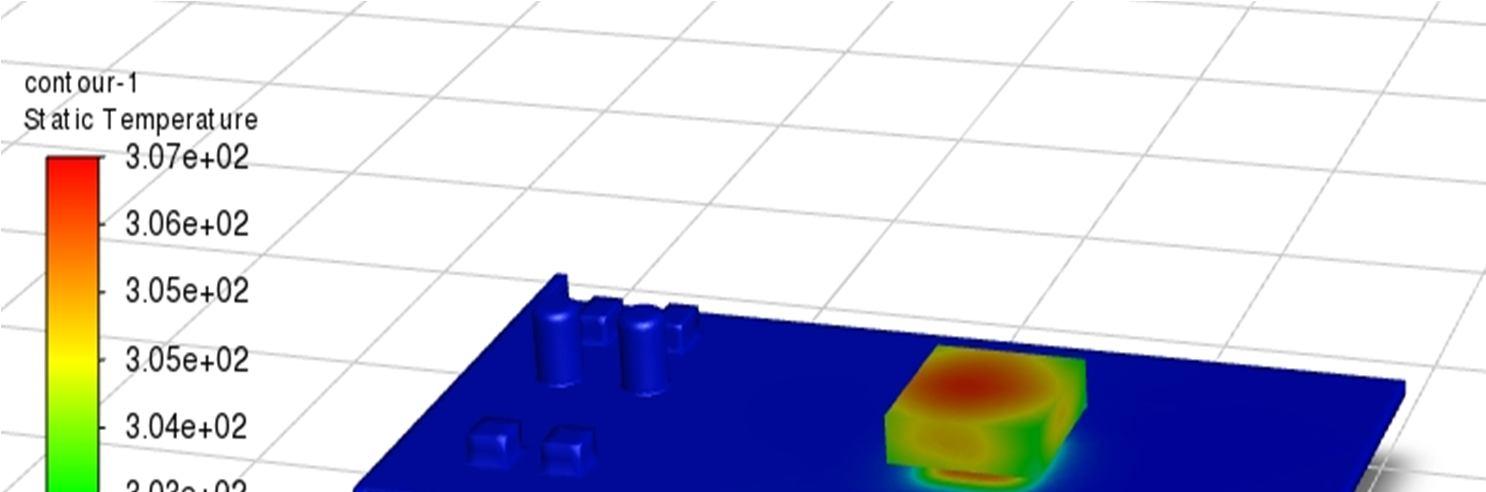
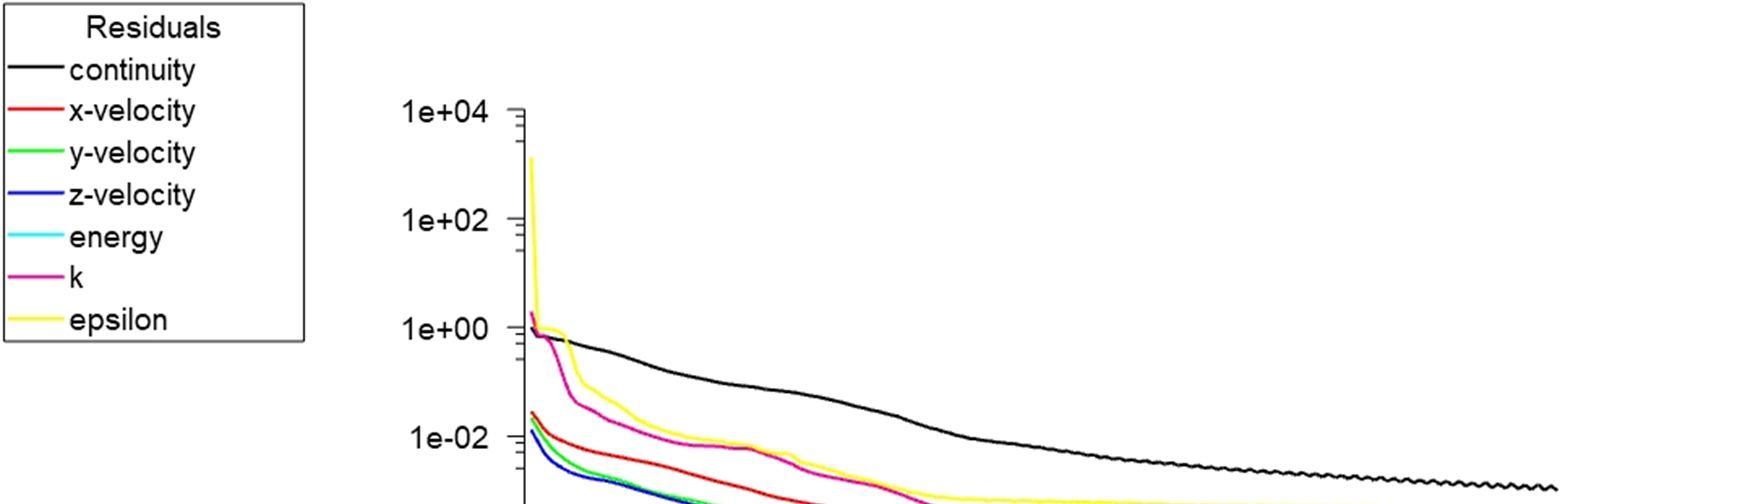
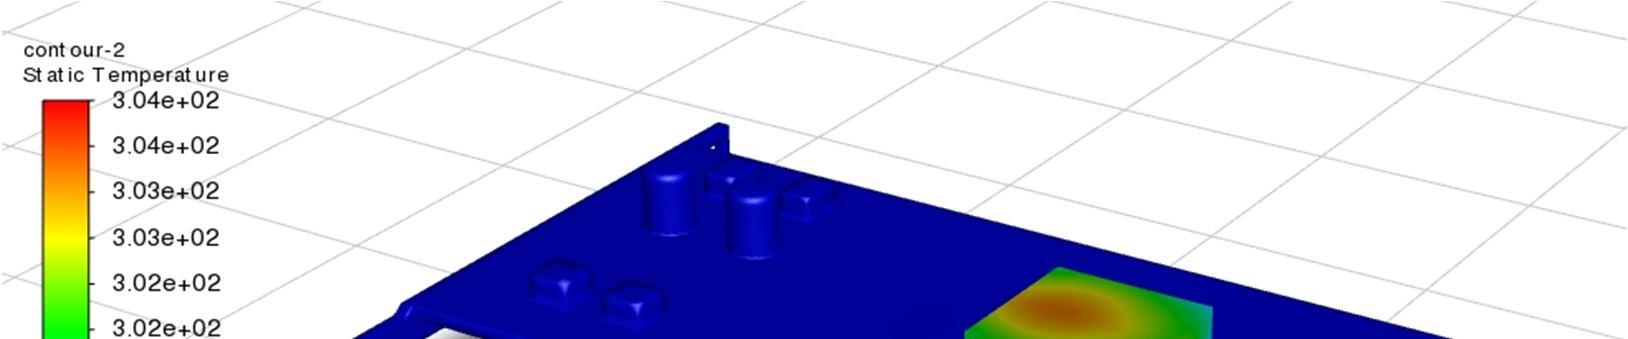
Simulation was done for 3 cases based on the various inlet air velocity, which is dependent on the cooling fan. From the figure IX, we can observe the iterations converge for 85 and iterations tend to increase as further velocity is increased. The iterations take time to converge which can be seen in figure XI where 125 iterations are taken and in figure XIII, we can see about nearly 250 are taken. How many times the flow equations will be solved before moving on to the following time step is indicated by the number of iterations per time step (Satyajeet, 2018). The maximum temperature on the graphic card can be seen on the heat sink central part where the chip is in surface contact with the heat sink.
ISSN: 2321-9653; IC Value: 45.98; SJ Impact Factor: 7.538 Volume 10 Issue XII Dec 2022- Available at www.ijraset.com
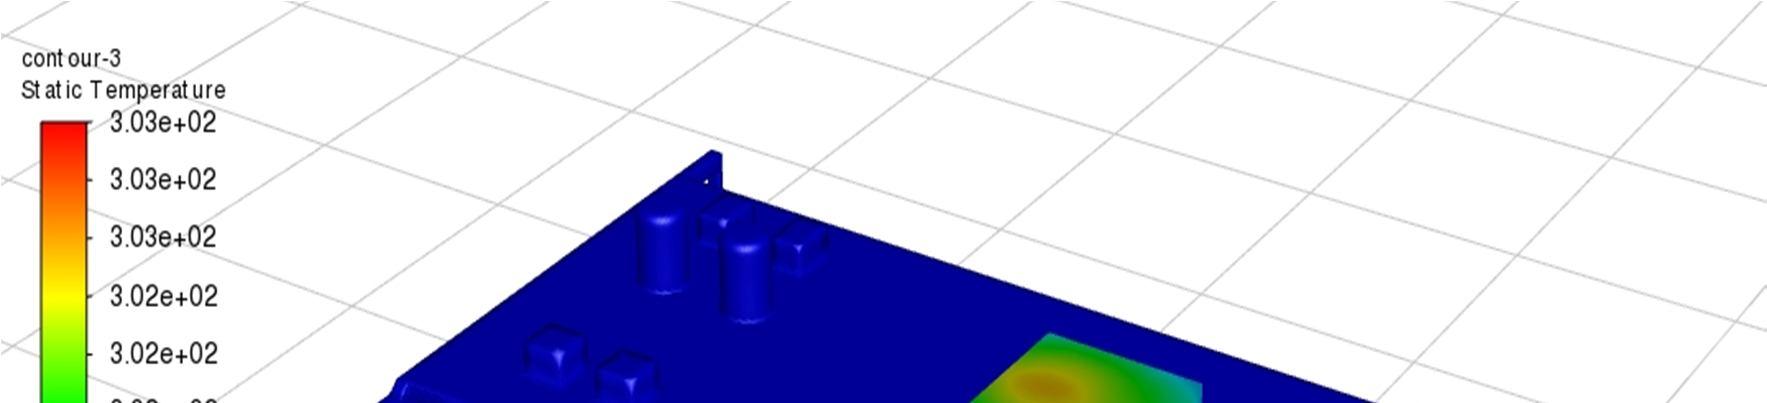
From figure X, we see the maximum temperature about 319K (the red coloured region) when v = 1 m/s and from figure XII, we see 311K for when v = 3 m/s and figure XIV, we see 309K for v = 5 m/s. From this we can say that as the inlet velocity is increased there is a decrease in temperature drop due to increase in convection heat transfer.
1) CASE 1:- V = 1 m/s
2) CASE 2: - V = 3 m/s.
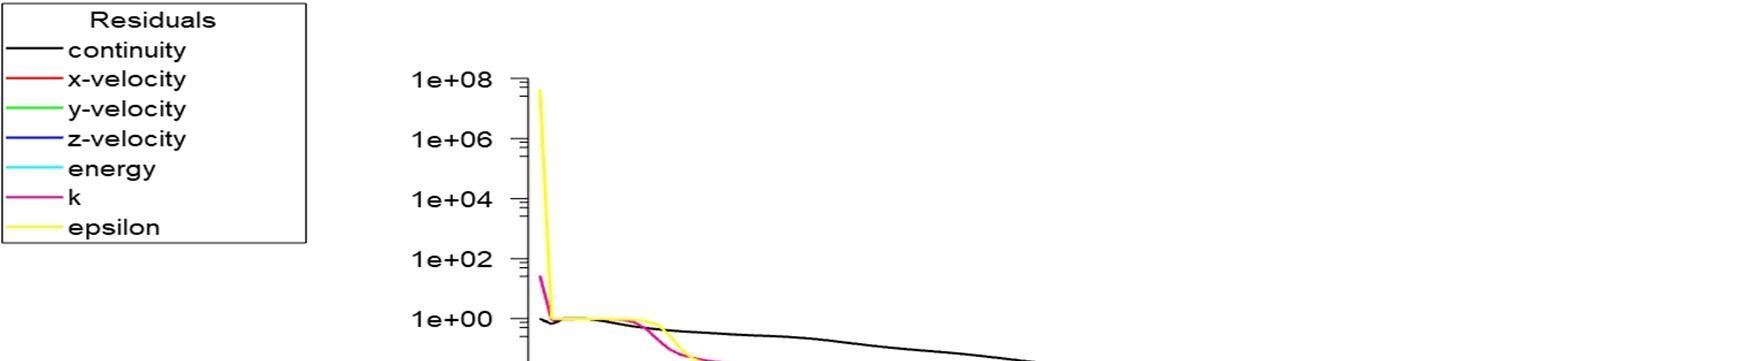
Figure IX. Iterations performed when v=1m/s.
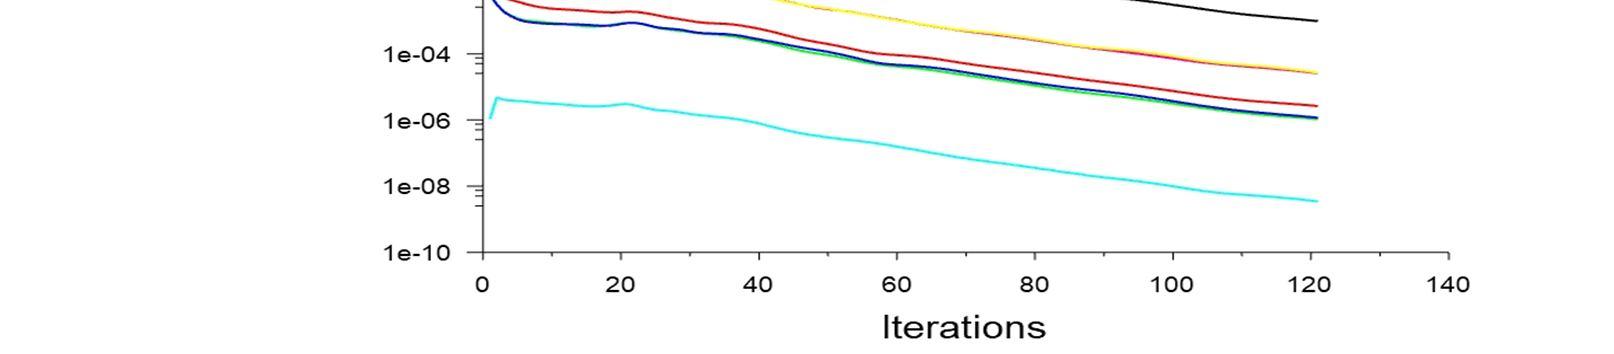
Figure X. Temperature distribution over the graphic card
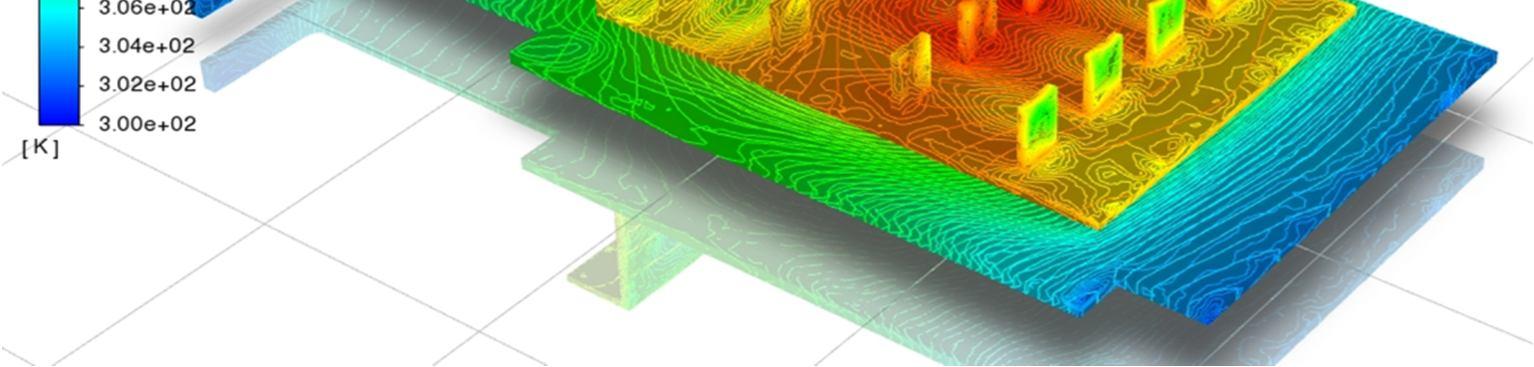
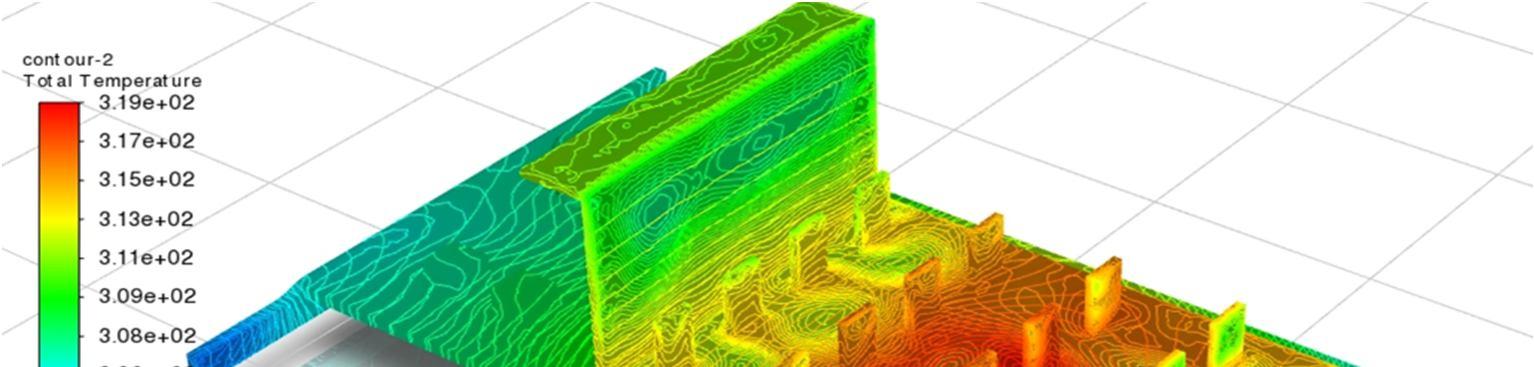
Figure XI. Iterations performed when v=3m/s.
ISSN: 2321-9653; IC Value: 45.98; SJ Impact Factor: 7.538 Volume 10 Issue XII Dec 2022- Available at www.ijraset.com
Figure XII. Temperature distribution over the graphic card
3) CASE 3: - V = 5 m/s.
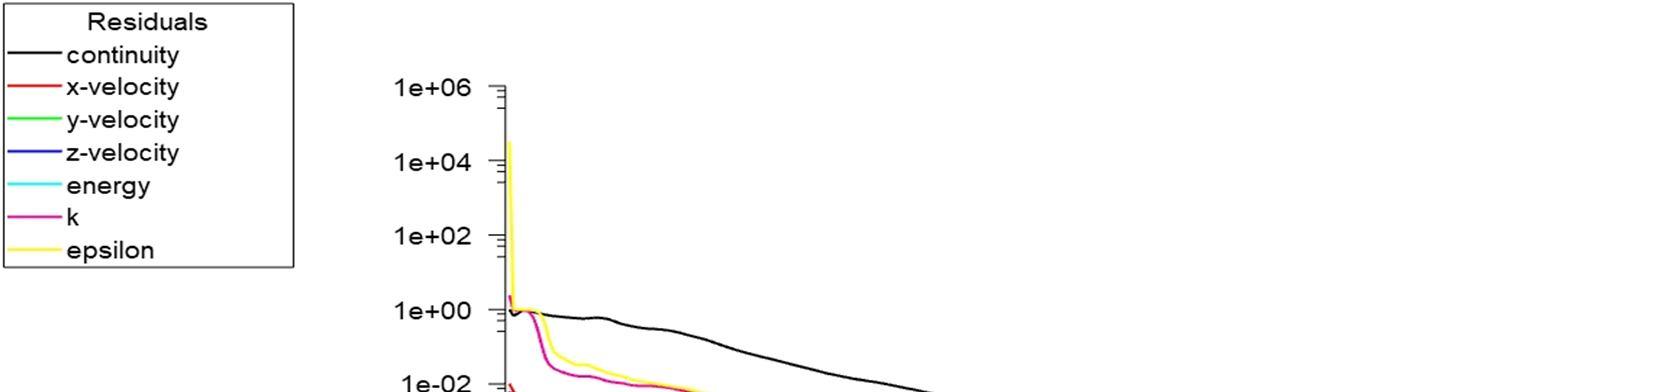
Figure XIII. Iterations performed when v=5m/s.
Figure XIV. Temperature distribution over the graphic card
ISSN: 2321-9653; IC Value: 45.98; SJ Impact Factor: 7.538 Volume 10 Issue XII Dec 2022- Available at www.ijraset.com
Simulation will be done for 3 cases based on the inlet fluid velocity, which is dependent on the cooling block
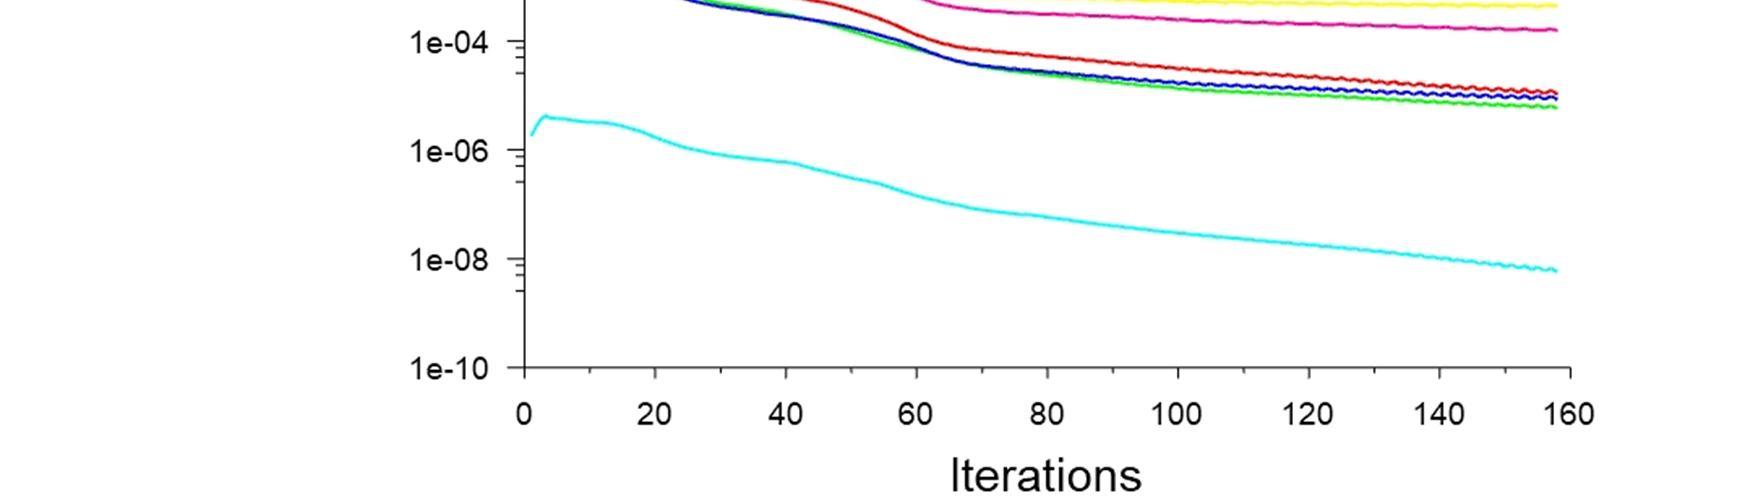
From the figure XV, we can observe the iterations converge for 160 and iterations tend to increase as further velocity is increased. The iterations take time to converge which can be seen in figure XVII where 200 iterations are taken and in figure XIX, we can see about nearly 350 are taken.
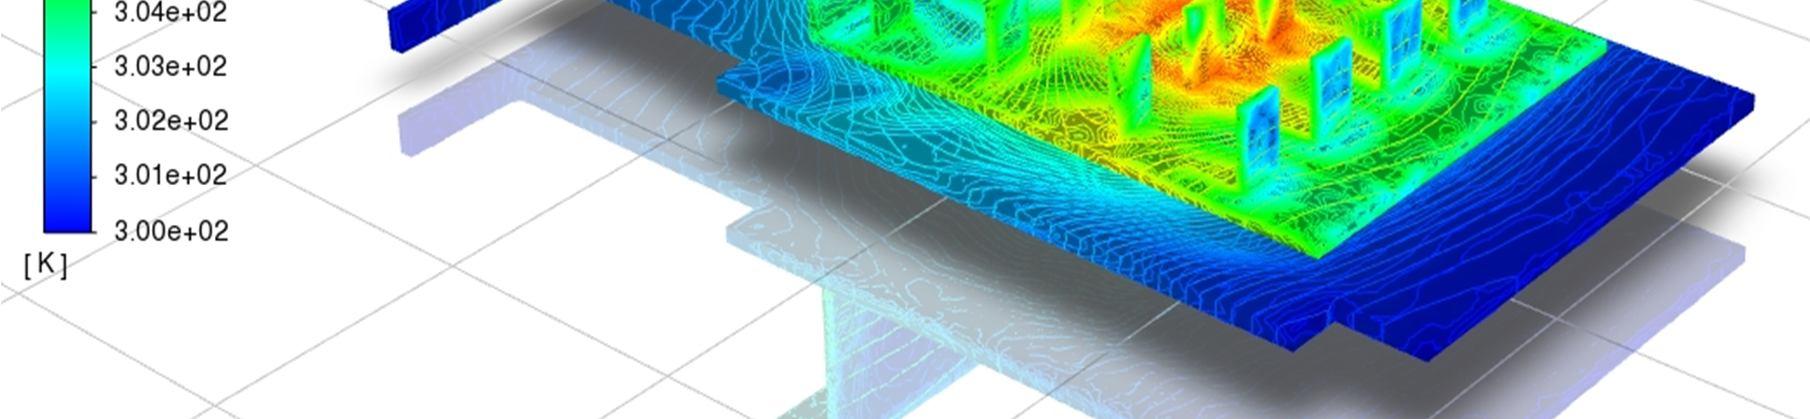
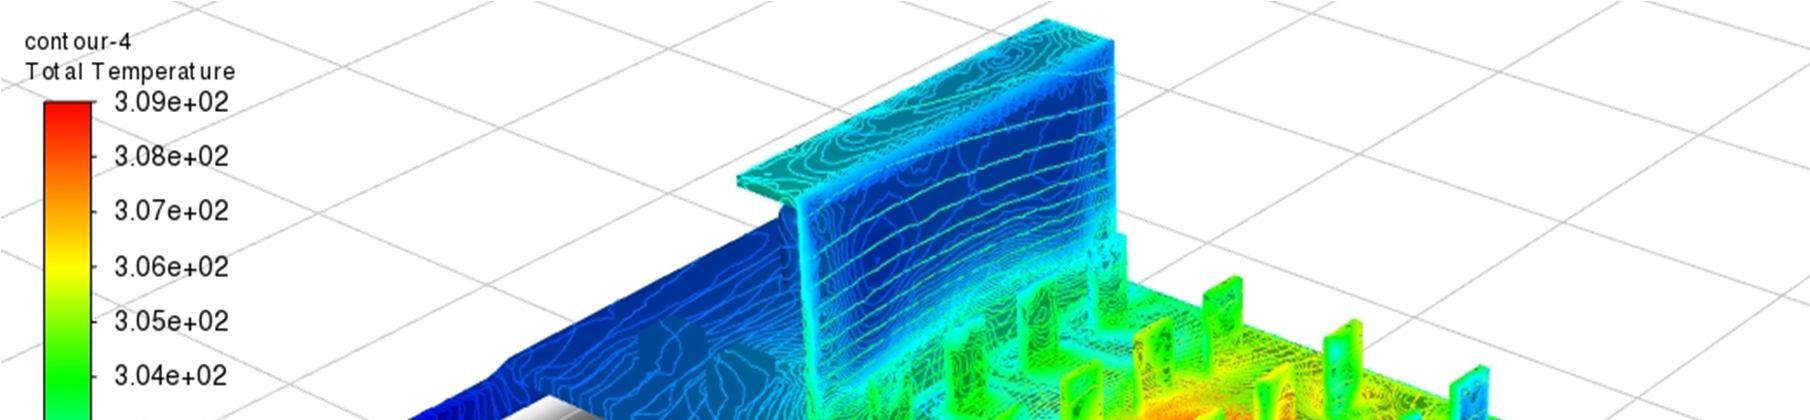
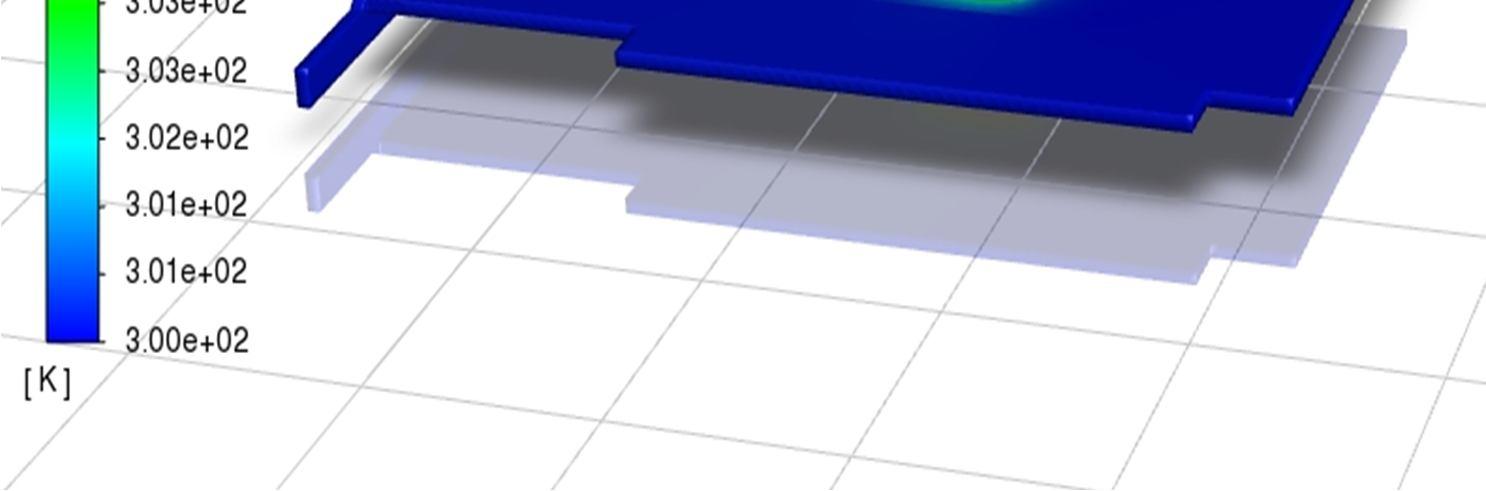
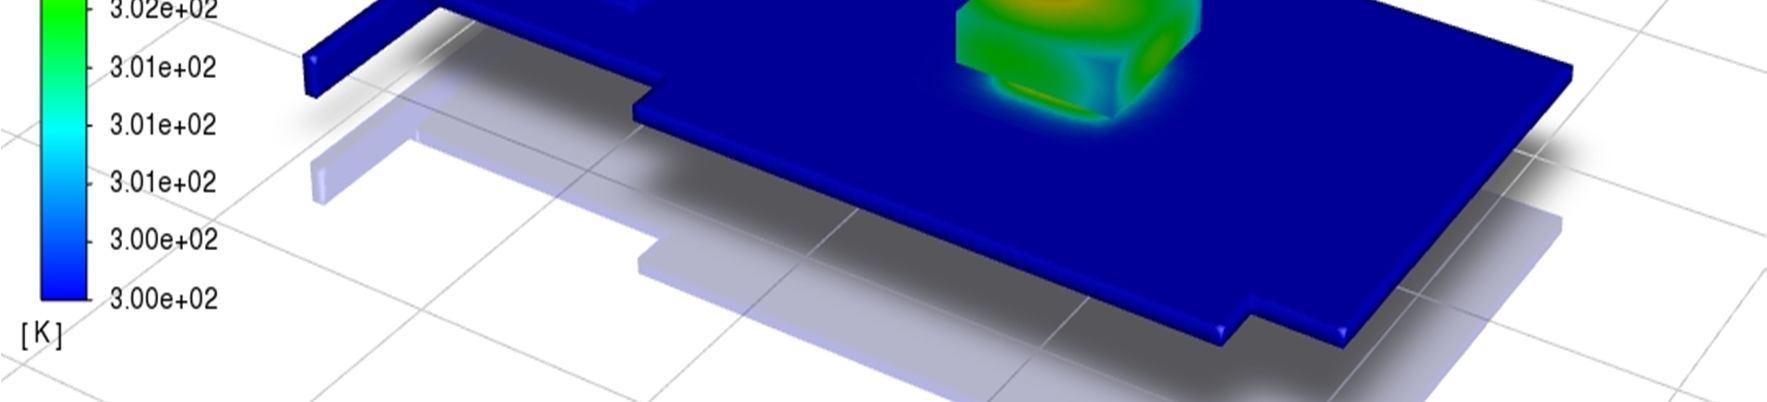
The maximum temperature on the graphic card can be seen on the cooling block central part where the chip is in surface contact with the it. From figure XVI, we see the maximum temperature about 307K (the red coloured region) when v = 1 m/s and from figure XVII, we see 304K for when v = 3 m/s and figure XX, we see 303K for v = 5 m/s. From this we can say that as the inlet velocity is increased there is a decrease in temperature drop due to increase in convection heat transfer.
1) CASE 1: - V = 1 m/s.
Figure XV. Iterations performed when v=1m/s.
Figure XVI. Temperature distribution over the graphic card
ISSN: 2321-9653; IC Value: 45.98; SJ Impact Factor: 7.538 Volume 10 Issue XII Dec 2022- Available at www.ijraset.com
2) CASE 2: - V = 3 m/s.
3) CASE 3: - V = 5 m/s.
Figure XVII. Iterations performed when v=3m/s.
Figure XVIII. Temperature distribution over the graphic card
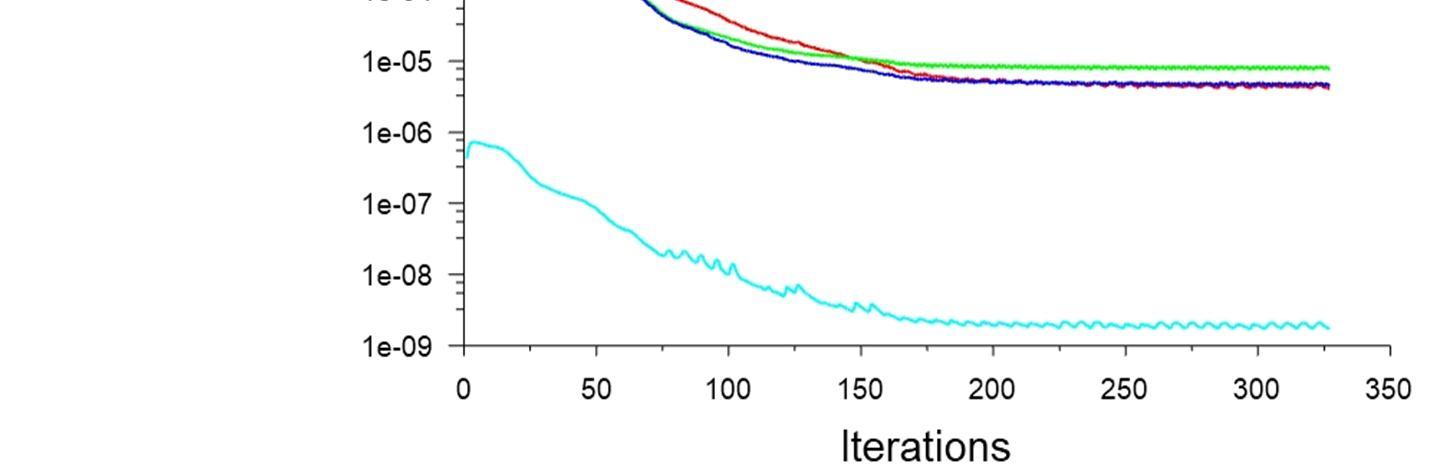
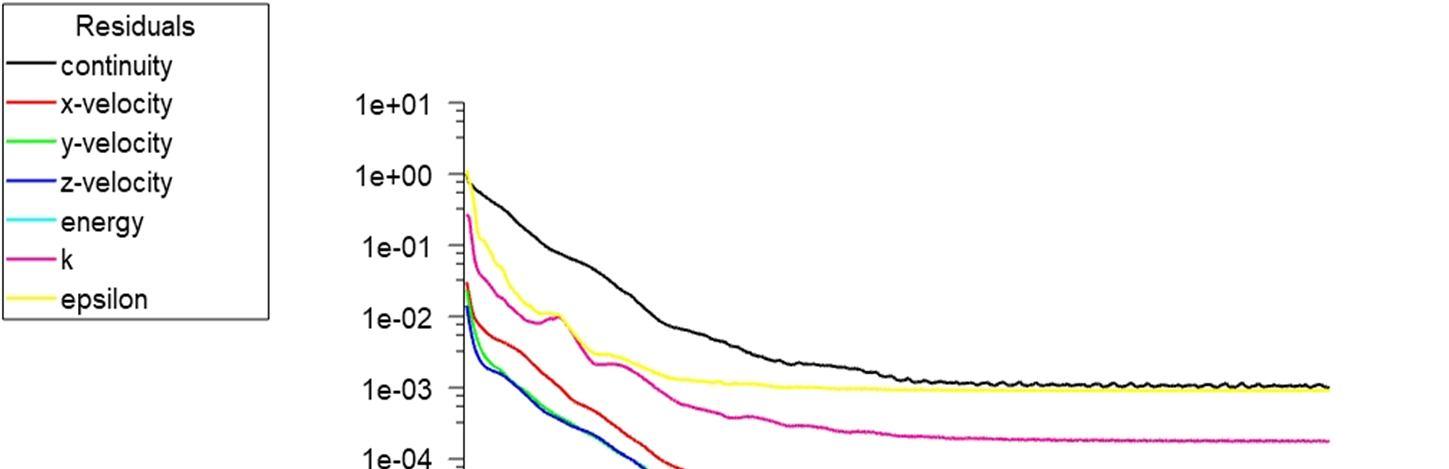
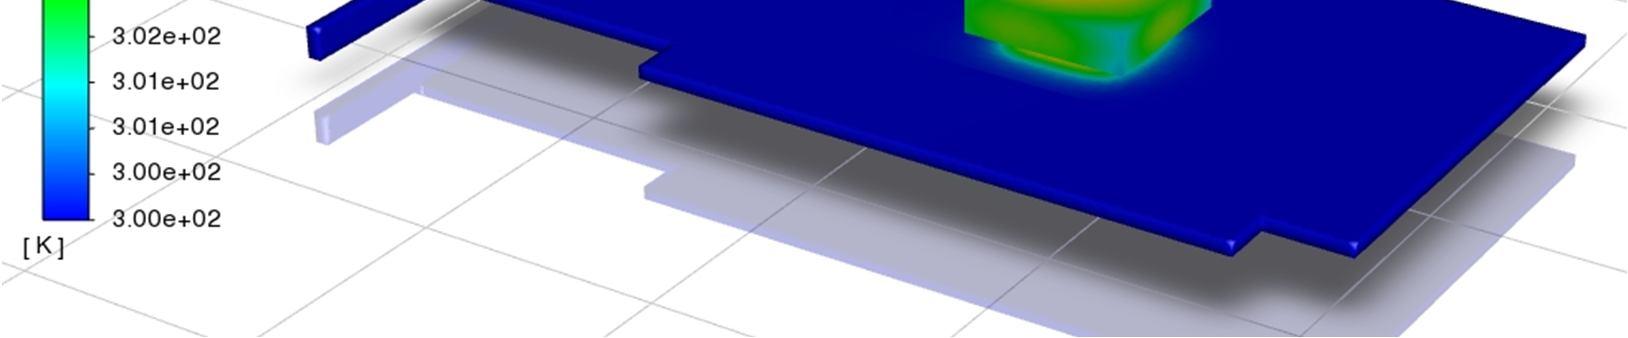

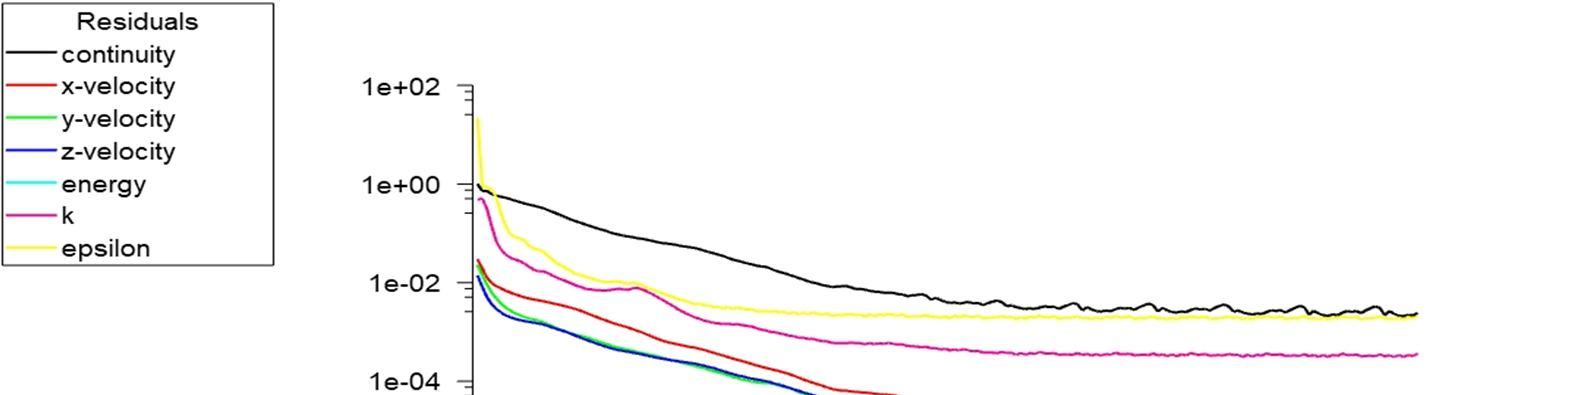
Figure XIX. Iterations performed when v=5m/s.
Factor
Factor
ISSN: 2321-9653; IC Value: 45.98; SJ Impact Factor: 7.538 Volume 10 Issue XII Dec 2022- Available at www.ijraset.com
Figure XX. Temperature distribution over the graphic card
From Table IV. we can see that for when inlet velocity is 1 m/s the maximum temperature between air-based and water-based have a difference of 12K. when inlet velocity is 3 m/s the difference of temperatures being 7K and when inlet velocity is 5 m/s the difference of temperature being 6K.
Table IV. Maximum temperature attained by graphic card for different velocities and fluid Inlet Velocity, v (m/s) Maximum temperature (Air-based cooling) (K) Maximum temperature (Water-based cooling) (K) 1 319 307 3 311 304 5 309 303
In contrast to pure conduction, liquid cooling "efficiently distributes heat over larger convective surface area (radiator), allowing for decreased fan speeds (better acoustics) or higher overall power," (Mark, 2019). Water having a higher specific heat capacity and thermal conductivity than air becomes more efficient in transporting heat away from heat sources in graphics cards (Atila, 2021)
We performed numerical simulations to test the effectiveness of heat transmission through conduction and convection modes for two different based fluids on graphic card. Conduction happened due to surface contact of the heat sink and the chip (air-based cooling) and water block with chip (water-based cooling) and convection due to transfer of heat from heat sink to air (air-based cooling) and transfer of heat from copper block to water (water-based cooling). From comparison analysis we draw the following conclusion: -
1) The comparison of temperature distribution contour for heat sink (air-based) and water block (water-based) at a different inlet velocity (v = 1 m/s, 3 m/s and 5m/s). Based on the contour temperature distribution, shown that maximum temperature retained by the graphic card for water-based cooling is less than air-based cooling
2) While simulating we could see iterations were less for air-based cooling compared to water-based cooling which tells that heat being removed for air-cooling was less compared to water-based cooling.
3) The efficiency of water-based cooling on an average was nearly about 10% better than air-based cooling which proves that water-based cooling is better than air-based cooling.
Although air cooling has benefits over liquid cooling in terms of manufacturing costs, space utilisation rates, structural complexity, and other factors, several studies have shown that liquid cooling is almost one of the most promising cooling systems (Nan et al, 2020).
ISSN: 2321-9653; IC Value: 45.98; SJ Impact Factor: 7.538 Volume 10 Issue XII Dec 2022- Available at www.ijraset.com
It would not have been possible without the assistance of my PhD professor, Sebastian Uppapalli, who has guided me through every phase of my thesis. I'm grateful for the opportunity he gave me.
I would also want to thank my PhD professor Pankaj Narke, who's remarkable professionalism and experience enabled me to complete this research report.
Last but not least, I want to thank my co-workers Chirag and Sahil, whose astute observations really assisted me in avoiding several mistakes.
[1] Harun, Zambri & Reda, Eslam & Faris, Mahir. (2019). Computational Fluid Dynamics Simulation on the Heat Sink Performance of a Graphics Processing Unit Thermal Management. 31. 139-147. 10.17576/jkukm-2019-31(1)-17.
[2] Abbas, T. & Abdelsalam, Khalil & Khodairy, K. (2010). CPU thermal management of personal and notebook computer (Transient study). 10.1109/THETA.2010.5766383.
[3] Ferrari, A. & Suppa, V. 1977. Cooling device for components which dissipate large amounts of heat, Google Patents.
[4] Incropera, F.P., Lavine, A.S., Bergman T.L. & DeWitt, D.P. 2007. Fundamentals of Heat and Mass Transfer.
[5] Wiley.
[6] Yunus, A. C. & Michael, A. B. 2006. Thermodynamics: An Engineering Approach. New York: McGraw-Hill.
[7] Baojun Liu 2020 IOP Conf. Ser.: Earth Environ. Sci. 571 012020
[8] Kang, Sukhvinder & Miller, David & Cennamo, John. (2007). Closed Loop Liquid Cooling for High Performance Computer Systems. 10.1115/IPACK200733870.