10 X October 2022 https://doi.org/10.22214/ijraset.2022.46984
ISSN: 2321 9653; IC Value: 45.98; SJ Impact Factor: 7.538 Volume 10 Issue X Oct 2022 Available at www.ijraset.com

ISSN: 2321 9653; IC Value: 45.98; SJ Impact Factor: 7.538 Volume 10 Issue X Oct 2022 Available at www.ijraset.com
1,
2College of Economics and Management, Nanjing University of Aeronautics and Astronautics, Nanjing 210016, ChinaAbstract: Rapid economic growth is often accompanied by environmental depletion. Recent years have witnessed green growth as a renowned efficient approach to tracking the progress towards sustainable development. Green growth is imperative with the current energy depletion rate and environmental crisis. Green indicators and statistics can measure environmentally sustainable development; thus, they evaluate green growth and support its integration into policy. This study uses MCDM (Multi-criteria decision making) techniques and OECD indicators for the world’s top 10 economies to evaluate their green growth. This research aims to rank the top 10 economies according to green growth. The top ranked best performing country will be further analyzed to assess its renewable energy production.
Keywords: AHP, green growth, Multi criteria Decision Making (MCDM), TOPSIS.
The accelerating pace of climate change has added another dimension of complexity to the relationship between economic growth and environmental degradation, leading to calls for policies to achieve a balance between the two. In addition to altering normal weather conditions, climate change will likely alter the frequency and intensity of extreme weather events, threatening human safety, health, and survival worldwide. Because of the common set of threats it poses on a global scale, a response to the challenge of climate change must emerge out of a common multilateral participative agenda, a worldwide resolve geared toward combating the effects of climate change.
Fossil fuel burning by the world’s richest nations and their citizens’ consumption habits cause half the global deaths from fine particle pollution [1] G 20 countries make up nearly two thirds of the global population, 80 percent of the world’s economic output and three quarters of international trade. They also have large environmental footprints when it comes to consumer products, with most developing countries manufacturing these goods and suffering the health impacts that arise from these operations [2]
Several countries and international organizations, such as the Organisation for Economic Co operation and Development (OECD), World Bank, and United Nations, have developed strategies for green growth; others, such as the Global Green Growth Institute (GGGI), are specifically dedicated to the issue. To evaluate the performance of different countries, this paper takes the world’s 10 top fastest growing economies to find which fast growing economy in the world is performing best in sustainable green growth
The assessment of the level of Green Growth is based on OECD Green Growth Indicators. These indicators are in the OECD Green Growth database (OECD 2017). It contains selected indicators for monitoring progress towards Green Growth. The database synthesizes data and indicators across a wide range of domains.
The indicators have been selected according to well specified criteria and embedded in a conceptual framework, which is structured around five areas to capture the main features of the Green Growth
1) environmental and resource productivity and innovation;
2) natural assets (including biodiversity) and their cost effective management;
3) the environmental quality of life (including access to basic services such as clean water);
4) related green growth policies, economic opportunities and social context of green growth; and
5) monitoring sustainability of overall economic developments, for example, through comprehensive wealth accounting
Criteria
ISSN: 2321 9653; IC Value: 45.98; SJ Impact Factor: 7.538 Volume 10 Issue X Oct 2022 Available at www.ijraset.com
Sub Criteria Unit
CO2 Productivity Production based Co2 emissions
Million tonnes Energy Productivity Renewable energy, % total energy generation Percentage
Land resources & forest resources Natural & semi natural vegetated land, % total Forests with long term management plans, % total forest area
Percentage Percentage
Exposure to environmental risks Mean population exposure to PM2.5 Micrograms per cubic meter
Number
Socio economic context GDP Million USD Economic opportunities and policy responses Development of related environmental technologies, invention per capita
Green growth means fostering economic growth and development while ensuring that natural assets continue to provide the resources and environmental services on which our well being relies. (OECD 2017) The focus of green growth strategies is ensuring that natural assets can deliver their full economic potential on a sustainable basis. That potential includes providing critical life support services clean air and water, and the resilient biodiversity needed to support food production and human health. Natural assets are not infinitely substitutable, and green growth policies consider that. Researchers like Meng Li have researched inclusive green growth in Asia Pacific [3]. Saira Naseer has assessed green economic efficiency in china using AHP, and the research indicates that the AHP model reduces uncertainty and shortcoming in the evaluation process [4] Research comparing the green economy in Iran with OECD countries strongly suggests using some other MCDM techniques such as AHP, ELECTRE, and Fuzzy MCDM [5]. Piwowarski Mateusz used TOPSIS and VIKOR methods to study sustainable development in EU countries [6] To avoid developing unfavorably, “green growth” suggests pursuing such an economic development through which we can avoid degradation of the environment, loss of biodiversity, and unmanageable usage of natural resources (OECD, 2017). Green growth strongly emphasizes the fostering conditions needed to innovate, invest, and compete to stimulate economic growth without derailing resilient ecosystems [9]
Green growth is synonymous with renewable energy production. Despite the world's top economies being the main perpetrators of exploiting resources and the environment, their efforts towards green growth should be amplified. Previous researches lack the conceptual approach using MCDM techniques for assessing green growth while including renewable energy production. This research aims to evaluate the world’s top 10 economies using MCDM techniques, including AHP, TOPSIS, Simple moving average & Regression, while analyzing the best performing country’s renewable energy production.
In the decision making theory, the analytic hierarchy process (AHP) is a structured technique for organizing and analyzing complex decisions based on mathematics and psychology. Thomas L. Saaty developed it in the 1970s [7].
AHP follows the following steps,
1) The hierarchical process of the problem is formed.
2) Pair wise comparisons are conducted for the criteria, sub criteria, and alternatives.
3) Weights of pair wise comparisons are calculated.
4) After calculating weights, decision matrixes are formed.
5) Final weights of alternatives obtain by multiplying decision matrixes from alternatives toward criteria.
6) Weights obtained in the last step are raw and must be normalized to be easily comparable.
7) Calculate the consistency ratio (CR). Correct the consistency of comparison. If CR is less than 0, the consistency is good Otherwise, it is inconsistent. In this case, you need to adjust the comparison component to get good consistency.
ISSN: 2321 9653; IC Value: 45.98; SJ Impact Factor: 7.538 Volume 10 Issue X Oct 2022 Available at www.ijraset.com
Where (1) λmax is the average of the weighted sum vector divided by the corresponding standard, and n is the number of standards. RI is a random index. In this research, the weight of each criterion is assigned from the 1 9 scale method. The judgment matrix is processed by Yaahp analytic processing software.
The Technique for Order of Preference by Similarity to Ideal Solution (TOPSIS is one of the most popular methods for multiple criteria decision making, developed by Hwang and Yoon in 1981 [8] for solving a multiple attribute decision making problem.
The stepwise procedure of Hwang and Yoon [8] for implementing TOPSIS is presented as follows:
1) Construct a normalized decision matrix of beneficial and non beneficial criteria.
(3)
Where xij and rij are original and the normalized score of the decision matrix, respectively 2) Construct the weighted normalized decision matrix by multiplying the weights wi of evaluation criteria with the normalized decision matrix rij (4)
3) Determined the positive ideal solution (PIS) and negative ideal solution (NIS) A*= {v1 * , v2 * ………….vn *} maximum values (5) 4) Calculate the separation measures of each alternative from PIS and NIS
ISSN: 2321 9653; IC Value: 45.98; SJ Impact Factor: 7.538 Volume 10 Issue X Oct 2022 Available at www.ijraset.com
5) Calculate the relative closeness coefficient to the ideal solution of each alternative
6) Based on the decreasing values of the closeness coefficient, alternatives are ranked from most valuable to worst. The alternative having the highest closeness coefficient (CCi ) is selected. To facilitate the TOPSIS calculation, this research has used Microsoft Excel.
A simple moving average (SMA) is an arithmetic moving average calculated by adding recent values and dividing that figure by the number of periods in the calculation average.
Where A is the value and n is the total number of periods
Regression analysis is one of the most popular techniques for predictive modeling. A multiple regression model with more than one explanatory variable may be written as,
Where y is the output variable, the regression parameters (i =0,1,2…p), xi the input variables (i =0,1,2…p) and the random error term. This research uses Microsoft Excel for calculating regression.
The first approach to evaluate the green growth in this paper was to calculate a pair wise comparison matrix. The pair wise comparison matrix was calculated using Yaahp software. The salary scale used for the pair wise comparison matrix is based on the expert’s opinions and literature. A scale of 1 7 is used for each criterion to score the matrix. Then using this matrix, the hierarchal evaluation of the matrix is constructed using Yaahp software.
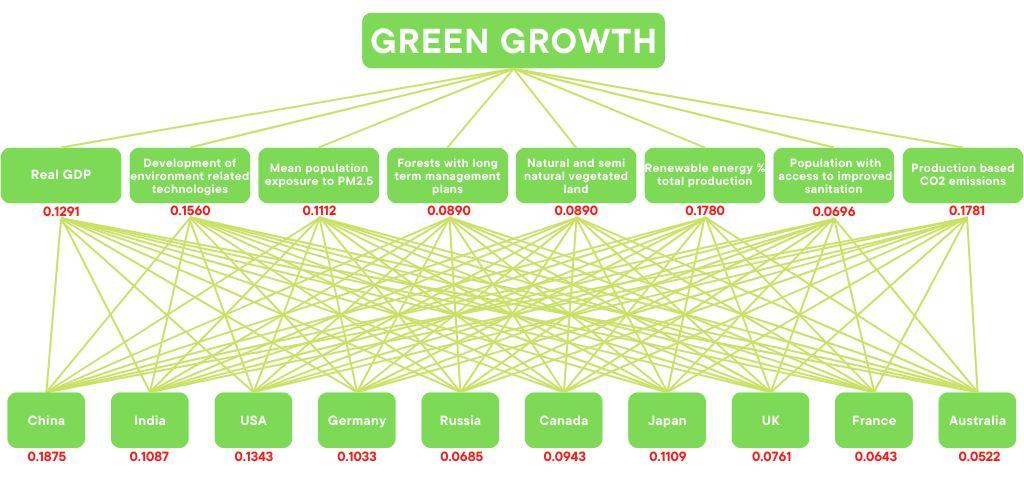
From AHP, we determine the weights for each criterion which will be used for further calculation. The consistency ratio of the calculation is below 0.1
Fig.1.
According to the results gained from AHP, renewable energy production and production based CO2 emission have received the greatest weight for the case of green growth.
The data obtained from AHP using 8 criteria and 10 top countries China, India, USA, Germany, Russia, Canada, Japan, UK, France and Australia are being used as weights for the TOPSIS model. The matrix was formed at the first standard decision, as shown below
Country GDP Development of related environmenta l technologies
ISSN: 2321 9653; IC Value: 45.98; SJ Impact Factor: 7.538 Volume 10 Issue X Oct 2022 Available at www.ijraset.com
Table 2 Standard Decision Matrix
Mean population exposure to PM2.5
Forests with long term managem ent plans
Natural & semi natu ral vegetated land
Renewable energy, % total energy generation
Production based Co2 emissions
Population with access to sanitation
China 0.69642085 0.048987671 0.47564760 0.314024 0.244012 0.26624176 0.86527282 0.26830773 India 0.27737408 0.004399378 0.83017080 0.329193 0.120139 0.19747411 0.20237572 0.17361088 US 0.6023881 0.2731181 0.07649692 0.303211 0.354889 0.17326231 0.41565784 0.38667879 Germany 0.12607582 0.570254537 0.11556640 0.297787 0.225140 0.3968782 0.05643011 0.38273309 Japan 0.16159429 0.656101863 0.13600472 0.448606 0.326271 0.17728535 0.09253221 0.31960185 Canada 0.05235476 0.223179267 0.07065858 0.272982 0.377279 0.65376909 0.05002567 0.33143896
Russia 0.11408855 0.007253029 0.1173685 0.448569 0.402959 0.17350243 0.14370794 0.24068782 UK 0.09119069 0.192621424 0.09987399 0.270851 0.306678 0.37055357 0.02998307 0.38667879 France 0.08817074 0.257779728 0.11327661 0.202708 0.254214 0.19725126 0.02574532 0.31171045 Australia 0.03654228 0.117950897 0.06725174 0.144819 0.432726 0.19344731 0.03335655 0.29192134
A weighted normalized matrix is calculated using the weights obtained from the AHP method based on the matrix formed. The weighted normalized matrix will calculate the positive ideal solution (PIS) and negative ideal solution (NIS). The weighted decision matrix is as follows
Countr y GDP Develop ment of related environm ental technolog ies
Mean populati on exposur e to PM2.5
Forest s with long t erm manag ement plans
Natura l & semi n atural vegeta ted land
Renewa ble energy, % total energy generati on
Producti on base d Co2 emissio ns
Populati on with access to sanitatio n
China 0.08990 793 0.007642 077 0.05289 201 0.0279 48 0.0217 17 0.04739 103 0.15410 509 0.01867 421 India 0.03580 899 0.000686 303 0.09231 499 0.0292 98 0.0106 92 0.03515 039 0.03604 312 0.01208 331
US 0.07776 83 0.042606 432 0.00850 646 0.0269 85 0.0315 85 0.03084 069 0.07402 866 0.02691 284
Germa ny 0.01627 639 0.088959 708 0.01321 794 0.0265 03 0.0200 37 0.07064 433 0.01005 02 0.02663 822
Japan 0.02086 182 0.102351 891 0.01512 373 0.0399 25 0.0290 38 0.03155 679 0.01647 999 0.02224 428
Canad a 0.00675 9 0.034815 966 0.00785 724 0.0242 95 0.0335 77 0.11637 089 0.00890 957 0.02306 815
Russia 0.01472 883 0.001131 473 0.01305 139 0.0399 22 0.0358 63 0.03088 343 0.02559 438 0.01675 187
UK 0.01177 272 0.030048 942 0.01110 592 0.0241 05 0.0272 94 0.06595 853 0.00533 999 0.02691 284
France 0.01138 284 0.040213 646 0.01259 636 0.0180 41 0.0226 25 0.03511 072 0.00458 524 0.02169 504 Austral ia 0.00471 761 0.018400 34 0.00747 873 0.0128 88 0.0377 11 0.03443 362 0.00594 08 0.02032 194
ISSN: 2321 9653; IC Value: 45.98; SJ Impact Factor: 7.538 Volume 10 Issue X Oct 2022 Available at www.ijraset.com
The PIS and NIS are calculated based on each alternative's desired outcome. The criteria of “Mean Population Exposure To PM2.5” and “Production based CO2 Emissions” is used as a negative index in NIS and PIS as emission and exposure to pollution are expected to be less in an ideal case and much in the ideal negative case. In the last step, the Euclidean distance formula compares each alternative distance to PIS and NIS. Based on the similarity index, a ranking is made. The following table shows the ranking of each alternative with respective similarities to PIS and NIS
Table 4 Ranking of Alternatives
GDP Development of related environmental technologies
Mean population exposure to PM2.5
Forests with long term managem ent plans
Natural & semi natu ral vegetated land
Renewable energy, % total energy generation
Production based Co2 emissions
Population with access to sanitation
Ideal 0.08990793 0.102351891 0.00747873 0.039925 0.037711 0.11637089 0.00458524 0.02691284 Neg Ideal 0.00471761 0.000686303 0.09231499 0.012888 0.010692 0.03084069 0.15410509 0.01208331
The TOPSIS result concludes that Germany performs best in terms of green growth, followed by Canada and Japan, among the top 10 economies in the world
Table 5 Ranking of Countries
Ranking Country Ci 1 Germany 0.67929936 2 Canada 0.64084863 3 Japan 0.63363883 4 UK 0.59787304 5 France 0.57015861 6 Australia 0.5409844 7 US 0.53572777 8 Russia 0.50259878 9 India 0.41943273 10 China 0.33185364
Germany is one of the best performing countries in green growth, while the renewable energy production criteria ranked the most important among the criteria for green growth. This research forecasts gross electricity production and evaluates the correlation between renewable sources and total electricity production. This research aims to evaluate the correlation between Renewable energy sources and Gross Electric production in Germany. And to Forecast Renewable production and gross Electricity Production. The data used in this section is from 2013 2021 for hydro, wind, solar, biomass and total energy production shown below.
Table 6 Energy Data
Year Hydro Power (GWH)
Wind (GWH) Solar (GWH) Biomass (GWH) Energy production (GWH)
2013 27353 38547 11729 33923 587500
2014 23512 49858 19599 36890 570100
2015 27849 51680 26380 43203 584600
2016 28782 52737 31010 45514 594800
2017 25444 58497 36056 48288 584400
2018 24897 80624 38726 50326 604700
2019 26134 79924 38098 50929 609200
2020 26155 105693 39401 50916 614100
2021 24144 109951 45784 50880 600500
ISSN: 2321 9653; IC Value: 45.98; SJ Impact Factor: 7.538 Volume 10 Issue X Oct 2022 Available at www.ijraset.com
The simple moving average is used to forecast the data for the renewable energy source. The data is forecasted till 2024, as shown in table 7.
Year Hydro Power (GWH)
Wind (GWH) Solar (GWH) Biomass (GWH)
2013 27353 38547 11729 33923
2014 23512 49858 19599 36890
2015 27849 51680 26380 43203
2016 28782 52737 31010 45514
2017 25444 58497 36056 48288
2018 24897 80624 38726 50326
2019 26134 79924 38098 50929
2020 26155 105693 39401 50916
2021 24144 109951 45784 50880
2022 25477.67 98522.6 41094.3 50908.3
2023 25149.5 107822 42592.5 50898 2024 24144 109951 45784 50880
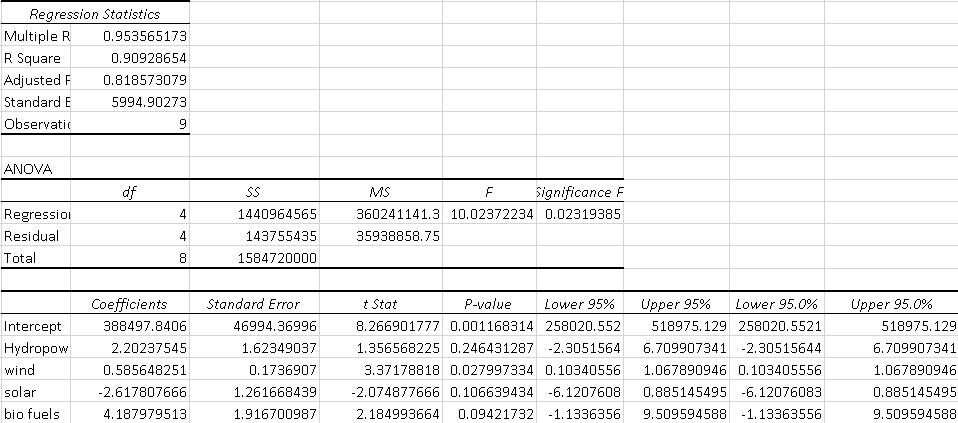
The data from table 7 is used to perform regression. The regression shows that solar energy production negatively impacts total energy production whereas hydro power energy has the greatest positive impact on total energy production. Using equation (10), regression is done to forecast the total energy production, as shown below.
Year Hydro Power (GWH)
Wind (GWH) Solar (GWH) Biomass (GWH) Electricity production(forecast) (GWH)
2013 27353 38547 11729 33923 582678.9623
2014 23512 49858 19599 36890 572667.4944
2015 27849 51680 26380 43203 591973.6088
2016 28782 52737 31010 45514 592205.4264
2017 25444 58497 36056 48288 586635.2288
2018 24897 80624 38726 50326 599934.724
2019 26134 79924 38098 50929 606418.4435
2020 26155 105693 39401 50916 618090.8161
2021 24144 109951 45784 50880 599295.2957
2022 25477.67 98522.6 41094.3 50908.3 607934.8518
2023 25149.5 107822 42592.5 50898 608693.0559
2024 24144 109951 45784 50880 599295.2957
ISSN: 2321 9653; IC Value: 45.98; SJ Impact Factor: 7.538 Volume 10 Issue X Oct 2022 Available at www.ijraset.com
In this research, we have considered the world’s top 10 best performing economies. Global warming and climate change are serious issues. It is noted that the impact made by top economies on climate and environment is higher than the developing nations. Hence the leaders of world economies should focus on green growth. This research is divided into two objectives. The initial part of the research focuses on ranking the top 10 best performing economies based on OECD indicators using AHP and TOPSIS. This study aims to introduce a novel approach based on AHP and TOPSIS to rank and evaluate the indicators of green growth into sustainable growth A combination of AHP and TOPSIS models has been used to evaluate and rank the green growth indicators based on experts' opinions and literature review. In this regard, six indicators and seven sub indicators are collected from the existing green growth literature. The data for evaluating green growth is collected from OECD Statistics. The results from AHP indicate that renewable energy production and production based CO2 emission carry the highest value in green growth. The obtained weights from AHP were used in TOPSIS analysis, indicating that Germany is the best performing nation in green growth while India and China rank the lowest among the top 10. These results are consistent with the OECD annual report as most countries have set up targets to decrease emissions and increase the use of renewable sources by 2030; Germany is the only country in the OECD vision 2030 which is performing well along its set targets. The second part of the thesis focuses on the energy production of Germany and correlates renewable sources and total energy production. And forecast renewable production and gross production. Simple moving averages and regression has been used for this task. Using a Simple moving average, the renewable energy production is forecasted and used in the formulated equation driven by the regression. This result shows that solar energy production negatively impacts Germany's total energy production. This research suggests that for Germany to improve further towards green growth, it should focus on hydropower and biofuels. Despite the study's strengths, some limitations can be opportunities for future work. First, this study evaluated the green growth indicators in only the top 10 economies, but the factor of developing nations and developed nations is not considered in this study; therefore, future works would extend this method in evaluating the factors and differences between the developing countries and developed countries. Secondly, performance measurement on green growth for both sustainable performance and operational performance can be considered the critical drivers for ascertaining the success and failure of green growth. Therefore, future studies would measure green growth indicators based on different performance measurements [10], such as the Global Reporting Initiative (GRI) sustainable performance measurement. This study used the quantitative approach for evaluating green growth indicators; therefore, the integration of qualitative research and quantitative research will strengthen the study results to clarify the impacts of green growth policy on the practices.
[1] W Liang, and M Yang, “Urbanization, economic growth and environmental pollution: Evidence from China”, Sustainable Computing: Informatics and Systems, vol. 21, pp. 1 9, November 2018.
[2] J Andree, A Chamorro, P Spencer, E Kooman and H Dogo, “Revisiting the relation between economic growth and the environment; a global assessment of deforestation, pollution and carbon emission”, Renewable and Sustainable Energy Reviews, vol. 114, pp. 109221, June 2019.
[3] M Li, Y Zhang, Z Fan and H Chen, “Evaluation and Research on the Level of Inclusive Green Growth in Asia Pacific Region”, Sustainability, vol. 13, pp. 7482, July 2021
[4] S Naseer, H Song, M S Aslam, D Abdul and A Tanveer, “Assessment of green economic efficiency in China using analytical hierarchical process”, Soft Computing, vol. 26, pp. 2499, October 2021.
[5] I Ajripour and R Alamian, “Comparing green economy in Iran with OECD Asian countries by applying TOPSIS and GI method” Review of Business & Management, vol. 17, pp. 15 26, 2021.
[6] P Mateusz, M Danuta, L Malgorzata, B Mariusz and N Kesra, “TOPSIS and VIKOR methods in study of sustainable development in the EU countries”, Procedia Computer Science, vol. 126, pp. 1683 1692, 2018.
[7] Saaty, T.L, “The analytic hierarchy process”, McGraw Hill, New York, NY, USA, 1980
[8] Hwang, C.L., Yoon, K., Multiple Attribute Decision Making. In: Lecture Notes in Economics and Mathematical Systems, vol. 186, 1980
[9] J Li, K Dong and X Dong, “Green energy as a new determinant of green growth in China: The role of green technological innovation”, Energy Economics, vol. 14, pp. 106260, August 2022.
[10] E Tarabusi and G Guarini, “An axiomatic approach to decoupling indicators for green growth”, Ecological Indicators, vol. 84, pp. 515 524, july 2017.