
10 IX September 2022 https://doi.org/10.22214/ijraset.2022.46844

Sneha Samuel Student of Bachelors in Electronics Engineering at University of Mumbai, Maharashtra , India.
Abstract: In smart cities there are systems which monitor the air pollution levels at different locations. Supervising the information given by the gas sensor devices may be a tedious task because the sensor data is simply too huge to investigate manually. Further because of electrical interference and environmental conditions, the sensors may show false values and trigger alarms. Just in case the sensor gives any anomalous values then the values should be eliminated from analysis and triggering of alarms should be stopped. Thedamaged sensors must get replaced as early as possible. This paper proposes a Data Acquisition System (DAS) which measures humidity, temperature and air quality index at different locations. Just in case the sensor encounters some problem and provides anomalous values, it is detected in real time by comparing these values with predicted values of the ‘Moving Average Model’ in Python. These anomalous values can then be eliminated from analysis.
Keywords: Sensors, AQI, Anomalous, DAS, Moving Average Model

In various monitoring processes we are able to see that there are various devices which take in and upload the data on the cloud. Anomalies are the deviations of the output values from its normal values. Usually, these devices giveoutputs in a normal range but because of external factors such as electrical interference, wiring errors we get anomalies within the data. These anomalies can trigger alarms and other processes that are triggered just in case ofa hazard. The air quality index depends on many meteorological factors like wind speed, temperature, humidity, rainfall, solar radiation etc. Hence, we cannot keep a fixed threshold for detecting anomalies of these parameters. The threshold needs to be changed according to above mentioned factors. For example, considering only seasonal factors, a threshold value for winters cannot be used for monsoon because some pollutants dissolve in rain water reducing air quality index. There are many other factors to be considered which makes it difficult to detect anomalies. It is important to detect these anomalies/errors so we do not get any false readings and alarms during the execution. This paper presents a DAS which is developed to measure various parameters like humidity, temperature and air quality at different locations and to detect anomalies in real time.
One paper suggested that the petroleum industry is one among the appliance contexts where anomaly problems are present. Luis marti et al.
a mixture of one
which
a completely unique and fast. They performed a series of
and a real life application related to oil platform
[1]
paper suggests that deployment of environmental sensors has generated an interest in real time applications of the data. David Hill et al. developed a real time
environmental data streamsthat can be used to identify data that deviate from historical patterns. The method was based on an autoregressive data driven model of the data stream. Furthermore, the proposed method could be easily deployed
a large heterogeneous sensor network. The results indicated that a multilayer perceptron model of the data stream,
with
of
data points, performed well at identifying erroneous data in the data stream [2].
Technology (IJRASET)
ISSN: 2321 9653; IC Value: 45.98; SJ Impact Factor: 7.538
Volume 10 Issue IX Sep 2022 Available at www.ijraset.com
The paper by Octavian A. Postolache presented a network for indoor and out door air quality monitoring. Each node was installed in a different room and included tin dioxide sensor arrays connected to an acquisition and control system. The nodes were hardwired or wirelessly connectedto a central monitoring unit. Advanced processing based on multiple input single output neural networks was implemented at the network sensing nodes to obtain temperature and humidity compensated gas concentration values. [3] Another paper proposed that to control the energy consumption of a household, sudden abnormal behavior must be detected and adjusted to avoid unnecessary consumption. The thesis presented by Jelena Novacic et al.used a time series data set of temperature data for implementation of anomaly detection. Four models were implemented and tested; a Linear Regression model, PandasEWM function, an exponentially weighted moving average (EWMA) model and finally a probabilistic exponentially weighted moving average (PEWMA) model. Each model was tested using data sets from nine different apartments, from the same time period. Then an evaluation of each model was conducted in terms of Precision, Recall and F measure. The results of this thesis showed that in terms of accuracy, PEWMA outperformed the other models. The EWMA model was slightly better than the Linear Regression model, followed bythePandasEWM model.[4]
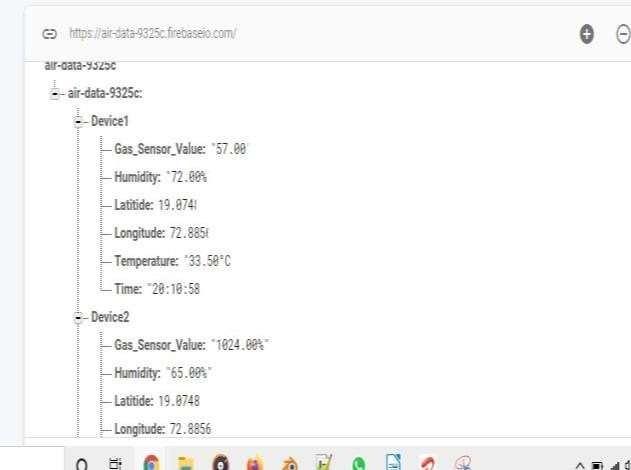
The aim is to develop a system which can detect anomaliesin AQI, humidity and temperature data of different locations in real time. Detecting anomalies in real time would prevent triggering of false alarms which occur due to misinterpretation of data. The real time data is generated by different monitoring devices. Each monitoring device has a micro controller which gets its current geo location in terms of latitude and longitude from the nearest cellular InternetService Provider (ISP) tower and Internet Protocol (IP) address of the network [5]. The geo location, current I.S.T (Indian Standard Time), and readings of temperature sensor and gas sensor are uploaded onto the Google Firebase account in JavaScript Object Notation (JSON) format [6]. These readings are retrieved using a python module running on a PC and then used for detecting anomalies. Sensor readings are also stored in a Comma Separated Values (CSV) file. The micro controller uploads data every 20 seconds, hence there are 4,320 readings per day of each parameter. The readings might be missed dueto network issues or a power failure. It is important to detect these missed readings and exclude them from the analysis. The time instance at which readings were taken for each device is stored in a hash map. If the previous time and current time instances match, then it implies fewreadings are missed. Such readings are excluded fromanalysis. The predicted values and real time values for each sensor value are plotted against time on a 'matplotlib'figure in python [7].
Moving window averages are used to detect anomalies in the real time data. The last five readings of each parameter are used to calculate average. For each parameter, a real time curve of moving averages is plotted. When the absolute difference between the current reading and the parameter’s average goes beyond the parameter’s threshold, it is detected as an anomaly. The size of the window is five units. Hence for the first five readings,the curves of real timereadings and averages almost coincide with each other. The sensitivity of model to detect anomalies depends on the window size and threshold value. On increasing the windowsize, the model is unable to detect anomalies properly whereas on decreasing the window size, small changes in parameter are reported as anomalies. While testing the model, it was found that window size of five units was able to detect anomalies precisely for all parameters. Below given is an algorithm for detecting anomalies in one parameter for e.g., humidity. In a similar way, anomalies in other parameters are detected.
1) Declare an empty deque for storing the last five readings of a parameter, arrays for storing real time readings and average values of the parameter.
2) Declare a hash map that will keep track of time instance at which last reading was updated byeach device.
3) Initialize an endless loop that will keep on running unless the program is terminated.
4) Retrieve the current value of the parameter from google firebase.
5) If the time of current reading is the same as in previous reading of hash map, print a warning for missed reading and the time instance on console.
6) Else append the parameter’s value to the deque as well as to the arraystoring its real time values.
7) Calculate the average of the deque. If the absolute difference between the current reading and average is greater than the parameter’s threshold, label it as an anomaly. Print the absolute difference, time, and parameter’s name on the console.
8) Pop the last value from the deque of that parameter.
9) Write the status to the CSV file.
10) Plot the array of average in red color and parameter’s readings against the time axis.
11) At the end of the loop, introduce a delay of 20 seconds which will keep the system synchronized.
ISSN: 2321 9653; IC Value: 45.98; SJ Impact Factor: 7.538
10 Issue IX Sep 2022 Available at www.ijraset.com
3.x
NodeMCU was used as the micro controller for each device. It has an inbuilt Wi Fi module. It is cost effective which is easily programmable via Universal Serial Bus (USB) and requires no external programmer [8]. MQ135 gas sensor gives analog as well as digital readings. For more precision we are using the analog readings. It is sensitive to Benzene, alcohol based gases, and smoke. It has a fast response time and recovery.
It takes around 20 seconds to calibrate itself [9]. The DHT11 temperature/humidity sensor is a digital sensor. It does not require an external Analog to Digital converter.
The temperature range is 0 50ºC which is good enough for monitoringweather. It can measure relative humidity from 20% to 90% [10]. The relative humidity of an air moisture mixture is ratio of the partial pressure of water vapor in the mixture tothe equilibrium vapor pressure of water over a flat surface of pure water at a given temperature. At 100% relative humidity, the air is saturated and is at its dew point.
Each IoT monitoring device had temperature/humidity sensor and gas sensors. The microcontroller in each device was programmed to read the data from the sensors after every twenty seconds. Hence there will be 4,320 total entries for each parameter in 24 hours for each device. Total three such IoT devices were made for generating real time data. They were connected to the Wi Fi networks in their locations. Thedevices uploaded the data on a real time database of GoogleFirebase [11]. A maximum delay of three seconds was observed for the devices to upload data once it is collected from sensors.
When a
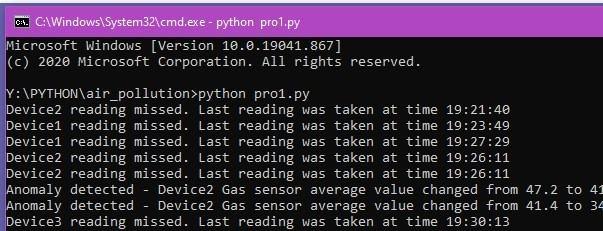
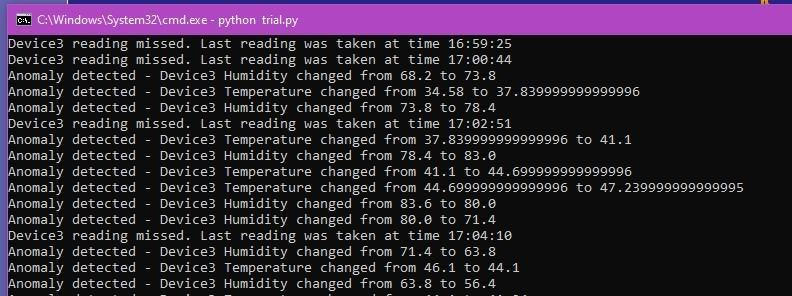
The above Figure 2 shows the console
it is
as temperature anomaly,
to that parameter.
ISSN: 2321 9653; IC Value: 45.98; SJ Impact Factor: 7.538 Volume 10 Issue IX Sep 2022 Available at www.ijraset.com
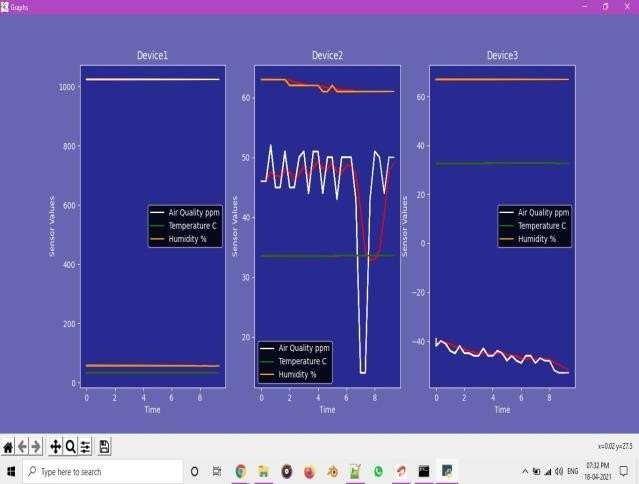
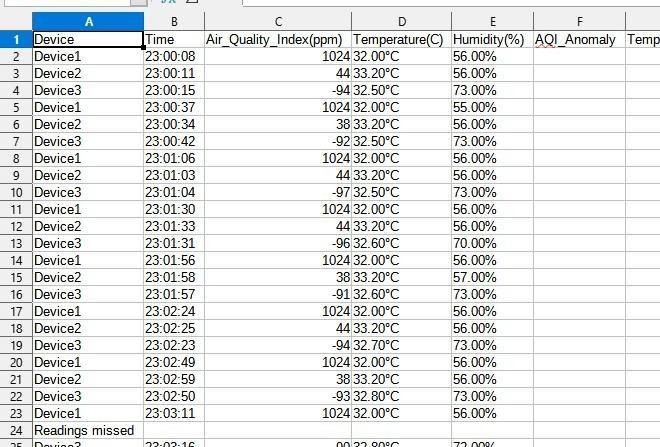
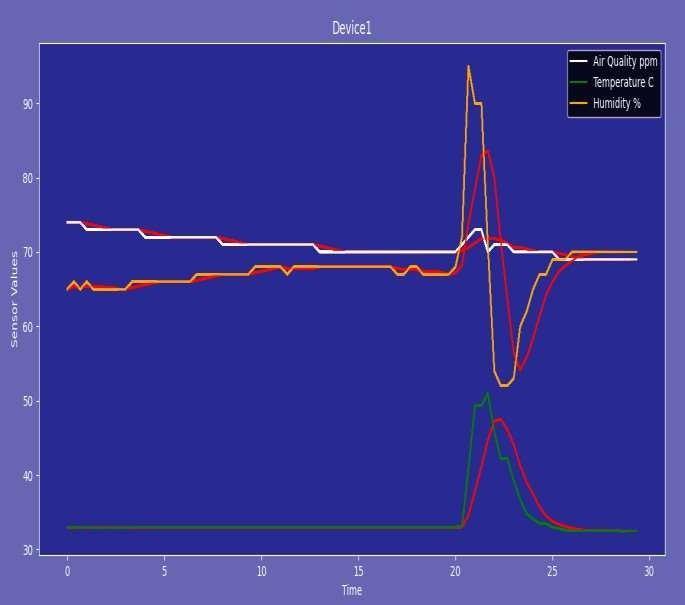
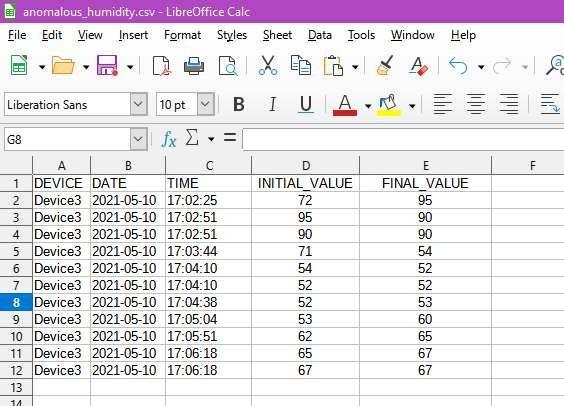
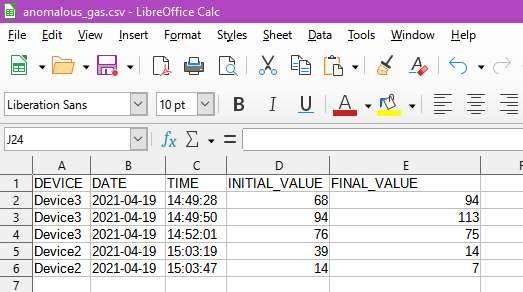
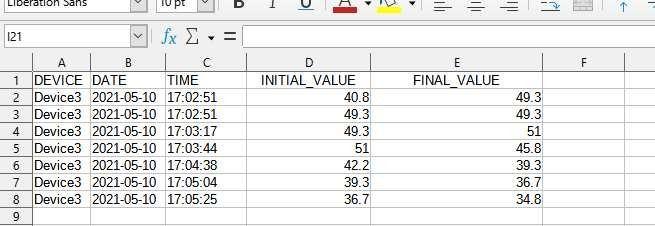
The entire system was completed and tested a series of times. The anomalies were intentionally produced in each parameter for testing the model. Different methods were used for producing anomalies in different parameters. An incense stick or a cigarette lighter was suddenly placed near the gas sensor ofone of the devices to produce anomaly in gas concentration readings. For testing humidity parameter, the sensor was brought near a vaporizer or a steaming machine for some time. To produce anomaly in temperature data, one of the devices wassuddenly kept near a burning object. Figures 3 and 4 show the screenshot of the CSV file and the real time plots respectively. In the figure 4, the gas sensor of device 2 was temporarily disconnected from the micro controller to simulate anomaly in Air Quality. As a result, a sudden trough was observed in the air quality. The figures 5 7 show results when vaporizer was placed near the temperature/humidity sensor of device 1 for some time. As a result, the temperature and humidity values shown a sudden spike. Later on, the vaporizer was switched OFF, and the fan in the room was turned ON. The temperature came to a normal value but the humidity fluctuated due to fan. The anomalous values of the sensors in these events were successfully detected by the model. Initially, temperature changed from 34.58ºC to 37.83ºC while humidity changed from 68.2% to 73.8%. Further changes in these values are shown in Figure 6. Figure 5 is the graph of real time readings. Figures 7aand 7b are temperature and humidity changes recorded in the CSV files dedicated to record only anomalous temperature andhumidity values. Figure 8 shows anomalous AQI values recorded in thededicated CSV file when incense stick was used for simulating anomaly.
Fig
The anomaly detection system is successfully able to detect anomalies in the readings of gas sensors, temperature and humidity sensors in real time. The system plots a real time graph of all the readings which changes every twenty seconds. The working of the entire system is tested by intentionally creating the conditions in which anomalies are likely tooccur. Anomalies are successfully detected and can be removed from analysis in real time. This would prevent the triggering of false alarms in a factory or any other air pollution monitoring system. Filtering of data is essential before the analysis of any sensor data, but the data generated by the anomaly detection system can be directly used for analysis without filtering. The concept of detecting anomalies in real time can be further extended to other real time
systems as well.
ISSN: 2321 9653; IC Value: 45.98; SJ Impact Factor: 7.538
Volume 10 Issue IX Sep 2022 Available at www.ijraset.com
The support provided by Electronics and Computer Science Engineering Department of Fr. Conceicao Rodrigues College of Engineering, University of Mumbai is greatly appreciated.
[1] L. Martí, N. Sanchez Pi, J. Molina, and A. Garcia, “Anomaly Detection Based on Sensor Data in Petroleum Industry Applications,” Sensors, vol. 15, no. 2, pp. 2774 2797, Jan. 2015.
[2] David J. Hill, Barbara S. Minsker, “Anomaly detection in streaming environmental sensor data: A data driven modeling approach”, Environmental Modelling& Software, Volume 25, Issue 9, 2010, Pages 1014 1022, ISSN 1364 8152, https://doi.org/10.1016/j.envsoft.2009.08.010. (https://www.sciencedirect.com/science/article/pii/S1364815 209002321)
[3] O. A. Postolache, J. M. Dias Pereira and P. M. B. Silva Girao, "Smart Sensors Network for Air Quality Monitoring Applications," in IEEE Transactions on Instrumentation and Measurement, vol. 58, no. 9, pp. 3253 3262, Sept. 2009, doi: 10.1109/TIM.2009.2022372.
[4] Jelena Novacic Kablai Tokhi, “Implementation of Anomaly Detection on a Time series Temperature Data set”, B.S Thesis, Department of Computer Science and Media Technology, Malmo University, Malmö, Sweden, 2019. [Online]. Available: http://ls00012.mah.se/handle/2043/28784
[5] IP API, IP Geolocation API. Accessed January12, 2021.[Online]. Available: https://ip api.com/docs
[6] RuiSantosandSara Santos. “Get Epoch/UnixTime withthe ESP8266 NodeMCU Arduino” randomnerdtutorials.comhttps://randomnerdtutorials.com/epoch unix time esp8266 nodemcu arduino (accessed Feb. 25, 2021).
[7] Sentdex, UnitedStates.MatplotlibTutorial16 LiveGraphs(July 12, 2015). Accessed: March 7, 2021. [Online Video].Available: https://www.youtube.com/watch?v=ZmYPzESC5YY
[8] Espressif Systems, “ESP8266EX Datasheet”, Dec 2015[Revised Feb. 2018.]
[9] HANWEI ELECTRONICS LTD, “MQ135 Gas SensorTechnical Data”, May2013
[10] Mouser Electronics, “DHT11 Humidity & TemperatureSensor”, October, 2018.
[11] Google Firebase, Google. Accessed: Sept. 14, 2020.[Online]. Available: https://firebase.google.com/docs