
10 XI November 2022 https://doi.org/10.22214/ijraset.2022.47280
ISSN: 2321 9653; IC Value: 45.98; SJ Impact Factor: 7.538 Volume 10 Issue XI Nov 2022 Available at www.ijraset.com


ISSN: 2321 9653; IC Value: 45.98; SJ Impact Factor: 7.538 Volume 10 Issue XI Nov 2022 Available at www.ijraset.com
Priyanshu Dubey1 , Mrs Kajol Priya2 , Dr. Dipteek Parmar3 1, 2, 3Harcourt Butler Technical University Kanpur, Uttar Pradesh

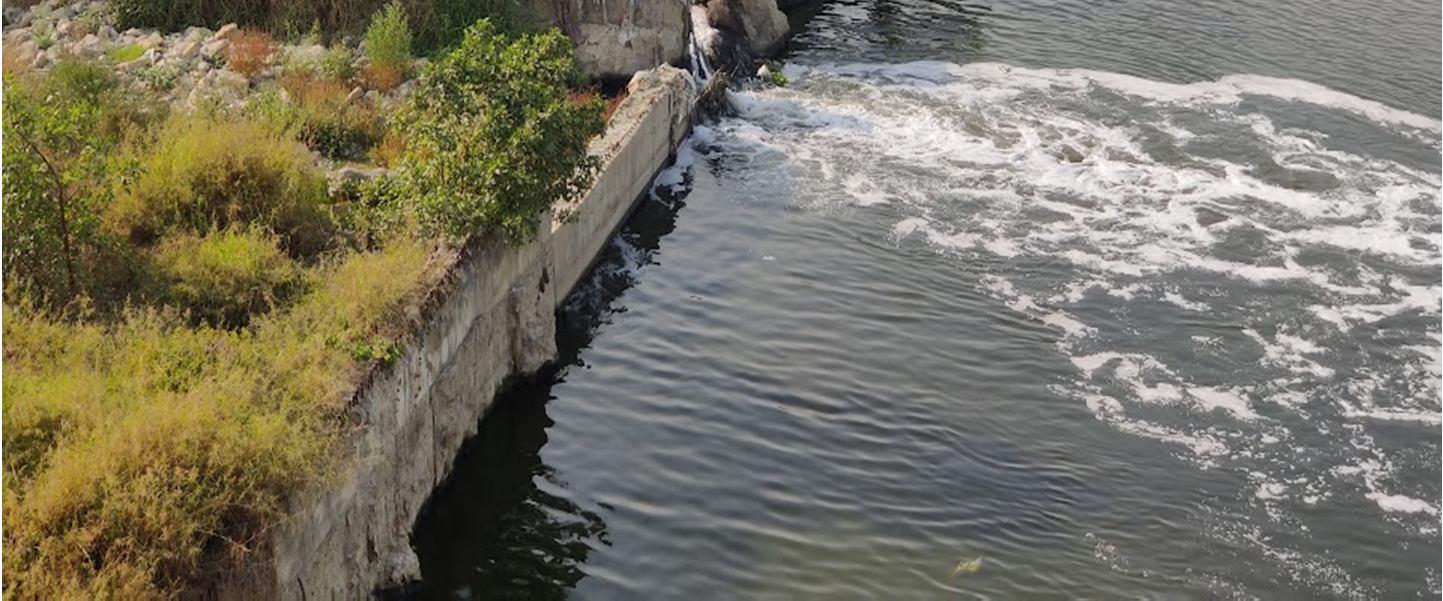
Abstract: This study set out to ascertain the degree of contamination in the Kukrail Nala and how much it contributed to the pollution of the Gomti River. The Kukrail Nala begins in the Kukrail Forest and confluences with the Gomti River after travelling approximately 26 kilometres, passing through the centre of the city. As a result, the Kukrail Nala's pollution will have an impact on the health of Citizens, particularly those who live nearby. The Gomti River and Kukral Nala run through Lucknow, the state capital of Uttar Pradesh. Due to human involvement and the discharge of municipal and industrial trash, Kukrail Nala and Gomti River, located in the centre of the Ganga Plain, suffered severe damage downstream of Lucknow. The nala is extremely contaminated, with high levels of Biochemical oxygen Demand (BOD) and Chemical oxygen demand(COD), even in the summer. Due to the extremely low and almost negligible flow of the Kukrail Nala, it is likely that the pollution may percolate there and eventually reach the ground water. People who live close to the nala regularly depends upon the groundwater for various activities like drinking, bathing and other household activities ground water, which could have an impact on their health. Speaking of more than just humans, it also harms animals within and outside of water bodies. The way that technological advancements are affecting everyone's lives is having a tremendously negative impact on natural resources. This study focuses on the extent to which Kukrail Nala has been dangerously exploited and how it may have an impact on other larger water sources and as well effect being associated with these water bodies.
The most prevalent physical substance and clear liquid on earth is water. Two hydrogen atoms and one oxygen atom make up the water molecule. Water serves as the basis for all life. On a planet with water, water is a vital natural resource for the survival of humans, plants, and animals. It is an essential component of all life processes, thus humans cannot exist for very long without it. In rural and many urban areas of developing countries, the availability of safe and sufficient drinking water is a critical concern. Groundwater is a dependable and limited source of water in rural areas. Around the world, groundwater is a crucial source of water. Through a well or a bore, groundwater can be drained. A key element of the water resources used for domestic, industrial, and drinking purposes is groundwater. Groundwater is polluted by waste disposal facilities, animal waste, leaking underground storage tanks, industrial chemical waste from pesticides and fertilisers, and by lands utilised for extensive agriculture. Groundwater contamination can make it unfit for a variety of uses, and its restoration is challenging, time consuming, and expensive. Both the environment and human health may be harmed by it. Health. When groundwater is contaminated, it means that it contains too many contaminants for it to be used as intended. Concerns have been raised all over the world about the impact of increasing urbanisation and industrialisation on the management of water resources. There have been significant quantitative as well as qualitative constraints on surface water resources as a result of historical settlement and ongoing development in the area of waterways. Drinkable water is increasingly necessary to meet the demands of each population, particularly in expanding nations. Therefore, it is necessary to control pollution and contamination.
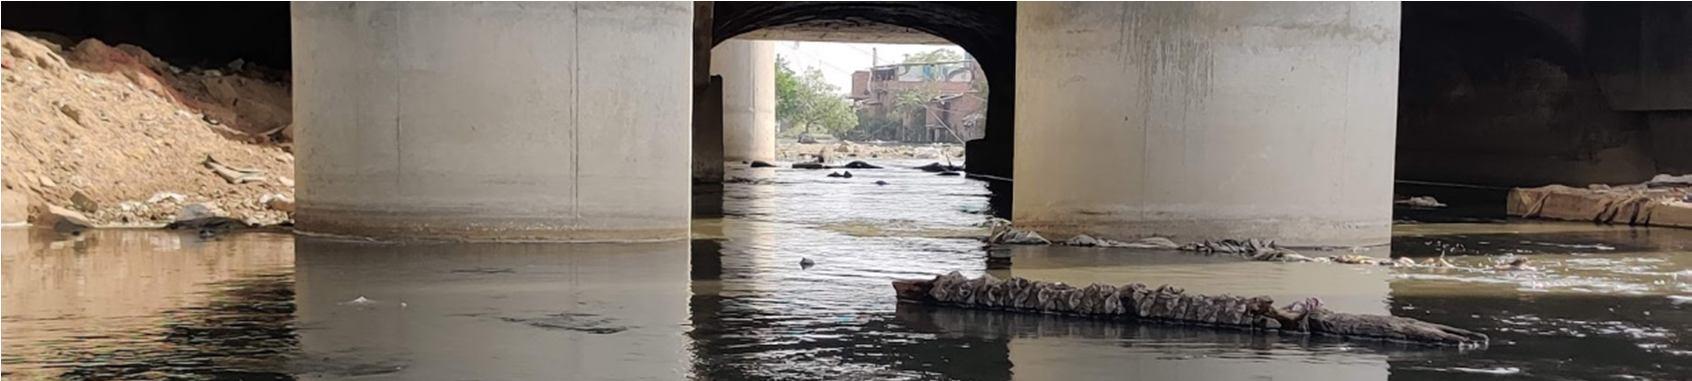
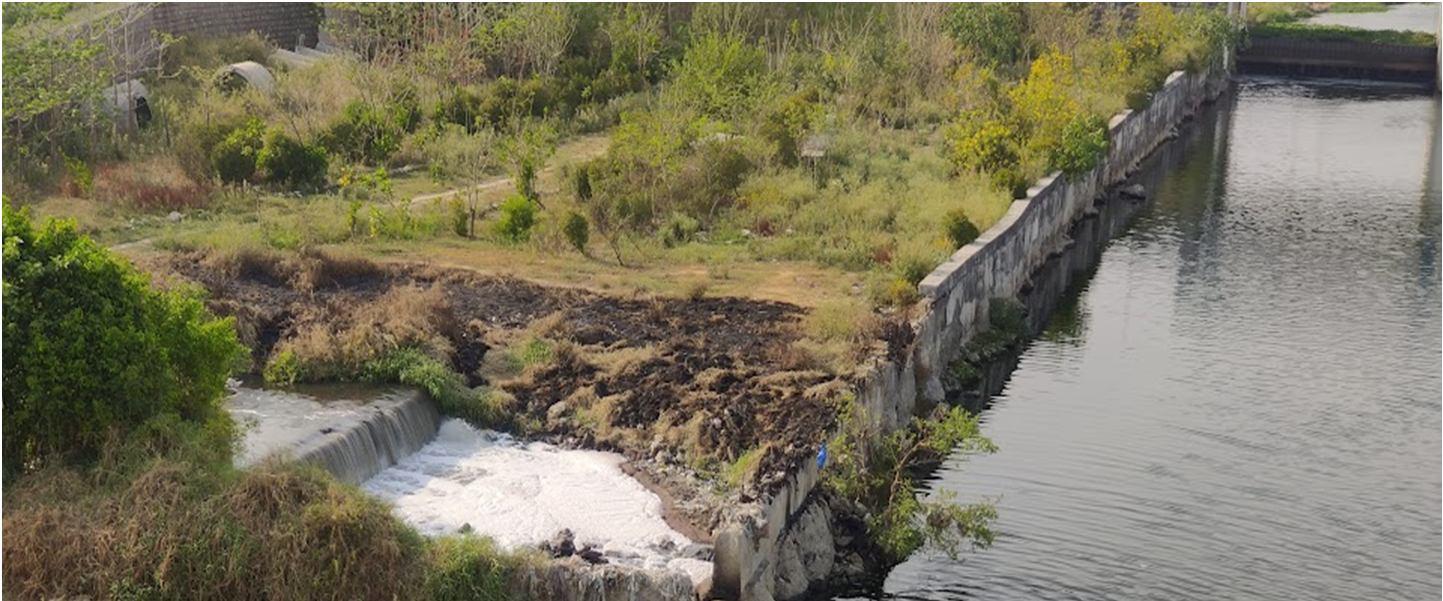
A left bank tributary of the Gomti River is the Kukrail Nala. This fourth order (medium stream) tributary of the Gomti River is a groundwater fed stream that rises in the Kukrail Reserved Forest and Confluence at Gomti River. It has a 200 metre wide flood plain.
As per government data, the Kukrail nala extends for a total distance of around 26 kilometres from its source to the site of confluence. It is a natural drain of Gomti River and carrier untreated sewage and water to the river. All this washed down into the natural drain when it rains
ISSN: 2321 9653; IC Value: 45.98; SJ Impact Factor: 7.538 Volume 10 Issue XI Nov 2022 Available at www.ijraset.com
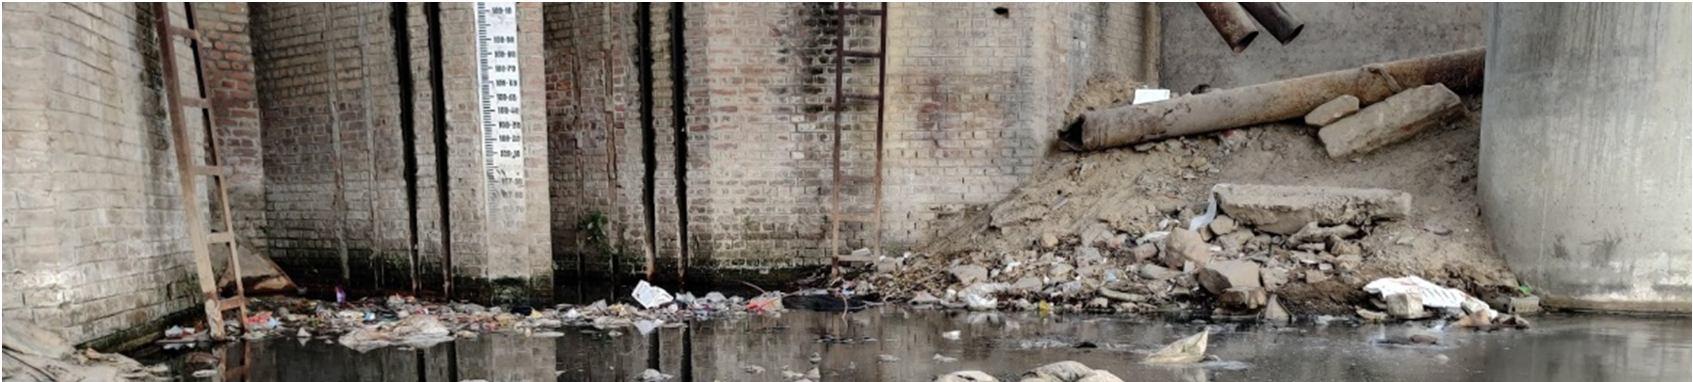
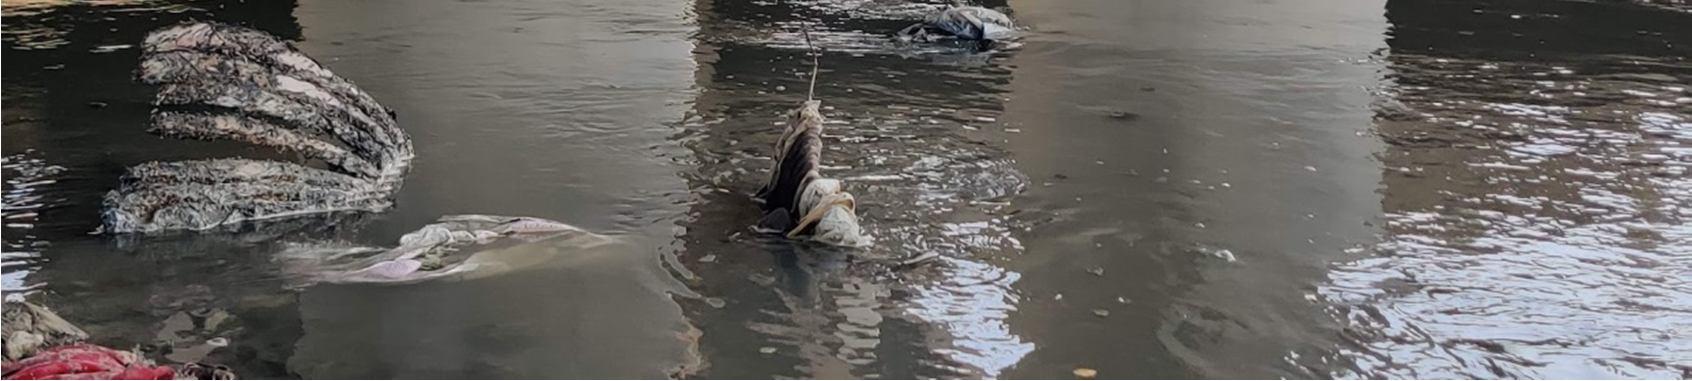
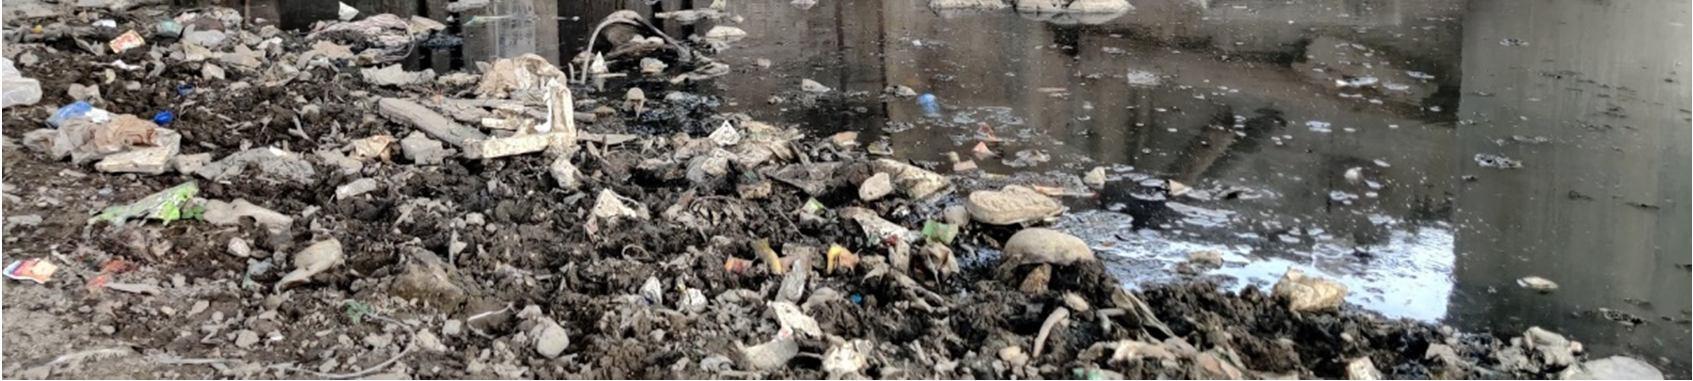
Human activities and livestock’s around kukrail nala pollute its water. All these factors are choking gomti Blood line. Due to excess sedimentation its water is stagnant at several places giving rise to epidemic and other fatal diseases. Kukrail nala opens all pollution and run off to river at confluence near gomti barrage. Rather than intercepting natural drain falling into the river, we should intercept Sewage and waste washing into the drains. That’s the key to save the river and improve lives in Lucknow. It needs working sewage and waste management system not mega concrete structure for Pomp and show.
A tributary of the Ganges, the Gomti is also referred to as the Gomti. According to the Bhagavad Gita, one of the fundamental texts of Hinduism, Gomti was one of India's five eternal streams. Within is a special Gomti Chakra. Water was conserved and directed into the Gomti River by the construction of the check dam at the Behta River, which includes several of its tributaries. Gomti's tributaries must be rehabilitated because if it receives enough water, contamination won't pose a threat to the river. The river's evergreen nature is one of its features. The river flows slowly all year long, with the exception of the monsoon season, when heavy rains cause a huge surge in runoff. At Hanuman Setu in Lucknow and Maighat in Jaunpur, the 75 percent predictable flow in September was 125 cumec and 450 cumec, respectively. The mean lean inflow for each of these locations in April was 15 cumec and 25 cumec, respectively. Cities along the banks of the Gomti River receive drinking water in addition to Lucknow. Among them are Lakhimpur Kheri, Sultanpur, and Jaunpur. Although the rivers in all of the aforementioned places are polluted, Lucknow has the worst problem, with the majority of the river resembling a sewer.
ISSN: 2321 9653; IC Value: 45.98; SJ Impact Factor: 7.538 Volume 10 Issue XI Nov 2022 Available at www.ijraset.com
The river appears to be under "attack" at various points along its journey from downstream of Sitapur to upstream of Sultanpur as it meanders through the industrial zone of the sugar making, papers, and hardwood industries. For the 15 different sized cities in its river watershed, such as Lucknow, Sultanpur, and Jaunpur, the river is increasingly acting as a running dumping ground for anything from industrial garbage to household waste. The river is still comparatively clean as it washes itself thanks to natural oxidation.
The Gomti River travels through the alluvial plains of Uttar Pradesh for 940 kilometers (580 miles), where it is poisoned at several points. The primary source of contamination is home sewage as well as industrial waste from the Indian subcontinent and sugar refineries. The Kukrail Drainage is one of the many rivers and streams that pass through an area with a population of around 18 million people and pick up a significant quantity of industrial and human contaminants. High pollution levels pose a hazard to the aquatic life of the Gomti. On July 25, 2008, the cornerstone was laid for a 345 million litre (91,000,000 US gal) sewage treatment facility. The factory, which was advertised as Asia's largest, failed; in 2014, it appeared to be functioning at 10% capacity, and untreated wastewater and solid garbage overflowed the river beyond the plant (near Bharwara). The device was created to block the Gomti's 23 enormous natural drainage channels. The Gomti is currently the most historically contaminated river in Uttar Pradesh. The water is not safe to drink, according to the state pollutant control board. The contamination has gotten so bad that it is now harming the river's biodiversity.
Polluted water can contain bacteria that cause cholera, dysentery, typhoid, hepatitis A, polio, and diarrhoea. According to the UN, over 297,000 children under the age of five pass away each year from diseases brought on by unclean, unsanitary, or poisoned drinking water. Waterway or large body of water pollution causes acidic lakes, raises water temperatures, encourages the spread of algal blooms, and reduces dissolved oxygen levels. It's possible that fish and other aquatic animals will have to leave their existing habitats in search of water that is far more suited to them. Skin infections, allergies, and other issues can result from bathing in contaminated river systems. Drinking contaminated water can cause tuberculosis, cancer, a lack of calcium from human and animal bones, vision loss and impotence in men, sterility in women, and a host of other major health problems.
ISSN: 2321 9653; IC Value: 45.98; SJ Impact Factor: 7.538
Volume 10 Issue XI Nov 2022 Available at www.ijraset.com
1) Due to pollution, the majority of waterborne infectious diseases are transmitted via the fecal oral route. Health risks from contaminated water include cancer, diarrhoea, respiratory conditions, neurological conditions, and cardiovascular issues.
2) Degradation of the biodiversity. Aquatic environments are deprived by polluted water, which also contributes to eutrophication, or the unchecked growth of phytoplankton in rivers.
3) Contamination has entered the food chain.
4) There is a lack of clean water for drinking.
5) Diseases.
6) Infant mortality is a significant issue.
1) To understand the level of pollution in the Gomti River due to Kukrail Nala.
2) To reduce pollution in Kukrail Nala.
3) To research how pollution affects ground water.
4) The health effects of using contaminated groundwater.
5) To Know the Soil Characteristic Of Nearby Area of Kukrail Nala
6) To prevent diseases that humans acquire from water.
In this portion of the project, research is conducted by taking a sample of water from Kukrail Nala and a corresponding sample of groundwater, and by analysing the water parameter for various seasons.
Step 1 Learn about the history of the Gomti River and Kukrail Nala.
Step 2 Finalize Duration of study.
Step 3 Choose two different seasons for collecting water Sample
Step 4 Select the Sampling Location
Step 5
Check for characteristcs of soil near the sampling Points with help of "Jar Test".
Step 6 Take water samples in June during the summer and in September during the monsoon season.
Step 7 Take 2 sample from each Sampling Site for Each Season (Total 12 samples)
Step 8 Calculating Percolation Rate
Step 9 Select parameters of water to be studied.
Step 10 Test the Sample Water Collected
Step 11 State Result and conclusion
Fig. 1 Flow chart of Study analyse in 11 steps
Physical Parameter


Chemical Parameter


ISSN: 2321 9653; IC Value: 45.98; SJ Impact Factor: 7.538
Volume 10 Issue XI Nov 2022 Available at www.ijraset.com
Temperature Colour odour Total DissolvedSolids
Electrical conductivity pH
Turbidity
Hardness
Dissolved oxygen Bio chemical oxygen demand BOD
Chemical oxygen demand COD
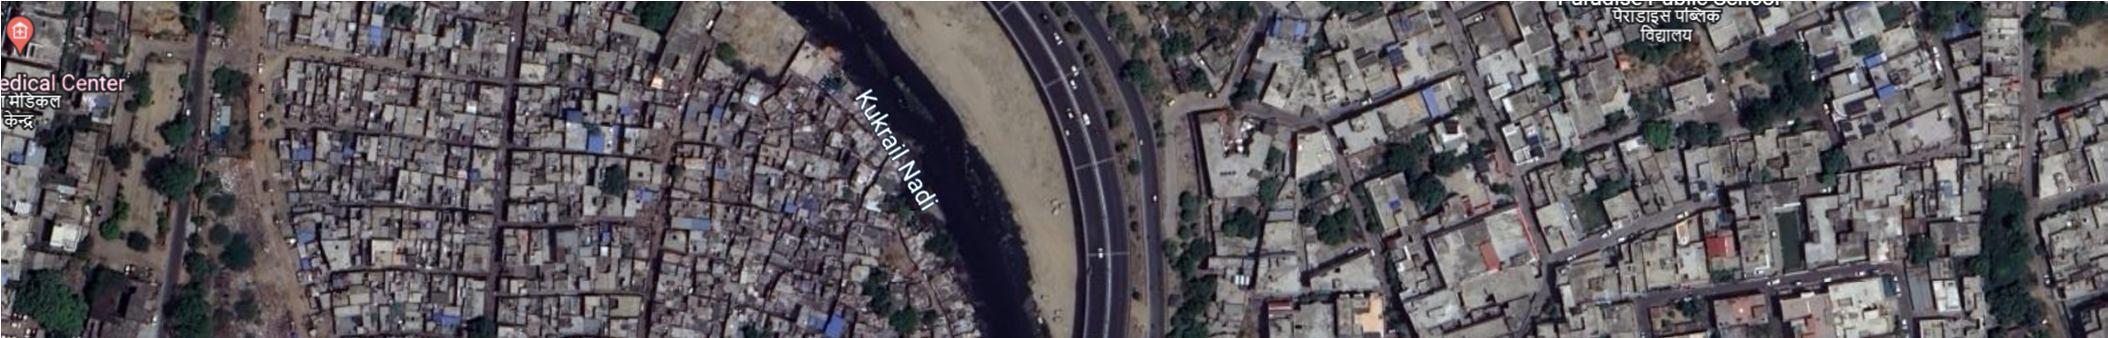
In the current study, 12 samples are taken from the groundwater and kukrail nala throughout a 3,000 meter stretch in the months of June (summer) and September (Monsoon).
The sampling sites are
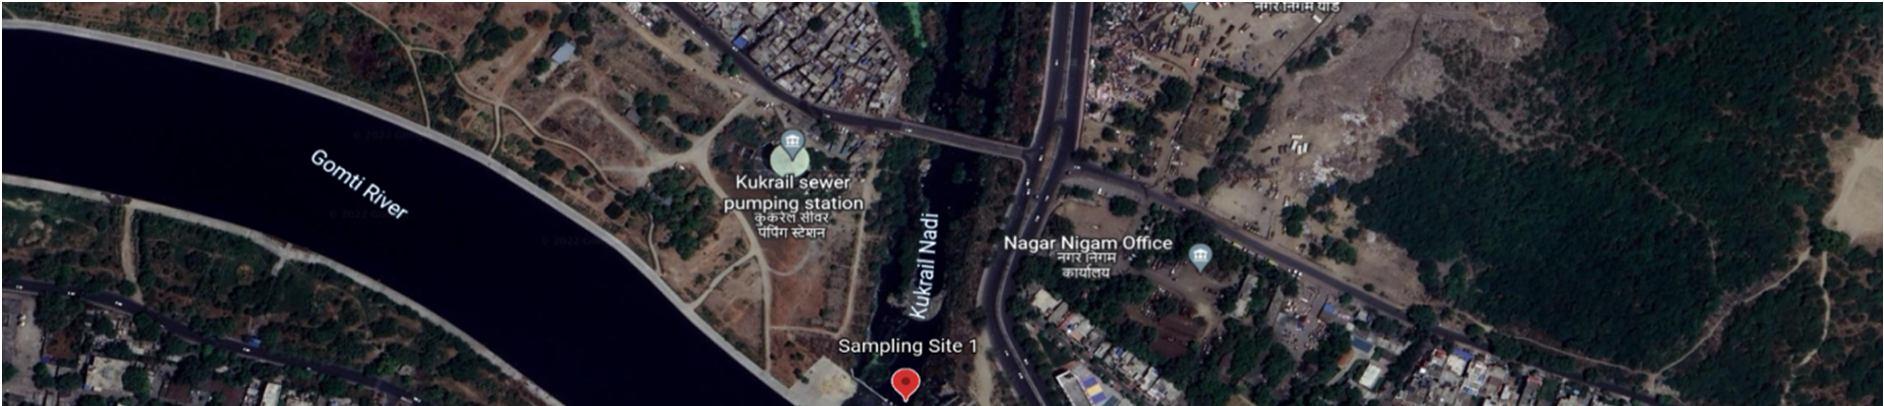
1) Sampling Site 1 (S1)
(Co ordinates: 26.85992232806865, 80.96781002883613)
Located near Gomti River, it is the point where kukrail nala Discharges it’s sewage into the gomti river). https://www.google.com/maps/place/26%C2%B051'35.7%22N+80%C2%B058'04.1%22E/@26.859922,80.9590767,15z/data=!3m1 !4b1!4m4!3m3!8m2!3d26.8599223!4d80.96781
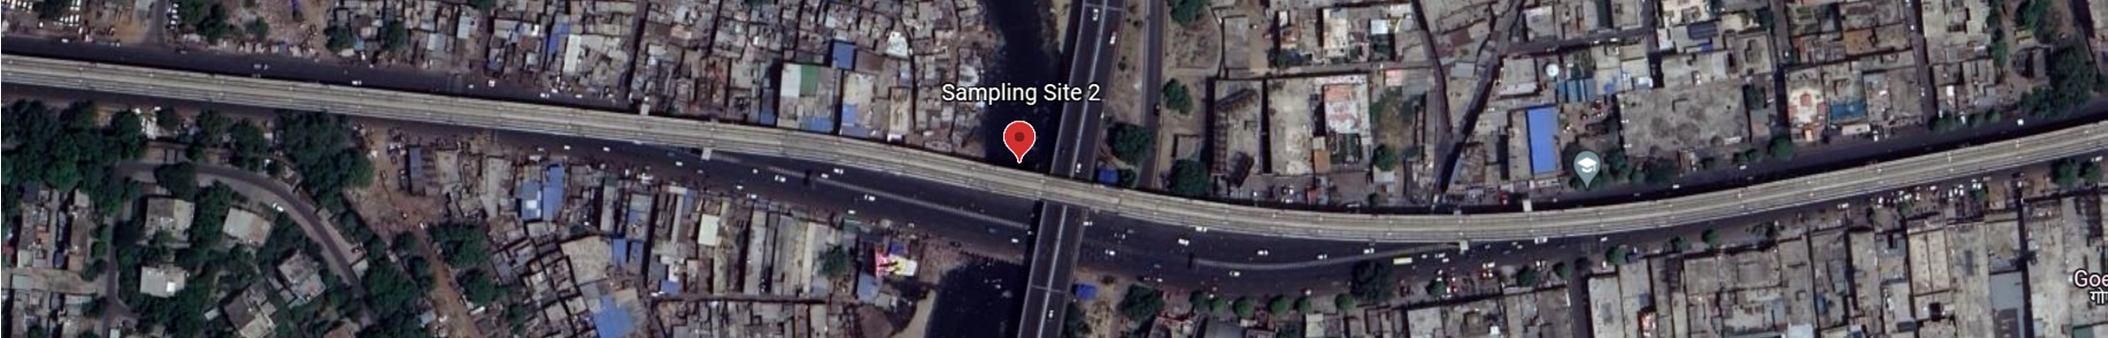
2) Sampling Site 2(S2)
(Co ordinates: 26.870411, 80.968250).
Located 1 kilometre in air from the Gomti River and too from sampling site 1. https://www.google.com/maps/place/26%C2%B052'13.5%22N+80%C2%B058'05.7%22E/@26.8704107,80.9595167,15z/data=!3m 1!4b1!4m4!3m3!8m2!3d26.870411!4d80.96825
ISSN: 2321 9653; IC Value: 45.98; SJ Impact Factor: 7.538 Volume 10 Issue XI Nov 2022 Available at www.ijraset.com
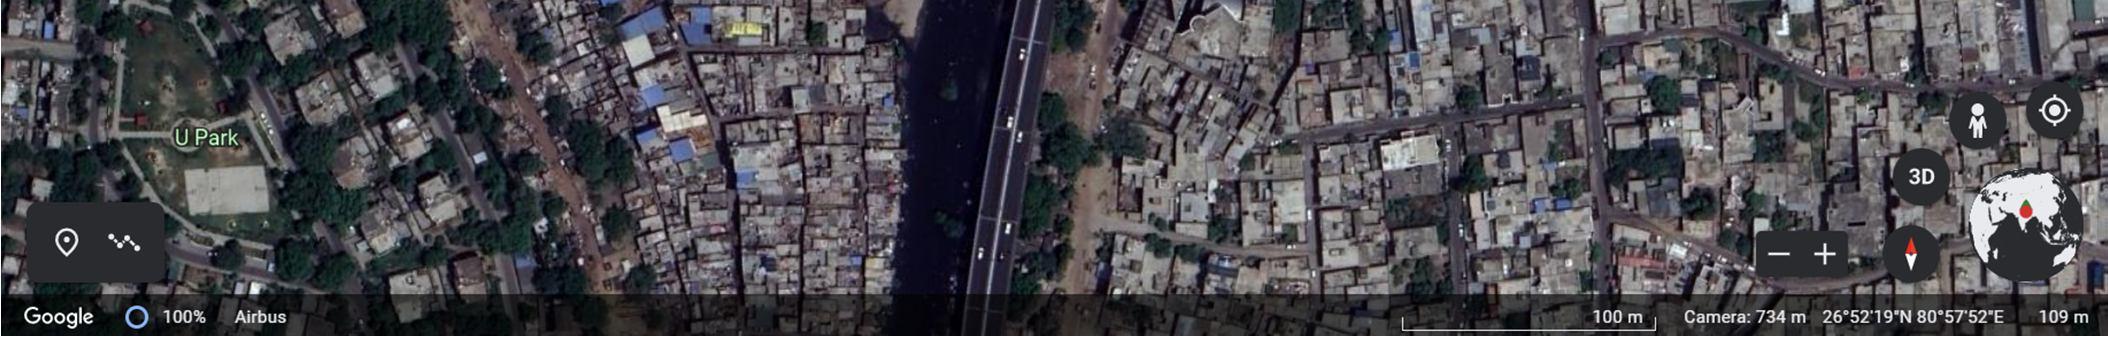
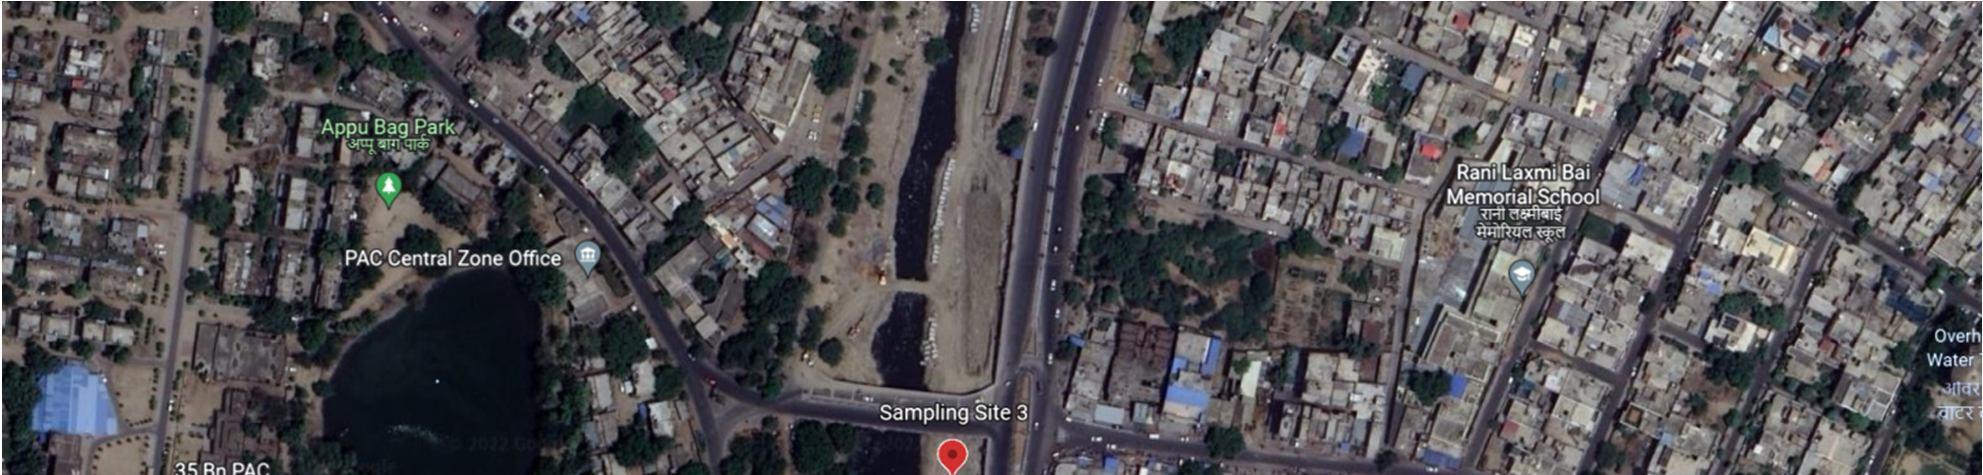
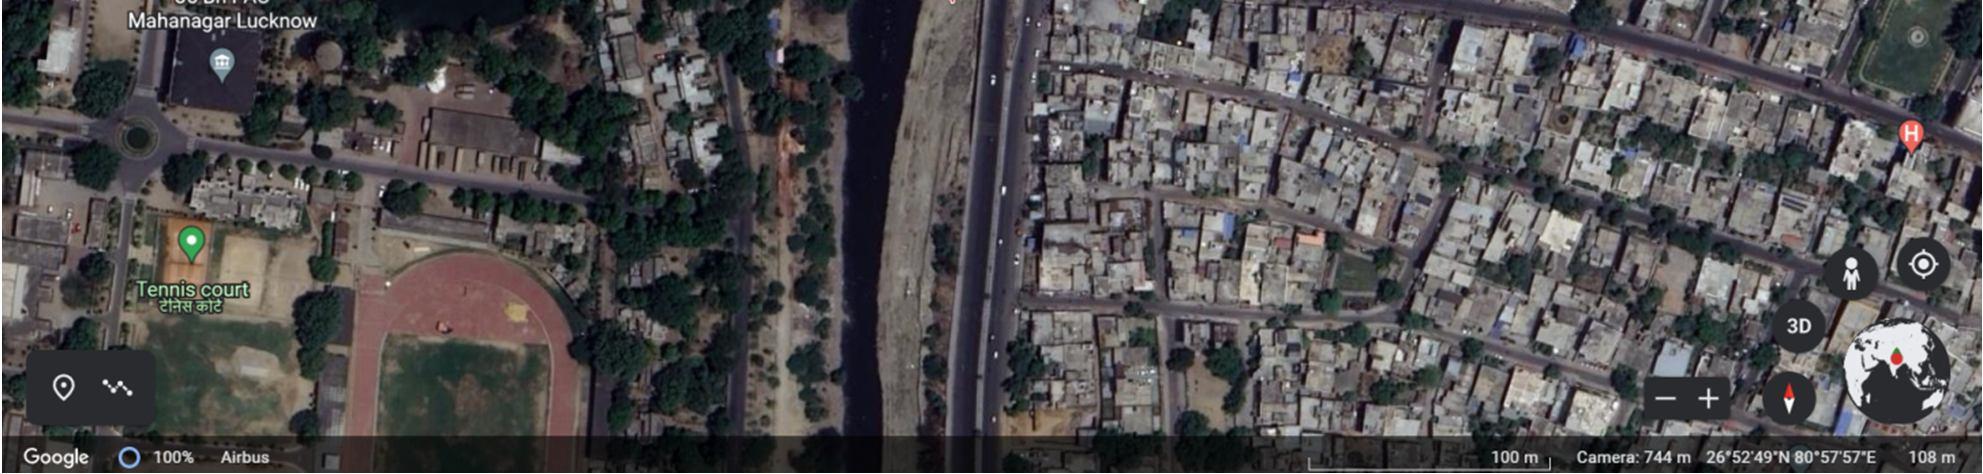
(Co ordinate: 26.880440466557772, 80.96588451091492)
Located 2 kilometre in air from Gomti River and 1 kilometre from sampling site 2 https://www.google.com/maps/place/26%C2%B052'49.6%22N+80%C2%B057'57.2%22E/@26.8804402,80.9571512,15z/data=!3m 1!4b1!4m4!3m3!8m2!3d26.8804405!4d80.9658845
Sample collection, storage and water sample analysis has been done according to the standard method for the examination of water and waste water (APHA 2012).
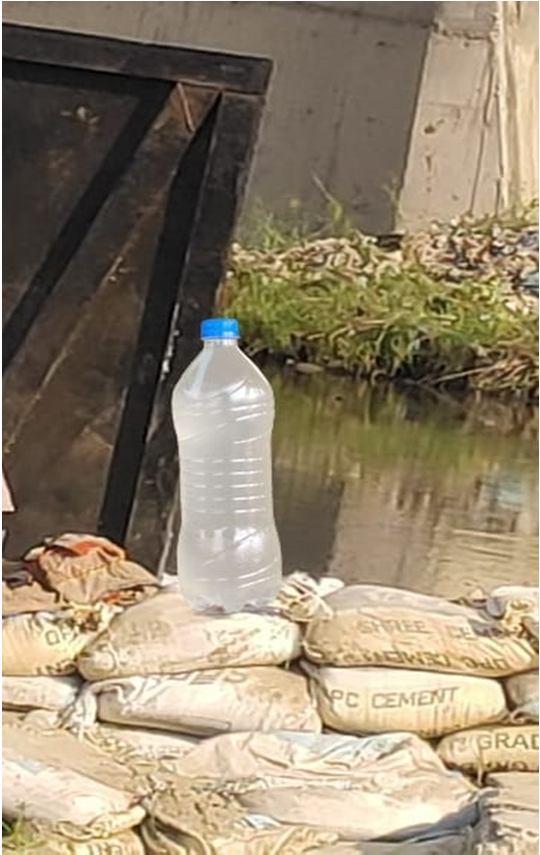
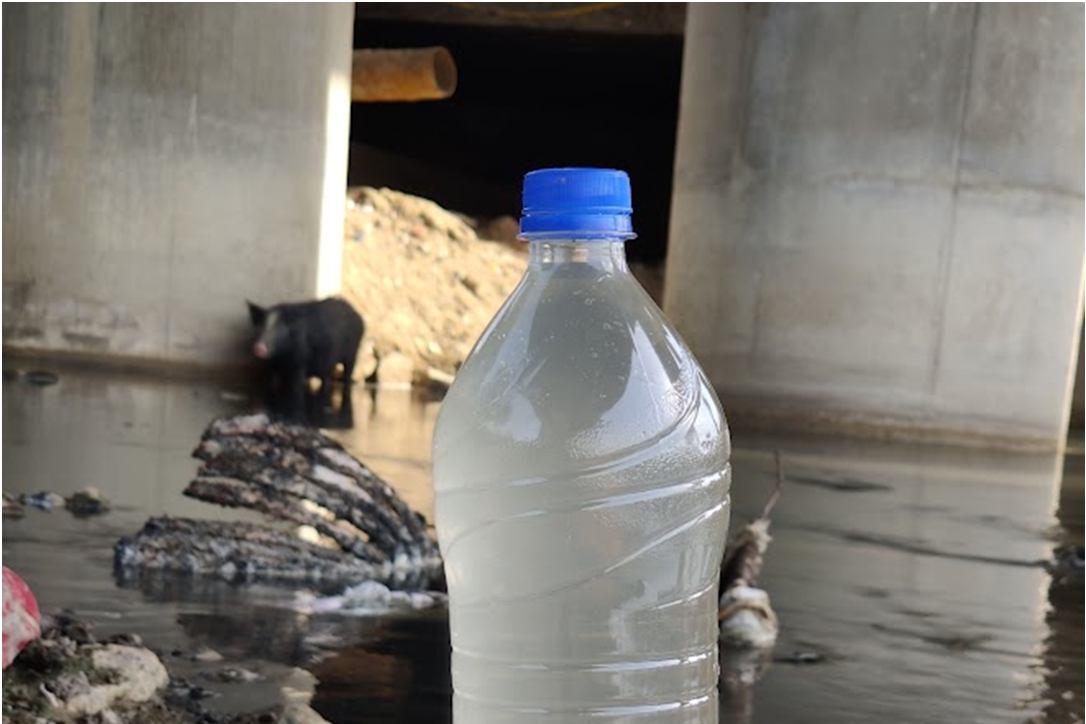
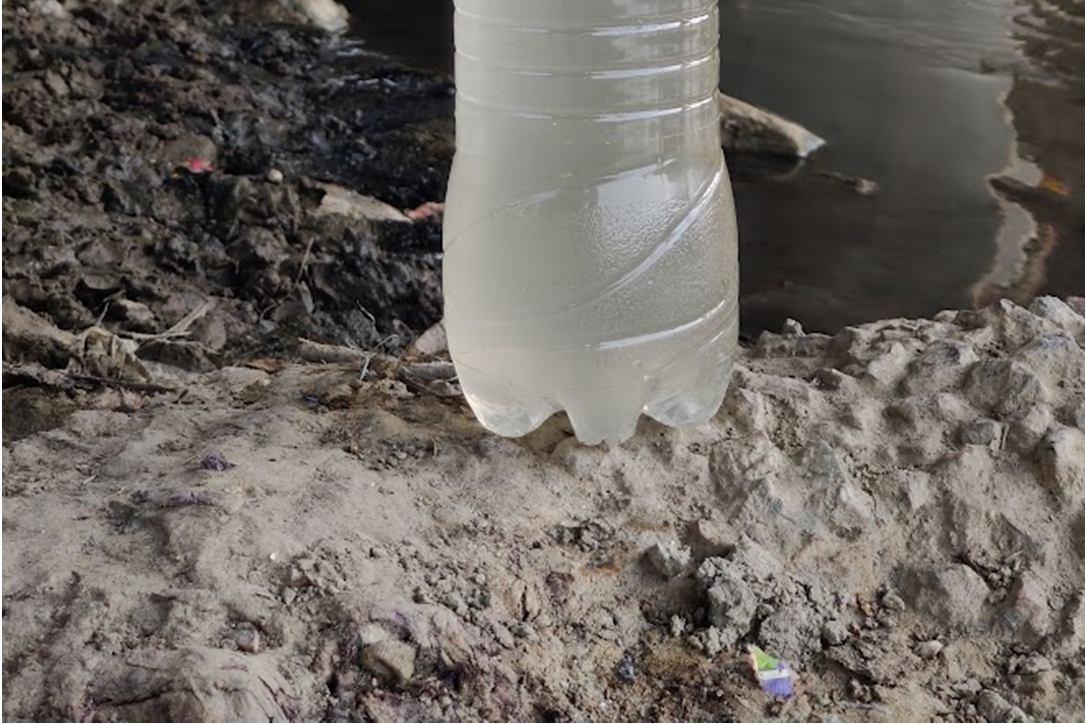
The samples are collected from well mixed segments of the nala in high density poly ethylene (HDPA) bottles, after proper sensing with water samples at respecting site using a cylindrical bailer.
The samples were collected and maintained in an incubator at 4 °C for further testing
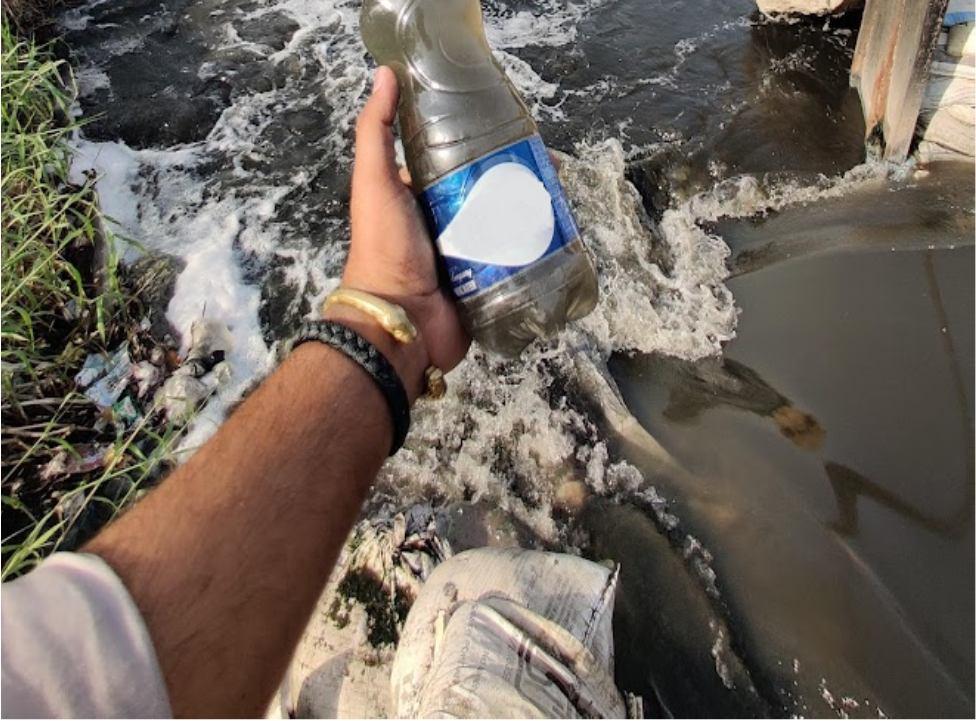
A sample was taken from Sampling Site 1 using a cylindrical bailer and placed in a High Density Polyethylene (HPDA) bottle. The samples were then collected and kept at 4 °C in an incubator for further testing.
Two samples were taken: one from the kukrail nala and the other from the corresponding ground water in a nearby open well, hand pump, or bore well
Fig. 4 Water Sample Collected from Site 1

ISSN: 2321 9653; IC Value: 45.98; SJ Impact Factor: 7.538 Volume 10 Issue XI Nov 2022 Available at www.ijraset.com
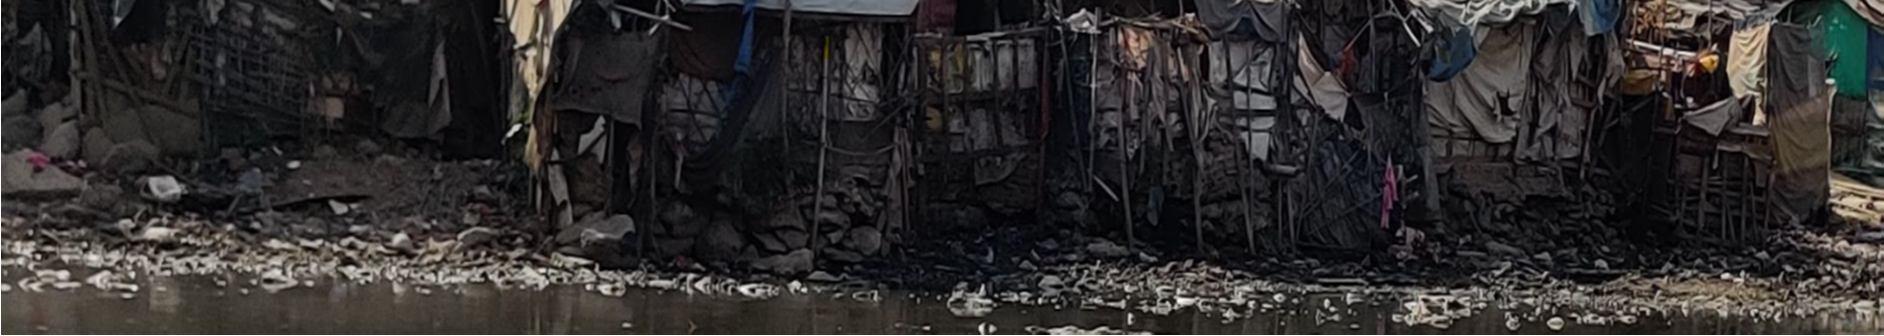
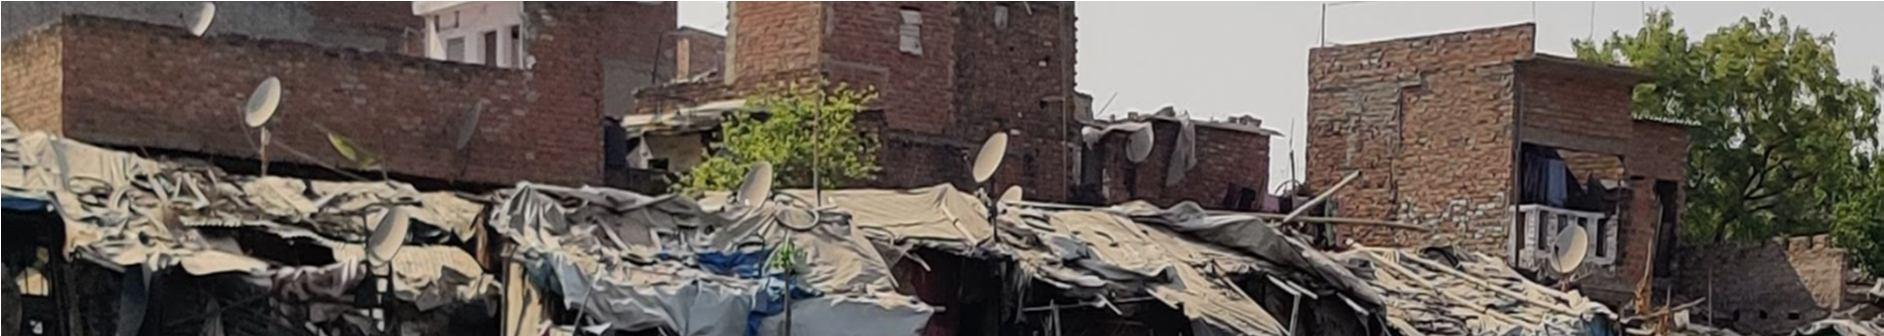
Groundwater was taken from Hand pumps and Submersible pumps of the houses near the Sampling Sites using a cylindrical bailer and placed in a High Density polyethylene (HPDA) bottle. The samples were then collected and kept at 4 °C in an incubator for further testing.
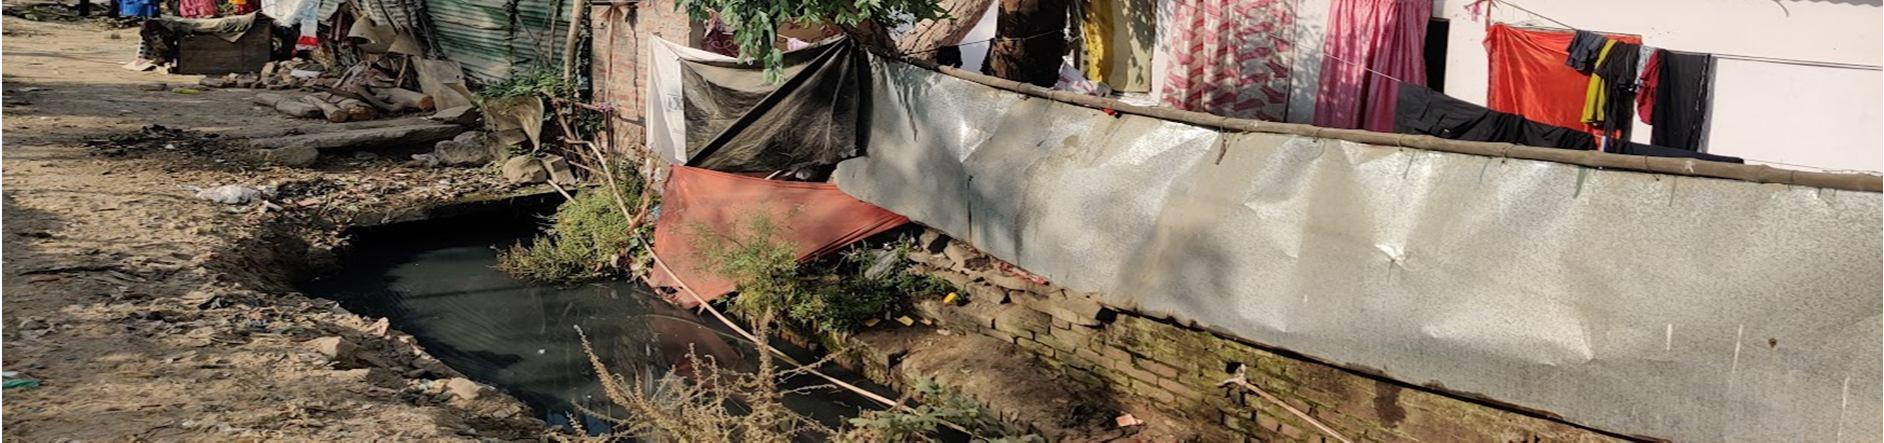
Fig: house near kukrail nala from where the ground water sample is collected.
ISSN: 2321 9653; IC Value: 45.98; SJ Impact Factor: 7.538
Volume 10 Issue XI Nov 2022 Available at www.ijraset.com
S U M M E R S E A S O N
Water Samples
Surface Water Ground Water W/S 1 Pungent Smell Musty Smell W/S 2 Pungent Smell Musty Smell W/S 3 Pungent Smell Musty Smell
M O N S O O N S E A S O N
Water Samples Surface Water Ground Water W/S 1 Pungent Smell Musty Smell W/S 2 Pungent Smell Musty Smell W/S 3 Pungent Smell Musty Smell
Water Samples
S U M M E R S E A S O N
Surface Water Ground Water W/S 1 25 13 W/S 2 21 17 W/S 3 23 15
M O N S O O N S E A S O N
Water Samples
Temprature(°C) Summer Season
Surface Water Ground Water W/S 1 17 13 W/S 2 15 14 W/S 3 16 15 Fig. 9
Temprature(°C) Monsoon Season
ISSN: 2321 9653; IC Value: 45.98; SJ Impact Factor: 7.538 Volume 10 Issue XI Nov 2022 Available at www.ijraset.com
S U M M E R S E A S O N
Water Samples
Surface Water Ground Water W/S 1 6.8 7.3 W/S 2 7.74 7.2 W/S 3 6.3 7.5 M O N S O O N S E A S O N
Water Samples Surface Water Ground Water W/S 1 7.2 7 W/S 2 8 7.6 W/S 3 7.8 7.04
pH(Summer Season) Surface Water Ground Water
Water Samples
8
7.8
7.6
7.4
7.2
7
6.8
6.6
6.4
pH(Monsoon Season) Surface Water GroundWater
8.2 W/S 1 W/S-2 W/S 3
Fig. 10 pH Test of water samples in Different season
S U M M E R S E A S O N
Surface Water Ground Water W/S 1 216 15 W/S 2 195 16 W/S 3 200 10 M O N S O O N S E A S O N
Samples
0 20 40 60 80 100 120 140 160 180
Turbidity(NTU) Summer Season
ISSN: 2321 9653; IC Value: 45.98; SJ Impact Factor: 7.538
Volume 10 Issue XI Nov 2022 Available at www.ijraset.com
Turbidity(NTU)Monsoon Season
W/S-1 W/S-2 W/S-3
Summer Monsoon
200
150
100
50
0
250 W/S-1 W/S-2 W/S-3
Fig. 11 Turbidity Test of water samples in Different season
6) Electrical Conductivity (Micro Siemens per centi meter) S U M M E R S E A S O N
Water Samples
Surface Water Ground Water W/S 1 982.7 14.44 W/S 2 456.4 11.08 W/S 3 470.2 12.22 M O N S O O N S E A S O N
Water Samples
Surface Water Ground Water W/S 1 527.7 8.24 W/S 2 305.6 8.25 W/S 3 228.7 2.11
1000
800
600
400
200
1200 W/S 1 W/S-2 W/S 3
ElectricalConductivity (µs/cm) (Summer Season) Surface Water Ground Water
ElectricalConductivity (µs/cm) (Monsoon Season)
500
400
300
200
Surface Water Ground Water 0
100
0
600 W/S 1 W/S-2 W/S 3
Surface Water Ground Water
Fig. 12 Conductivity of water samples in Different season
7) Total Dissolved Solids (milligram per litre)
Water Samples
ISSN: 2321 9653; IC Value: 45.98; SJ Impact Factor: 7.538 Volume 10 Issue XI Nov 2022 Available at www.ijraset.com
S U M M E R S E A S O N
Surface Water Ground Water W/S 1 447.78 9.92 W/S 2 198.07 8.28 W/S 3 201.07 8.30 M O N S O O N S E A S O N
Water Samples Surface Water Ground Water W/S 1 239.3 5.16 W/S 2 165.2 5.20 W/S 3 198.07 7.37
Total Dissolved Solids (mg/l) (Monsoon Season)
450
400
350
300
250
200
150
100
50
0
Total Dissolved Solids (mg/l) (Summer Season) Surface Water GroundWater
500 W/S 1 W/S-2 W/S 3
250
200
150
100
50
0
300 W/S 1 W/S-2 W/S 3
Surface Water GroundWater
Fig. 13 Total Dissolved Solids Test of water samples in Different season
8) HARDNESS(mg/l or CaCO3) S U M M E R S E A S O N
Water Samples
Surface Water Ground Water
W/S 1 540 66 W/S 2 426 86 W/S 3 340 70 M O N S O O N S E A S O N
Water Samples
Surface Water Ground Water W/S 1 336 108 W/S 2 340 115 W/S 3 415 80
Hardness (mg/l) (Summer Season)
ISSN: 2321 9653; IC Value: 45.98; SJ Impact Factor: 7.538
Volume 10 Issue XI Nov 2022 Available at www.ijraset.com
Hardness (mg/l) (Monsoon Season)
500
400
300
200
100
0
600 W/S 1 W/S-2 W/S 3
Surface Season Ground Water
0 50 100 150 200 250 300 350 400 450 W/S 1 W/S-2 W/S 3
Water Ground Water
Fig. 14 Hardness Test of water samples in Different season
9) Dissolved Oxygen(mg/l) S U M M E R S E A S O N
Water Samples
Surface Water Ground Water W/S 1 2.5 5.02 W/S 2 2.7 5.50 W/S 3 1.8 6.00 M O N S O O N S E A S O N
Water Samples
Surface Water Ground Water W/S 1 4.2 5.10 W/S 2 4.2 5.91 W/S 3 3.08 5.5
Bio Oxygen Demand (mg/l) (Summer Season) Surface Water Ground water
Bio Oxygen Demand (mg/l) (Monsoon Season)
6
5
4
3
2
1
0
7 W/S 1 W/S-2 W/S 3
Surface Water Ground Water
Fig. 15 Bio Oxygen Demand Test of water samples in Different season
Water Samples
ISSN: 2321 9653; IC Value: 45.98; SJ Impact Factor: 7.538
Volume 10 Issue XI Nov 2022 Available at www.ijraset.com
S U M M E R S E A S O N
Surface Water Ground Water
W/S 1 309.60 11.90 W/S 2 260.30 35.00 W/S 3 316.11 14.00
M O N S O O N S E A S O N
Water Samples
Surface Water Ground Water W/S 1 328 28.96 W/S 2 275 30.00 W/S 3 290 22.64
Bio Oxygen Demand (mg/l) (Summer Season)
Bio Oxygen Demand (mg/l) (Monsoon Season)
350
300
250
200
150
100
50
0
W/S 1 W/S-2 W/S 3
Surface Water Ground Water
11) Chemical Oxygen Demand (Milligram per litre)
Water Samples
300
250
200
150
100
50
0
350 W/S 1 W/S-2 W/S 3
Surface Water Ground Water
S U M M E R S E A S O N
Surface Water Ground Water
W/S 1 224.32 30 W/S 2 435.00 24.34 W/S 3 430.22 30
M O N S O O N S E A S O N
Water Samples
Surface Water Ground Water W/S 1 450 42.25 W/S 2 390 40.56 W/S 3 422.92 61.60
500
450
400
350
300
250
200
150
100
50
Bio Oxygen Demand (mg/l) (Summer season)
ISSN: 2321 9653; IC Value: 45.98; SJ Impact Factor: 7.538
Volume 10 Issue XI Nov 2022 Available at www.ijraset.com
Bio Oxygen Demand (mg/l) (Summer season)
0
W/S 1 W/S-2 W/S 3
Surface water Ground Water
450
400
350
300
250
200
150
100
50
0
500 W/S 1 W/S-2 W/S 3
Surface Water GroundWater
According to the tests done on the sample that was taken, the majority of the test parameters were beyond the allowable limit and unfit for consumption. The release of industrial waste, human activity and animal activities are to blame for the pollution of Kukrail Nala. The percolation of kukrail nala's waste water into the ground water is the primary cause of contamination. The soil's salt concentration has likely increased as a result of the application of dirty ground water to the area around the Kukrai'l Nala, where ground water quality has deteriorated.
However, if pollution in Kukrail Nala does not decrease, it could lead to significant issues in the future. Therefore, this study can offer the requisite information for the authority to pursue the sustainable approaches on groundwater management and contamination prevention
The results obtained helps in making the public, local administrator and the government to be aware of the dilemma of poor groundwater quality prevailing in these areas. Since, in the future the groundwater will have the major share of water supply schemes, plans for the protection of groundwater quality is needed. Hence, this research plays an experimental work on ground water quality assessment in the nearby area of Kukrail Nala in Lucknow district of Uttar Pradesh.
1) Increase in air temperature during summer may be due to increased intensity of solar radiation. Conversely reduction in air temperature during monsoon is due to rainfall, cloudy weather and increased humidity. Similar to the present result, high and low water temperatures in Kukrail Nala were recorded during the summer and monsoon seasons respectively. In fact air temperature of a given season determines the water temperature of that season; the former is determined by intensity of solar radiation.
2) The low pH during Summer season could be due to enrichment of organic matter and subsequent decomposition. The low pH during summer season may also be due to biological activities of organisms. Reduction in pH at all three stations during monsoon could be due to dilution of the medium while increase in summer is possibly due to enrichment of alkaline materials after evaporation.
3) With reference to alkalinity, the highest level recorded at all stations in summer could be due to evaporation of water and subsequently increased salts of weak acids. Conversely, reduction in total alkalinity in monsoon may be due to dilution of the system by.
ISSN: 2321 9653; IC Value: 45.98; SJ Impact Factor: 7.538 Volume 10 Issue XI Nov 2022 Available at www.ijraset.com
4) Increase in TDS at midstream stations during summer season could be due to enrichment of organic matter from intensive sources (solid wastes, land runoff and industrial drain). High levels of TDS recorded at midstream and downstream stations during summer could be due to evaporation of water while the reverse in monsoon may be due to dilution as reported earlier form the sampling site.
5) Eventhough there are no major seasonal variations in conductivity, it gradually increased from comparison with groundwater to surface water, which indicated a corresponding increase in salts and solutes due to pollution. Sampling Sites showed a very little or no Seasonal variation in the conductivity as recorderd from the sampling. Constant drain of solute and salts in the kukrail nala from various sources(open sewage drains, land runoff, industrial waste discharge) into the kukrail nala may retain the conductivity constant irrespective of the Seasons.
6) Increase in total hardness during summer season could be due to evaporation of water for the surface of kukrail nala. Reduction in total hardness during monsoon season could be an opposite effect due to dilution of the medium.
7) The high level of DO recorded during summer season at stations Sampling Site 1, Sampling Site 2 and Sampling Site 3 could be attributed to photosynthetic input from algal producers. Occurrence of green algae in the water at these stations supported this conclusion. DO remaining unutilized at unpolluted in the groundwater during summer; while it is utilized for decomposing organic load at the surface water of kukriail nala for all station . Thus DO contents of the water at all the Sampling Sites are relatively high when compared to the corresponding groundwater The reduction in DO at all three sampling sites during monsoon is possibly due to reduction in rate of photosynthesis at these stations under cloudy weather, while in groundwater of all the Sampling sites, it could be due to utilization of DO for decomposition of heavy monsoonal organic lood.
8) The increase in BOD during summer season at all stations is mainly due to :
a) Concentration of organic matter due to evaporation of the medium.
b) Increase in rate of decomposition at high water temperature.
Conversely, levels of BOD decreased during monsoon season due to:
Dilution of the organic load by rainfall
Decrease in rate of decomposition of the organic matter at low water temperature. The lowest level of BOD during Summer Season at all the Sampling sites may be due to low organic load before.
9) COD was declined during monsoon while increased in summer season at all Sampling Sites due to variations in chemically oxidizable pollutants at these stations. These seasonal variation are well pronounced at all surface water of kukrail nala , where the nala received industrial waste waters from small and large scale industries which could be oxidized only under the influence of oxidizing agents. During summer, industrial wastes get concentrated in kukrail at all the sampling site which may result in higher COD of the nala.
[1] Khan, Ramsha, Abhishek Saxena, and Saurabh Shukla. "Assessment of the impact of COVID‐19 lockdown on the heavy metal pollution in the River Gomti, Lucknow city, Uttar Pradesh, India.” Environmental Quality Management (2021).
[2] Khan, Ramsha, et al. "Environmental contamination by heavy metals and associated human health risk assessment: a case study of surface water in Gomti River Basin, India” Environmental Science and Pollution Research 28.40 (2021): 56105 56116.
[3] Khan, Ramsha, et al. "Effect of COVID 19 lockdown on the water quality index of River Gomti, India, with potential hazard of faecal oral transmission.” Environmental Science and Pollution Research 28.25 (2021): 33021 33029.
[4] Khan, Ramsha, et al. "Health risk assessment associated with arsenic contamination in Gomti River Basin: Impacts of pre and post COVID 19 lockdown." (2021)
[5] Goel, Pooja, et al. "Impact of rapid urbanization on water quality index in groundwater fed Gomati River, Lucknow, India." Current Science (00113891) 114.3 (2018).
[6] Abeysingha, N. S., et al. "Climate change impacts on irrigated rice and wheat production in Gomti River basin of India: a case study." SpringerPlus 5.1 (2016): 1 20.
[7] Dutta, Venkatesh, Ravindra Kumar, and Urvashi Sharma. "Assessment of human induced impacts on hydrological regime of Gomti river basin, India." Management of Environmental Quality: An International Journal (2015).
[8] Verma, Anjali, Amit Kumar Rawat, and Nandkishor More. "Extent of nitrate and nitrite pollution in ground water of rural areas of Lucknow, UP, India." Current World Environment 9.1 (2014): 114.
[9] Dutta, Venkatesh, et al. "Restoration plan of Gomti River with designated best use classification of surface water quality based on river expedition, monitoring and quality assessment." Earth Science India 4 (2011).
[10] Shivani, Srivastava, et al. "Evaluation of effect of drains on water quality of river Gomti in Lucknow city using multivariate statistical techniques." International Journal of Environmental Sciences 2.1 (2011): 1.