10 XII December 2022 https://doi.org/10.22214/ijraset.2022.47831
1
ISSN: 2321-9653; IC Value: 45.98; SJ Impact Factor: 7.538 Volume 10 Issue XII Dec 2022- Available at www.ijraset.com


1
ISSN: 2321-9653; IC Value: 45.98; SJ Impact Factor: 7.538 Volume 10 Issue XII Dec 2022- Available at www.ijraset.com
Abstract: Replacement of natural aggregates with moderately cement treated soil in sub-base and base layers is identified to be prevailing construction practice in low volume roads. However, robustunderstanding of strength and durability characteristics of these soil-cement moderately treatedlayers is considered to be significant prerequisite. Numerous studies were carried out on conventional strength properties of soil-cement treatment in subgrade and granular layers. Limited studies were reported on understanding the durable performance of these mix material under the influence of vehicular transient loadings, and environmental loadings. Therefore, thisstudy made an attempt in understanding durability aspects of moderately treated soil-cement subbase and base layers by analysing and thereby modelling the experimental data. In this study, three distinct types of soils samples were selected such as SC (A-2-6), CL (A-4),and CI (A-6) from Low Volume Road (LVR) construction site of Rajnandgaon and Narayanpur districts of Chhattisgarh state. Detailed laboratory experimental investigations were carried outon virgin soil and moderately cement treated soil at different proportions (from 3% to 12%) ofPortland Pozzolana Cement (PPC). Conventional test properties on virgin soil such as Atterberg’s limits (Liquid Limit, Plastic Limit, Shrinkage Limit and Plasticity Index), volumetric properties (Maximum dry density and Optimum moisture content), Chemicalproperties (Organic, Sulphate carbonate content) and strength properties (California bearing ratio and unconfined compressive strength). Similarly, Conventional tests were performed for their strength and durability characteristics on natural soil and stabilized soil with Portland Pozzolana cement in varying amount of 0, 3, 6, 9 and 12 % by dry weight of soil. Tests on soiland cement were conducted prior to stabilization including Soil Gradation, Atterbergs Limit, Shrinkage Limit, Swell Potential, Specific Gravity, Free Swell, Organic content, Sulphate Content, Carbonate Content, CBR (California Bearing Ratio) and 7 day UCS (Unconfined Compression Test) and wet-dry durability, Residual soaked UCS and Residual capillary test were conducted on stabilized specimen, all the tests were conducted on OMC of particular soil.
Statistical models with R2 value ranging between 0.84 and 0.94 were developed between various parameters of soils and mass loss % after 12 wet-dry cycles. Also the analysis of the recommended7 day UCS value and mass loss corresponding to particular cement content for each soil was done.The validation of developed model was done with prediction chart provided by previous researchersand using available lab test data of various soils from different sites.
Keywords: LVR, Soil Stabilisation, Durability, Wet-Dry Test, Residual Strength
The sustainable development of infrastructure can be accredited to conservation of naturalresources which are limited in occurrence and simultaneouslyencouraging thereuse, recyclingand reprocessing of available material. Widelyaccepted method to deal with this problem is tostrengthen the weak constituents of pavement like soil and/or aggregates by using stabilizers sothey can be effectually and satisfactorily used to replace the granular layer in pavement construction.
It is very common and eco-friendly practice which is presently used by many countries to save natural resources and reduce carbon footprint owing to pavement construction. The stabilizers significantly improve the properties of soil and thus, stabilized soil/ aggregate are significantly used for base underlying the asphalt or concrete pavement and there has beenimmense growth in its use during last half century.
Soil stabilization is defined as the process of modification of virgin or natural soil or aggregate with theintention ofimprovingsoils engineeringpropertiesandcharacteristics.

ISSN: 2321-9653; IC Value: 45.98; SJ Impact Factor: 7.538 Volume 10 Issue XII Dec 2022- Available at www.ijraset.com
Someother advantages of stabilization include use of borderline base material which saves the cost and time for transportation of expensive good quality fill material. The popularity of stabilization has increased lately because almost all types of soils can be stabilized.
Although, there are some exceptions include organic soils, highly plastic clays, and poorly reacting sandysoils. Generally soils having size IS 75 micron sieve passing between 5% and 35% produce themost economical stabilized soil. Need of Stabilization can possiblybejustified bymanyfactorslike high transportation cost and lack of good qualityaggregates.
The subgrade found generally in most places is very soft and thus stabilization allow useof marginal aggregates which are nearby and certainly available in abundance.
IRC 37-2012 allows the engineers to use his sound engineering judgement consistent with the local environment using semi mechanistic approach for design of pavements. As stabilization can easilyimprove high water table, sites with drainage problem can also be used. Soil stabilizationincrease durability and strength of soil which is retained even under saturated condition which result as reduced surface deflections and increased erosion resistance, also the stabilized material does not offer any problem of contamination from the underlying layer.
Many researchers have reported that construction of granular layers above stabilized layer increase its Elastic Moduli. The use of cement treated base (CTB) as a replacement of granular-base pavement reduces the cost of construction. The utilization of in-place or neighbouring borrow materials helps in preservation of energy, time and cost as the need for hauling of costly, granular-base is eliminated.
Following advantages of cementitious treatment of granular layers are summarized based on the literature review.
1) Use of cement treated bases result in better Load Distribution: Due to higher stiffness of cement treated bases, it will distribute loads over a larger area thus stresseson the subgrade is reduced compared to the granular bases.
2) Deflection: The higher stiffness of cement-treated bases lead to lower pavementdeflections and lower asphalt strains which results in longer fatigue life for the asphalt surface.
3) Rutting in Base: With increased strength cement-treated base prevents the occurrenceof rutting in deep depth of pavement where repairing is extremelydifficult.
4) Moisture Problems: Treatment of base with cement reduces permeability and thus helps prevent the percolation of water to underlying water susceptible layers. Due to reduced permeability the water could not enter base and so even under frost conditionsthe problem of ice lenses is not encountered in base layer. To complete the pavement structure top course of bitumen or Portland cement concrete is placed on the CTB.
Use of CTB as a pavement base material is done extensively for highways, roads, airports, parking areas, materials handling and storage areas. Old roads with granular-base can also be recycled to form excellent cementitious base either including or excluding their asphaltsurfaces. The use of stabilized bases may be advantageous in lightly trafficked roads, moderately to heavily-trafficked roads on low strength subgrade, and in improving the ability to carryload especiallyin areas that are subjected to frequent flooding thusreducingdesign lifecost byrecycling of inadequate existing pavements.
In this research, full laboratory experimentation was conducted on three different soil samplesin untreated state and treated state at five different concentrations of cement stabilizer with twospecimens for each concentration. The tests conducted on soil are grain size analysis, microscopic evaluation for organic content, sulphate content and carbon content, liquid limit, plastic limit, plasticity index, shrinkage limit, specific gravity, free swell, swell potential, plasticity product and California bearing ratio tests were conducted for evaluation of initial properties of natural soil, then 7 day unconfined compressive strength test, wetting-drying durability test, residual UCS test and residual capillary rise test were conducted on untreated and treated soil samples.
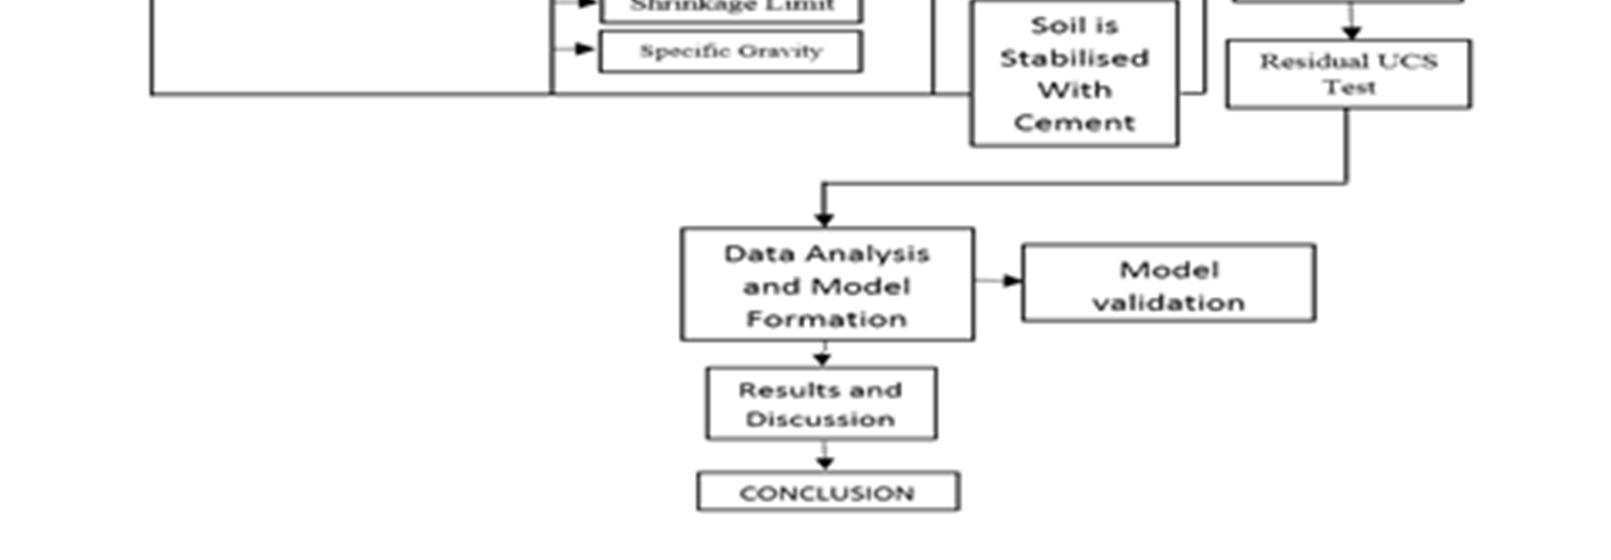
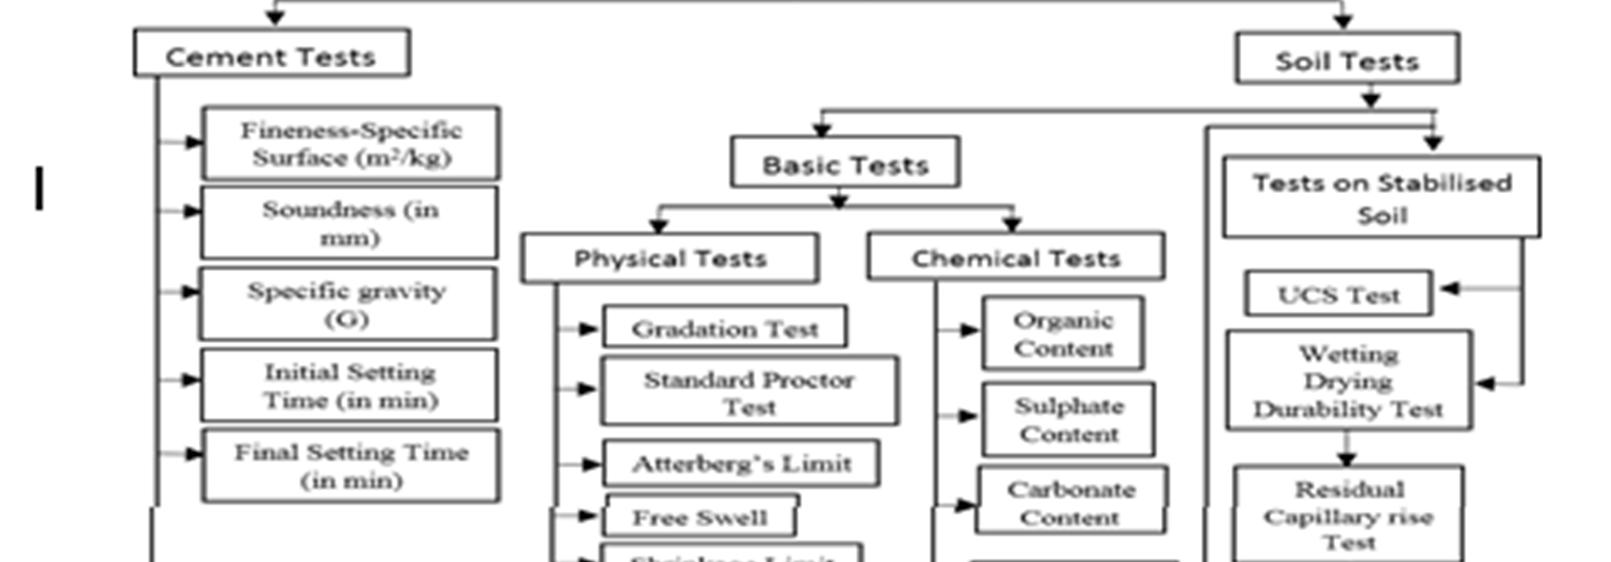
This chapter presents the methods, and procedure followed for preparation of specimen, performing the tests and analysis of data. The detailed study methodologyadopted is elaborated in flow chart as shown in Figure 3.1.
ISSN: 2321-9653; IC Value: 45.98; SJ Impact Factor: 7.538 Volume 10 Issue XII Dec 2022- Available at www.ijraset.com

The detailed summary of test results obtained from volumetric, strength and performancerelated tests conducted as discussed in the preceding sections is shown in Table 4.1.
Table 4.1. Summary of test results
Natureof Soil Test Property of Soil Soil Type Test Standard S-1 S-2 S-3
IS 2720 (Part-III) 1995 (reaffirmed 2006)
Optimum MoistureContent(Wom) (%) 10.2 11.8 12
Maximum Dry Density (γd)(kN/m3 ) 20.2 18.3 17.5
Parent Soil Specific Gravity 2.89 2.66 2.62
California Bearing Ratio (CBR) (Soaked) 6.10% 6.30% 3.50%
IS 2720 (Part-VIII) 1995 (reaffirmed 2006)
IS 2720 (Part-16) 1995 (reaffirmed 2006)
Thus based on the test results obtained detailed analysis and modelling of test results havebeen carried out as discussed in the subsequent sections.
ISSN: 2321-9653; IC Value: 45.98; SJ Impact Factor: 7.538 Volume 10 Issue XII Dec 2022- Available at www.ijraset.com
Nature of Soil Test Property of Soil
Unconfined Compressive strength (UCS), MPa
Unconfined Compressive strength (UCS), MPa
Soil Type Test Standard
S-1 S-2 S-3
0.66 0.12 0.89
3% 1.11 0.91 1.4 6% 1.71 2.07 1.87 9% 2.14 3.4 2.24 12% 2.62 5.15 2.82
IS 2720 (Part-10) 1995 (reaffirmed 2006)
SoilCement mix
Residual Unconfined Compressive strength (UCS) of treated soil (MPa)
Wet-Dry durabilitytest Mass Loss % basedon
6% - 0.17 0.7 9% 0.84 0.605 1.51 12% 0.99 1.625 2.33
0% 100 100 100
3% 100 100 61.31 6% 76.54 20.81 27.12 9% 23.55 12.39 13.13 12% 19.56 10.75 13.01
PCA Handbook& IRC:SP-89 Part-I (2010) & Part-II (2018)
Theunconfinedcompression testwasperformedon 7daymoistcuredspecimen andtheamountofcementrequiredfor stabilisation is calculated based the value of UCS. The code recommendsthat for stabilised soil to be used as sub-grade the minimum 7 day UCS should be 1.7 Mpa andfor base course3.0 Mpa. Theamount of cement providing thesesuggested values arecalculatedbased on the graph plotted between the cement content and 7 Day UCS for soil. Different cement content was found for all soils based on the graphs prepared which have been presentedin tabular form in Table 5.1 and the graphs obtained between 7 day UCS and cement content for all soils has been presented in Figure 5.1 (a) , (b) and (c).
5.1 (a) Cement content vs 7 dayUCS for Soil 1.

ISSN: 2321-9653; IC Value: 45.98; SJ Impact Factor: 7.538
Volume 10 Issue XII Dec 2022- Available at www.ijraset.com
5.1 (b) Cement content vs 7 day UCS for Soil
5.1 (c) Cement content vs 7 dayUCS for Soil 3
Figure 5.1 Cement content versus 7 day UCS for (a) Soil 1(b) Soil 2(c) Soil 3
It is clear from the graph that cement content and 7 dayUCS have a linear relationship with R2value between 0.96 and 0.99 for three soils tested. The amount of cement required forrecommended UCS strength is calculated from the graph and has been represented in tabular form. Based on the calculated amount of cement required it can be stated that soil 1 is the weakest soil requiring maximum amount of cement content for desired strength value followedby soil 3 and soil 2 turns out to be the strongest soil providing required strength with least cement content. It is clear from the graphs prepared that with increase in cement content the strength of soil sample increases regardless of the type of soil being used. The increase in strength however maydiffer according to different types of soil being used. In this research the3 soils wereused andall three soils presentedgood increase in strength with addition ofcement. Similar results were previouslyreported bymanyauthors.
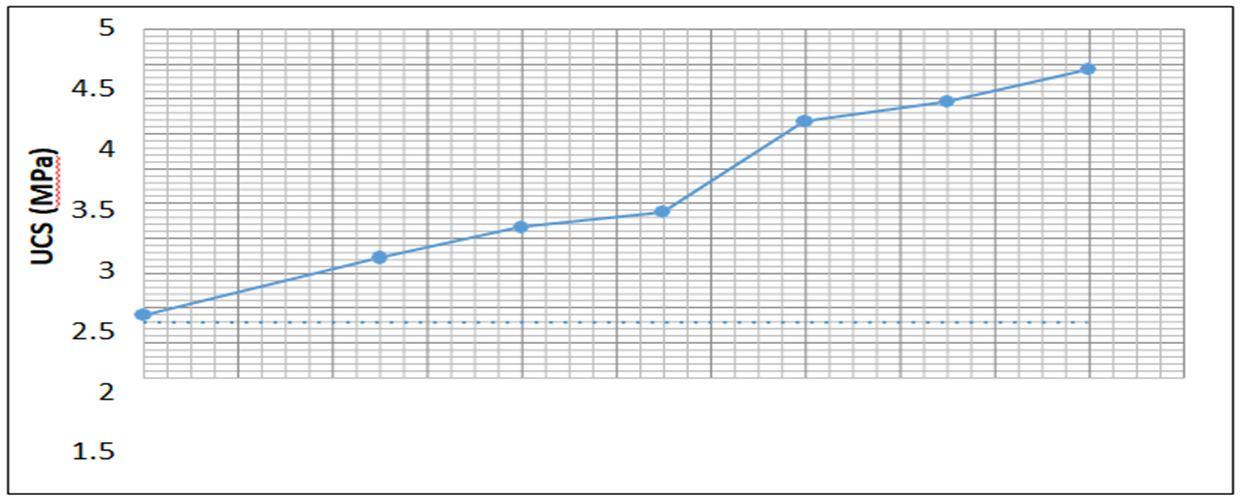
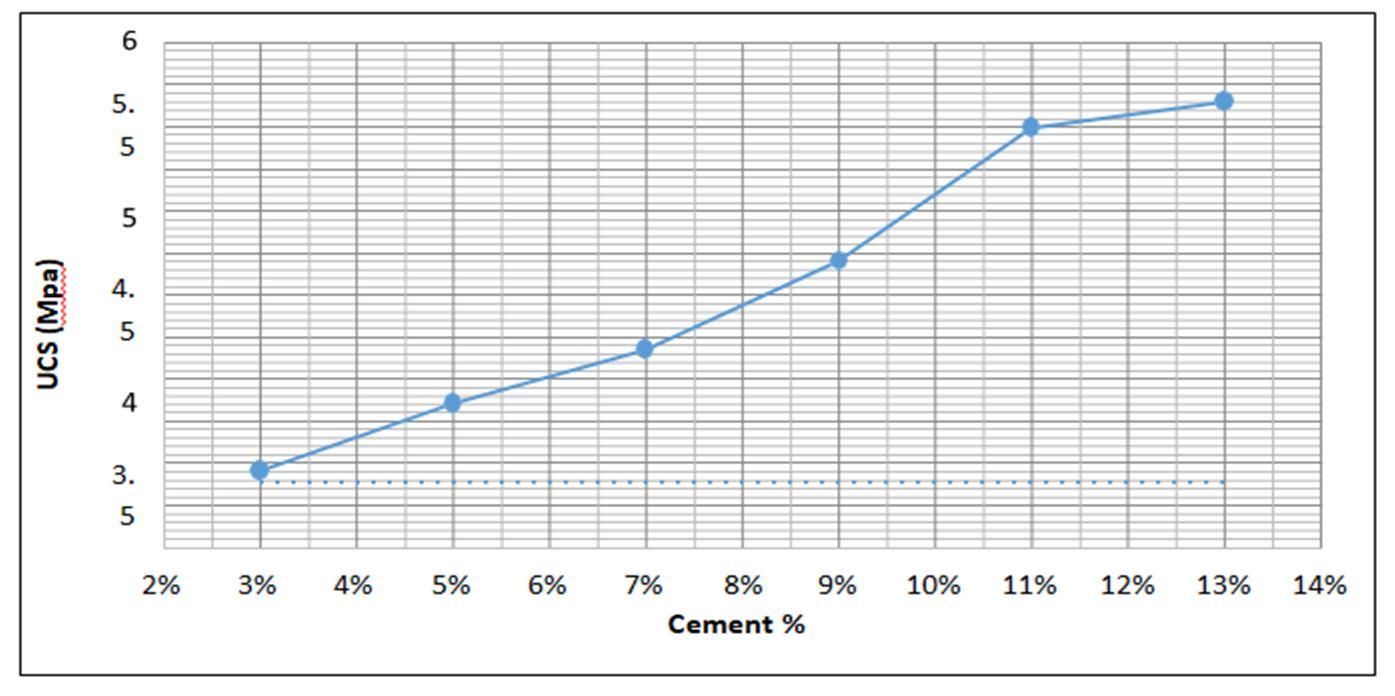
Table 5.1 Cement Percent calculated Based on 7 day UCS test
Soil OMC MDD UCS (Mpa) Cement % Sub-base Base Sub-base Base
Soil 1 10.2 20.2 1.76 3.03 6.4 14.8
Soil 2 12 18.3 1.73 3.04 5.2 8.6
Soil 3 12 17.5 1.73 3.06 5.2 12.6
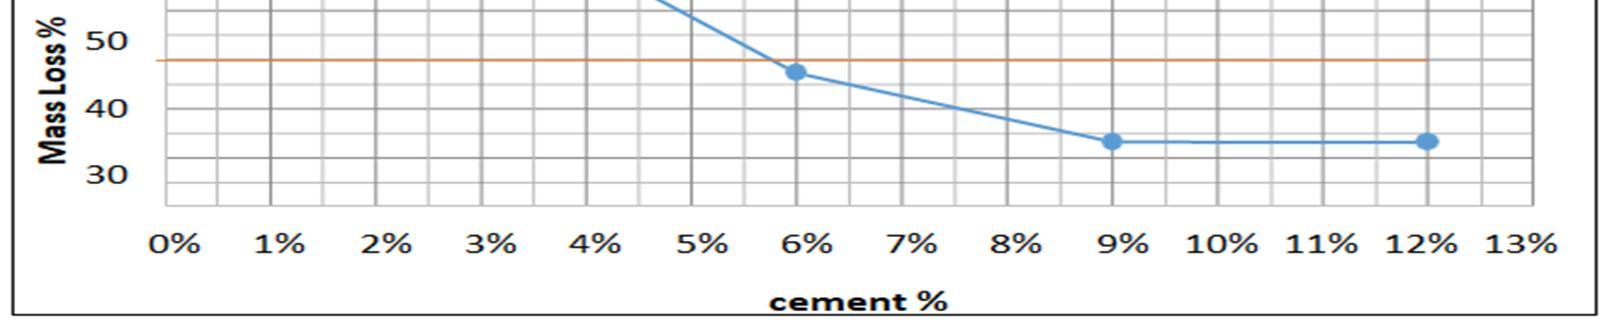
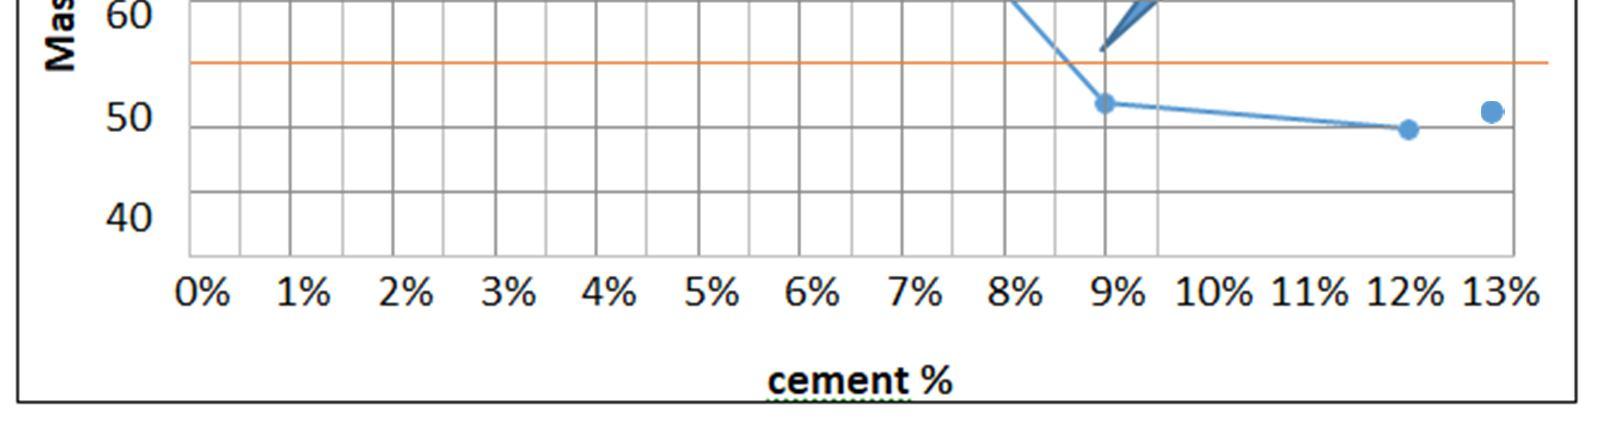
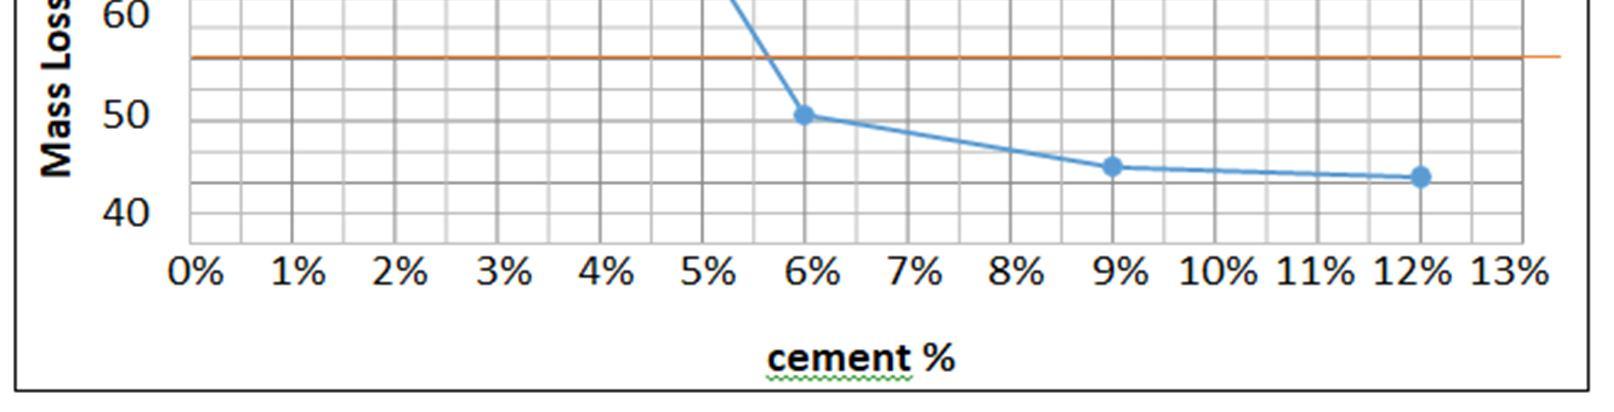
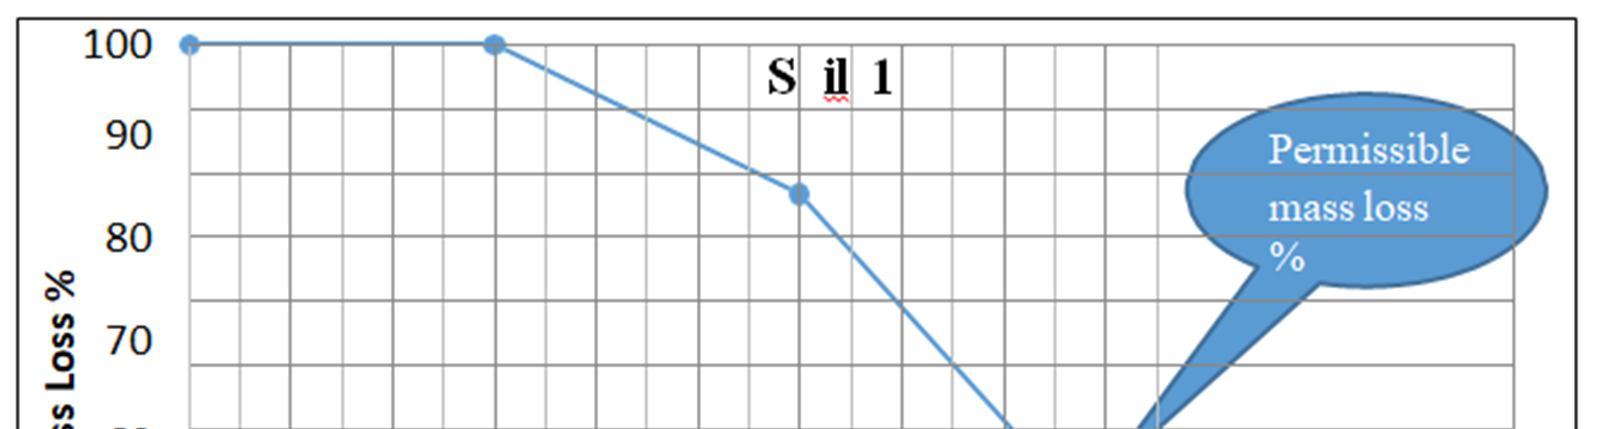
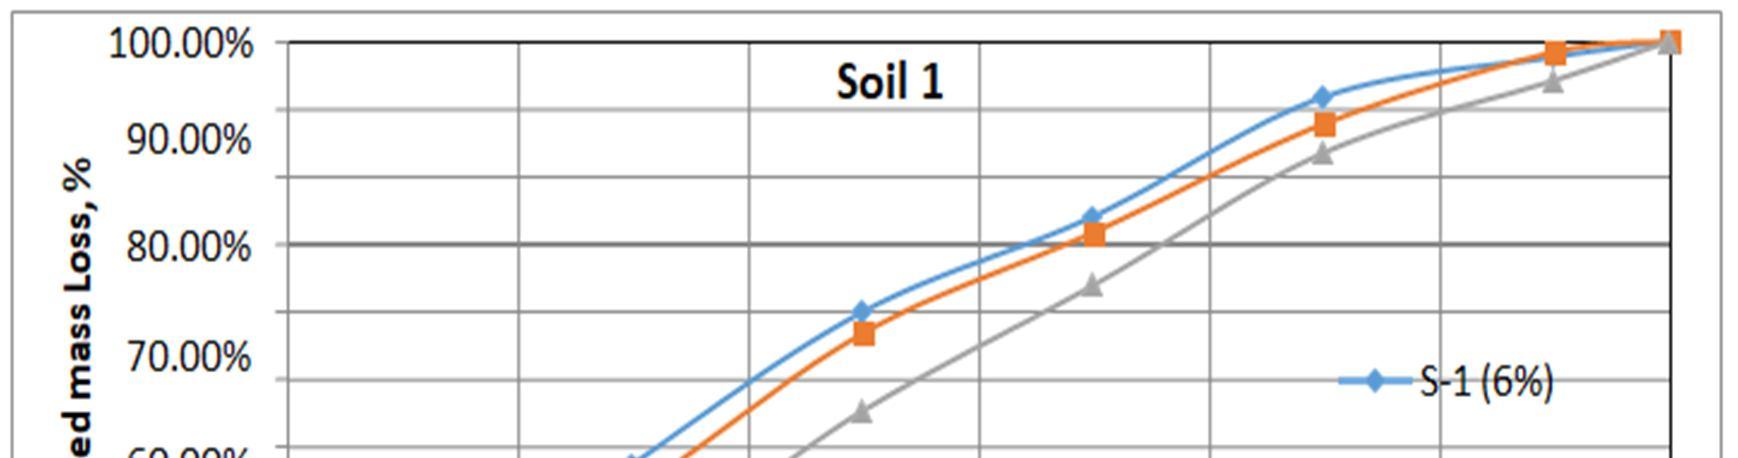
The wet- dry durability test was conducted on all soils. 2 specimens were prepared for each cement content with varying concentrations of 0, 3, 6, 9 and 12%, one sample was used forcalculation of mass loss percent and other sample was used for analyzing the change in shape and volume of specimens. The Wet-Dry test data differentiate for the different types of soil.Graphs representing the cement content versus mass loss pattern for all three soil has beenpresented in graphical form in Figure 5.2 (a), (b) & (c).
ISSN: 2321-9653; IC Value: 45.98; SJ Impact Factor: 7.538 Volume 10 Issue XII Dec 2022- Available at www.ijraset.com
(a) Cement vs Mass loss percent graph for Soil 1.
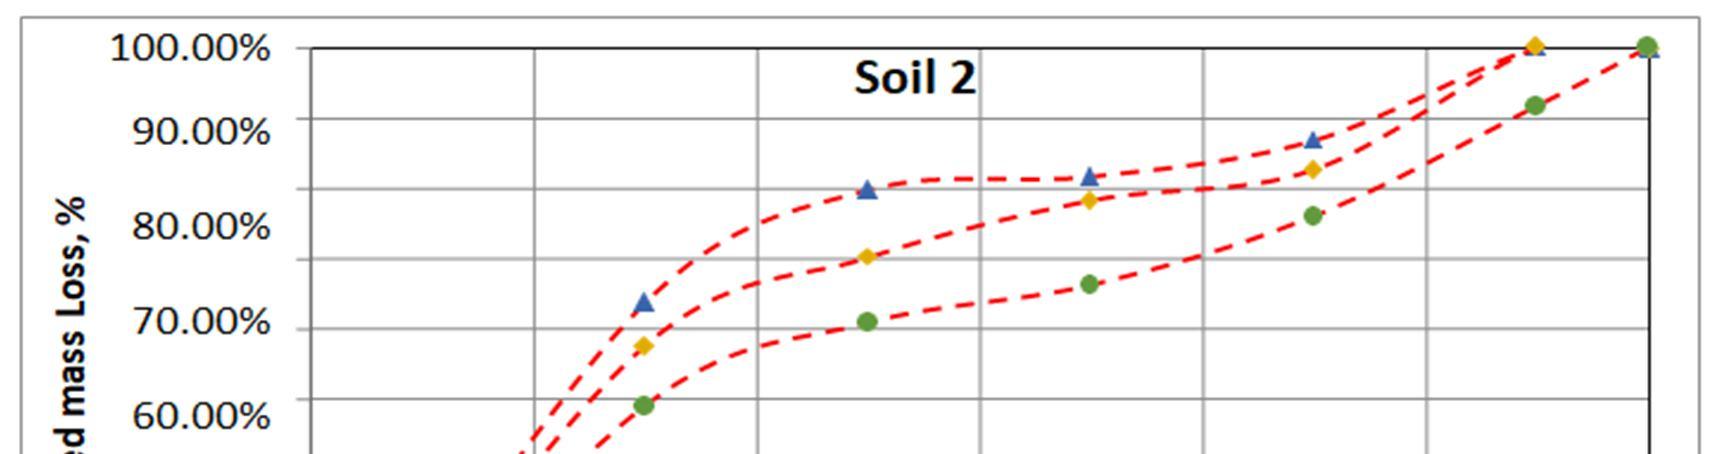
5.2 (b) Cement vs Mass loss percent graph for Soil 2.
(c) Cement vs Mass loss percent graph for Soil 3
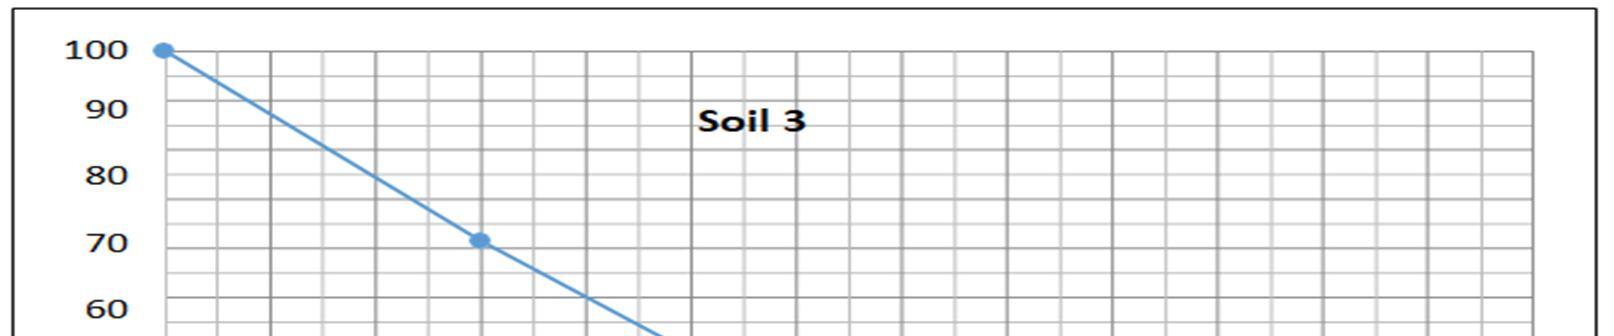

Figure 5.2 Cement vs Mass loss percent graph for (a) Soil 1 (b) Soil 2 (c) Soil 3
ISSN: 2321-9653; IC Value: 45.98; SJ Impact Factor: 7.538 Volume 10 Issue XII Dec 2022- Available at www.ijraset.com
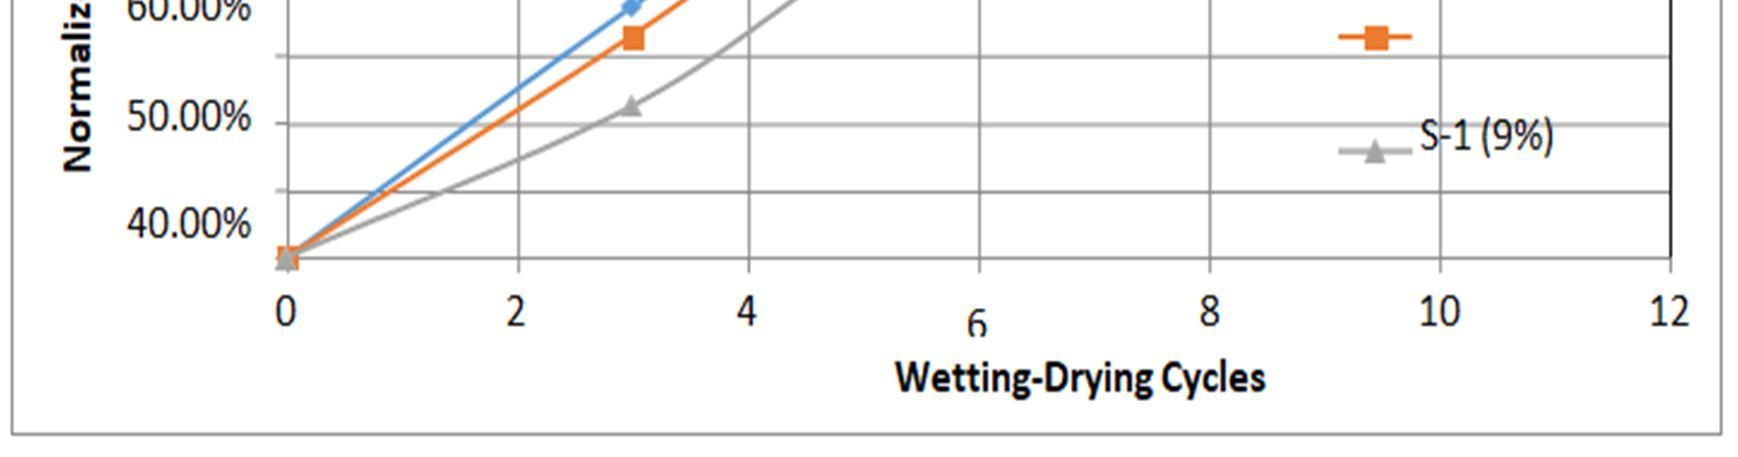
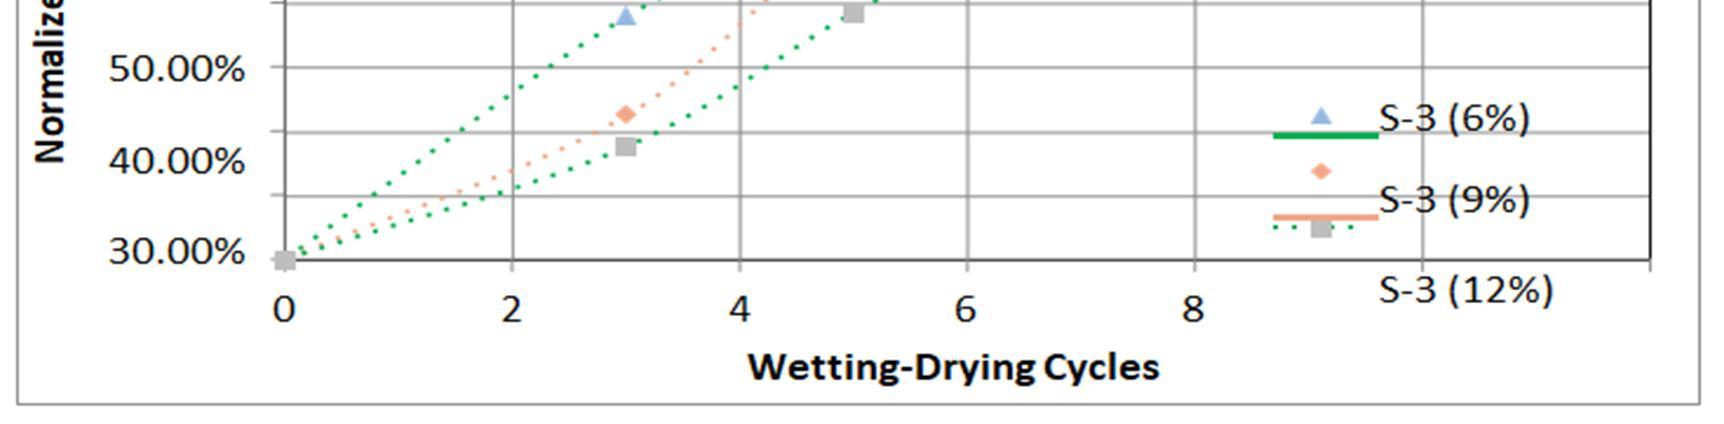
The mass loss percent calculated at the end of 12 wet-dry cycle was varied for all three soils tested which may be attributed to the difference in inherent properties of different soils. The redline represent the acceptable Mass Loss percent criteria as suggested by IRC for sub-base and shoulder. As it can be observed from graph 4.3 (a) the Soil 1 in its natural state i.e., at 0% and at low cement upto 3% addition was not able to sustain the 12 cycles of Wet-Dry test and fullmass of soil was lost however with addition of cement content beyond 3% the soil strength increases and the mass loss started to decline but the acceptable recommended range of mass loss as per IRC Guideline i.e., 30% for sub-base and shoulder could not be attained until the cement content was increased to around 9%. The cement content to be used for stabilisation calculated based on the 7 day UCS also suggests the cement content of 6.4 % which would be acceptable from durability as well as strength criteria. Similar results were observed for Soil 2where the natural soil and 3% cement stabilised sample both were not able to sustain the Wet-drycycles but the rate ofstrength gain for Soil 2 wasmuchbetterascomparedtoSoil1. Massivegain in strength was observed for Soil 2 as the cement content was increased from 3% to 6%. The Mass Loss % calculated for both soil at same cement content was very different. The loss % reported for soil 2 was observed to be much less than the loss % as reported for Soil 1 whichcould be attributed to the presence of more fine soil content in Soil 2 as compared to Soil 1. The acceptable Mass Loss criteria of 30% were met for Soil 2 at much less cement content of 6% which was also found by 7 day UCS which recommends the use of 8.6% cement. For Soil 3 the natural soil without stabilisation was not able to sustain the Wet-Dry cycles but with the addition of cement the 3% sample was also able to retain until the 12 cycle and full mass loss was not observed as for the other two samples tested. The Soil 3 had the maximum percentageof fines and thus was able to retain the mass at most even with small amount of cement addition.The cement content based on IRC recommendation was found to be around 6% for soil 3 but based on 7 day UCS strength the cement stabilizer percent was recommended 5.2 for sub-base fulfilling the 30% mass loss criteria of IRC SP 89-2018 (Part-II). To better understand the mass loss trend followed by different soil with different cement addition Figure 5.3 (a), (b) and (c) depicts the normalized mass loss curve for all three soils. Normalised mass loss can be described as the mass loss after each Wet-Dry with respect to mass loss after 12 cycles. Observed from Normalised Mass Loss curve for all soils that the pattern followed by mass loss with number of cycles differ for each soil. For all soil specimensstabilised with more cement content the curve lies below the curve formed by less cement content stabilised specimens i.e., the rate of mass loss is lower for high cement stabilised specimens than specimens stabilised with less cement content. For soil 2 and soil 3 the mass loss the specimens stabilised with 6% and 9% cement attained their highest mass loss in 11th cycle and no further mass loss was observed for 12th cycle while for soil 1 all the specimens with varying cement content continued to lose mass upto 12th cycle. It was also observed that the amount of mass loss was higher during initial cycles and with the increase in number of cycles the rate of mass loss per cycle deteriorated, this behaviour may be attributed to thereasonthat the specimens at the start of wet-dry test were only 7 day moist cured and thus the cementpresent in the specimens had not gained strength until later cycles. The cycles taken for preparation of graph were 3, 5, 7 & 9 cycle.
(a) Normalised Mass Loss curve for soil 1
ISSN: 2321-9653; IC Value: 45.98; SJ Impact Factor: 7.538 Volume 10 Issue XII Dec 2022- Available at www.ijraset.com
(b) Normalised Mass Loss curve for soil 2
(c) Normalised Mass Loss curve for soil 3

Figure 5.3 Normalised Mass Loss curve for (a) Soil 1(b) Soil 2 (c) soil 3
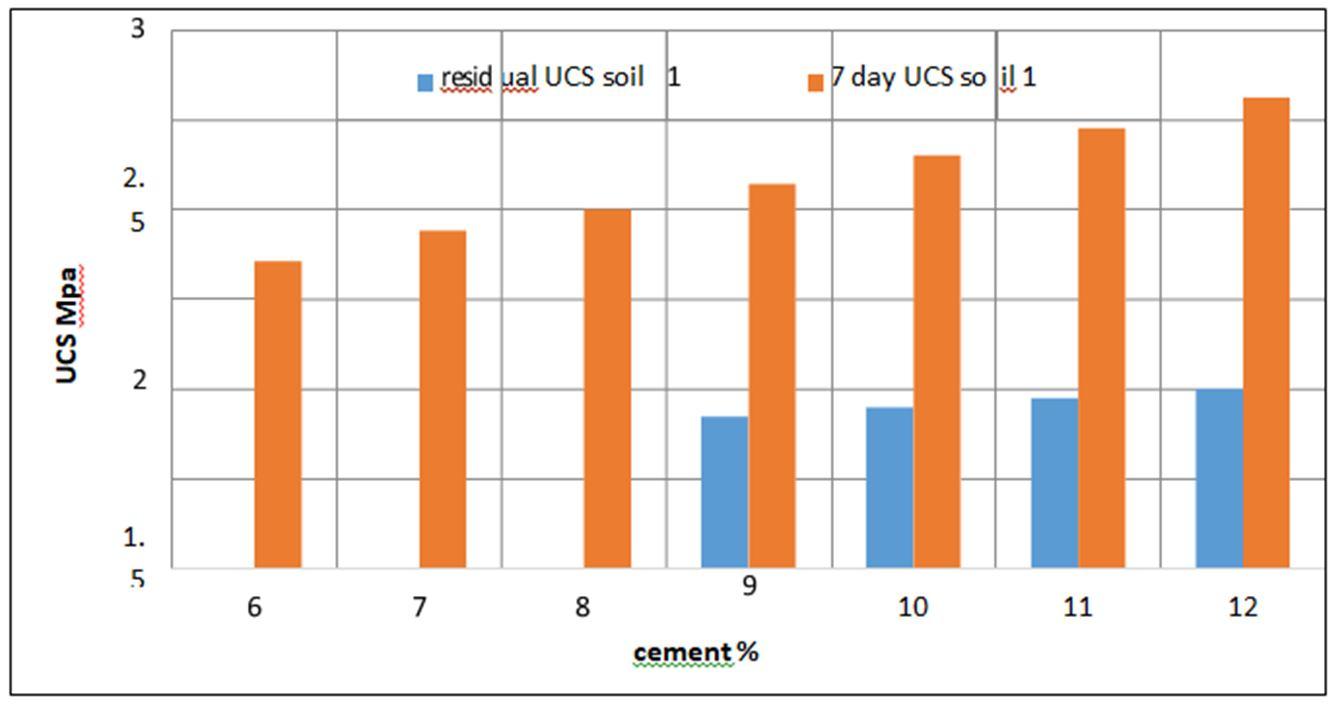
The specimens after 12 W-D cycle and capillary rise were tested for the effect of the w-d cycleon the residual strength of samples. The samples were oven-dried at a constant temperature of 55°c until constant weight. Then the specimens were submerged in water at room temperaturefor 4 hrs prior to testing for residual UCS. For 7 day cured specimen of soil 1 increase in UCSwas 22.5 % when cement content was increased by 3 % while for the same specimen after 12 w-d cycles, 4h soaked UCS increased about 17.85 %. For soil 2 the 7 days UCS increased 51.5 % while residual UCS increased 169 % for the same addition of 3% cement. For soil 3 the increase in 7 days UCS was 54% while it was 25% for residual UCS. Soil 2 had maximum increase in UCS for both 7 day and residual UCS followed by soil 3 while soil 1 had the least increase in UCS with the addition of cement for both the cases. It was reported that with an increase in cement content the percentage decrease in UCS due to w-d cycle also decreased. For soil 3 the decrease between 7 day UCS and residual soaked UCS was 32% for 9% cement and 17% for 12 % cement. For soil 2 thedecreasein UCS for 9% cement stabilized sample was82% while it was 68% for 12% cement stabilized sample. Soil 1 demonstrated an exception inthis case as for 9% cement stabilized specimen of soil 1 decrease in UCS after the w-d cycle was 60.74% while it escalated to 62% decrease for 12% cement stabilized sample. The Comparison of residual UCS and 7 dayUCS strength is shown in Table 5.2 and Figure 5.4 (a), (b) & (c).
ISSN: 2321-9653; IC Value: 45.98; SJ Impact Factor: 7.538 Volume 10 Issue XII Dec 2022- Available at www.ijraset.com
Table 5.2. Comparison of Residual and 7 day UCS strength
Soil type Cement (%) R-UCS, MPa 7 day UCS, MPa
% decrease in UCS value afterWD test
Soil 1 9% 0.84 2.14 60.74% 12% 0.99 2.62 62.21% 6% 0.17 2.07 -
Soil 2 9% 0.605 3.4 82.20% 12% 1.625 5.15 68.44% 6% 0.7 1.87 91.78%
Soil 3 9% 1.51 2.24 32.58% 12% 2.33 2.82 17.37% 6% 1.17 1.87 62.56%
(a) Comparison of residual and 7 dayUCS for Soil 1
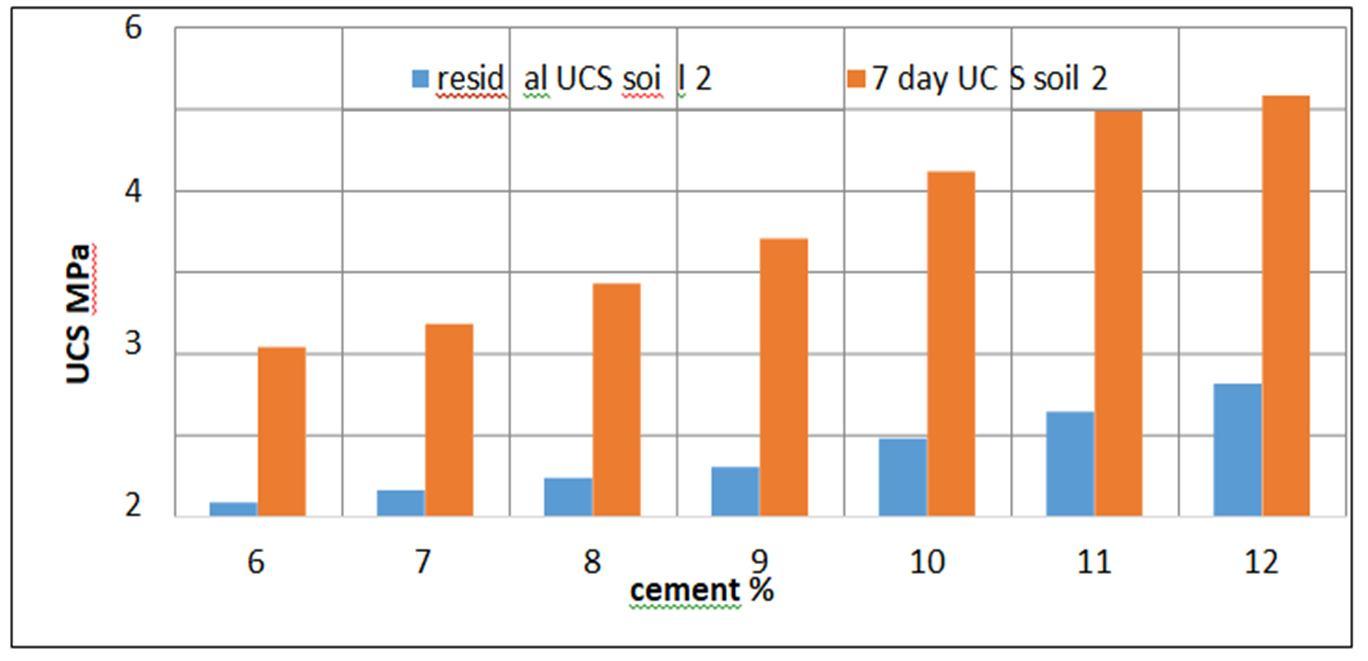
(b) Comparison of residual and 7 day UCS for Soil 2
ISSN: 2321-9653; IC Value: 45.98; SJ Impact Factor: 7.538
Volume 10 Issue XII Dec 2022- Available at www.ijraset.com
(c) Comparison of residual and 7 dayUCS for Soil 3
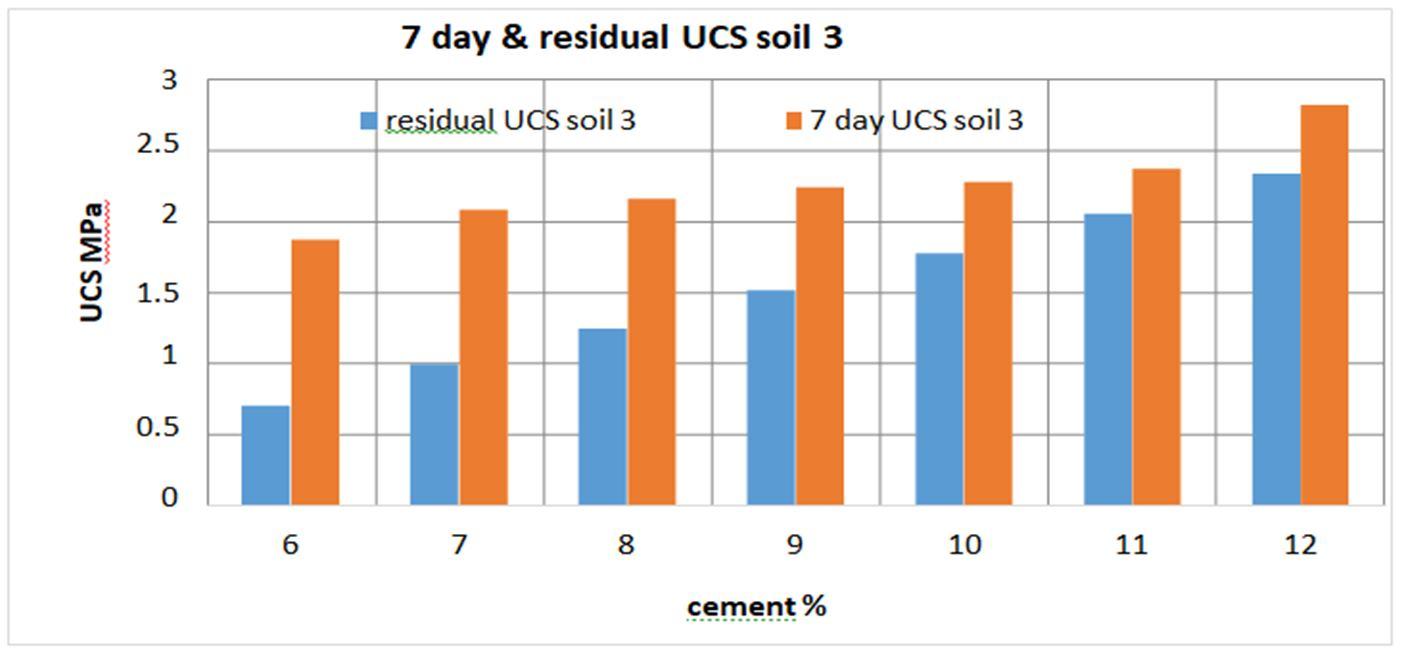
Figure 5.4 Comparison of residual and 7 day UCS for (a) Soil 1(b) Soil 2 (c) Soil 3
Thus based on the test result analysis, empirical models were developed to assess thecorrelations between % mass loss and UCS with its associated explanatory variables asdiscussed in the subsequent sections.
Models were formed based on various tests parameters obtained for better understanding and prediction of durability and strength characteristics of different types of soils based on their initialpropertiesandtheresult ofpreliminarytest. Linear, Logarithmic, Power andExponentialRegression Analysis was used and the R2 values obtained for various models was also stated along with the models formed. An overview on the previously formed equations by various An author obtained through literature review has also been presented in tabular form. The soils used by previous researchers differ from the soils used in this study and thus the difference in equations was obtained. Validation of results for same type of soil used was presented in formof comparison chart which gives verypromising results.
The equations developed by simple linear regression technique for prediction of durability andstrength characteristics of soils with various input factors with R2 value and thegraphs obtainedhas been presented. 1) day UCS versus Mass loss %
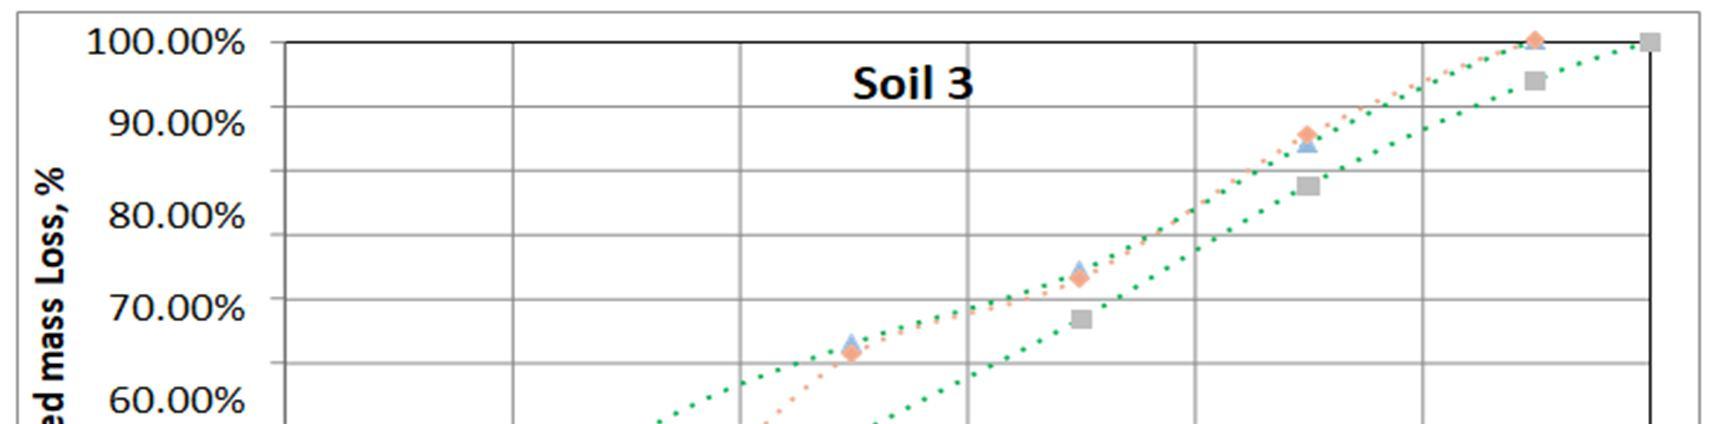
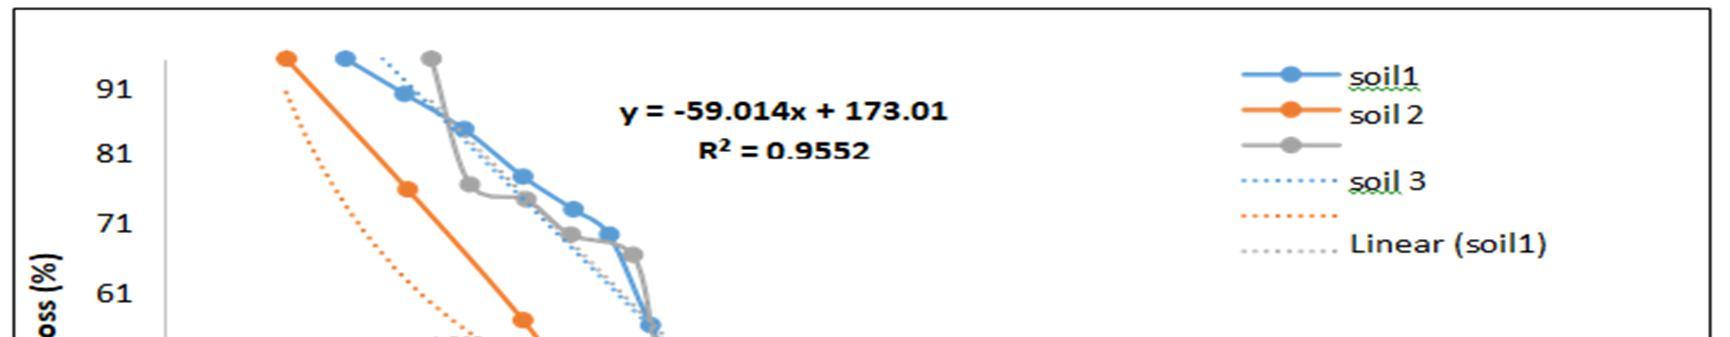
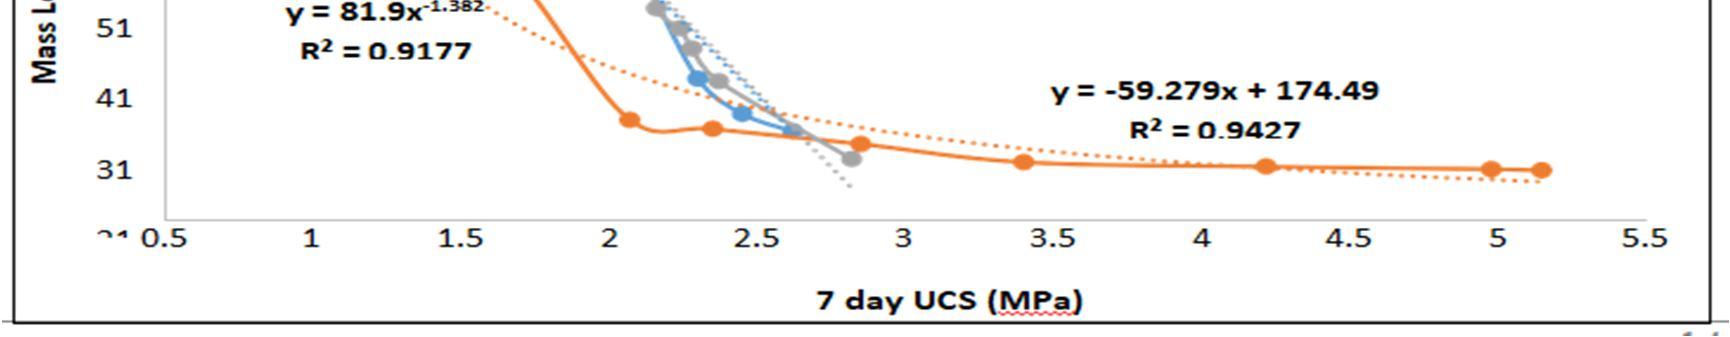
First relation was developed between the 7 day UCS value and Mass Loss %. For soils 1 &3 linearregression analysis was done and theequations obtained were y= -59.014x + 173.01 withR² = 0.9552 for soil 1 and y = -59.279x + 174.49 with R² = 0.9427 for soil 3 and for soil2 exponential relation was found to provide the best fit curve and thus the equation obtained for soil 2 was y = 81.9x-1.382 with R² = 0.9177. In all the three equations as shown in Figure 5.5 obtained the input value is the 7 day UCS strength of samples in MPa and the output is Mass Loss % after 12 cycles of wet-dry.
Figure 5.5 Equation Graph between 7 day UCS and Mass loss % for all soils
ISSN: 2321-9653; IC Value: 45.98; SJ Impact Factor: 7.538 Volume 10 Issue XII Dec 2022- Available at www.ijraset.com
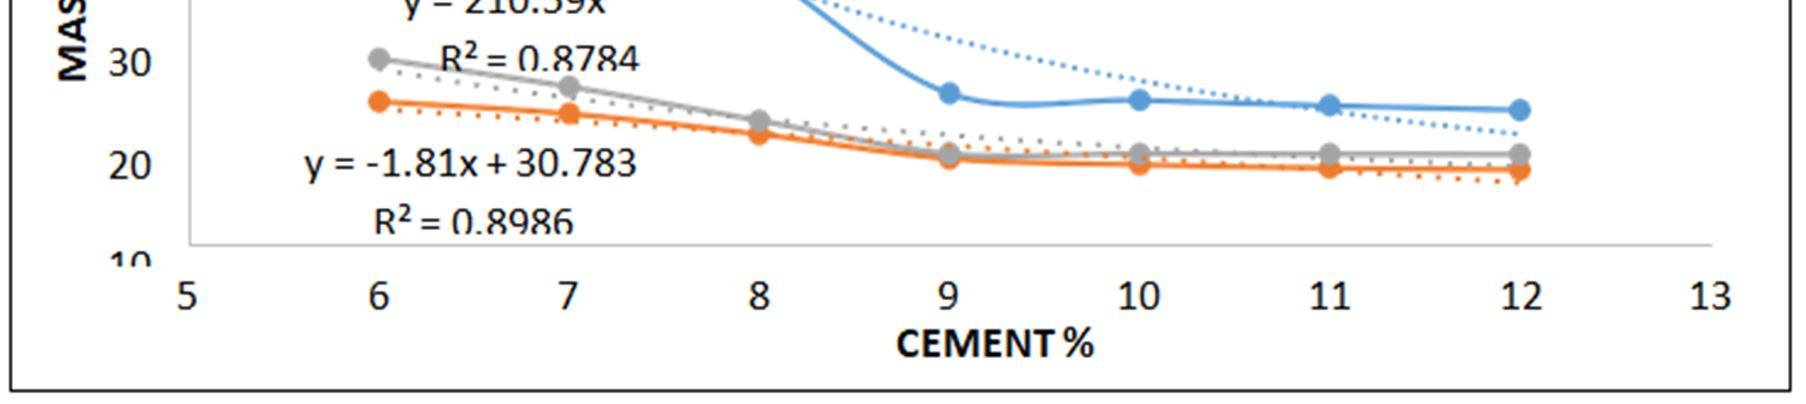
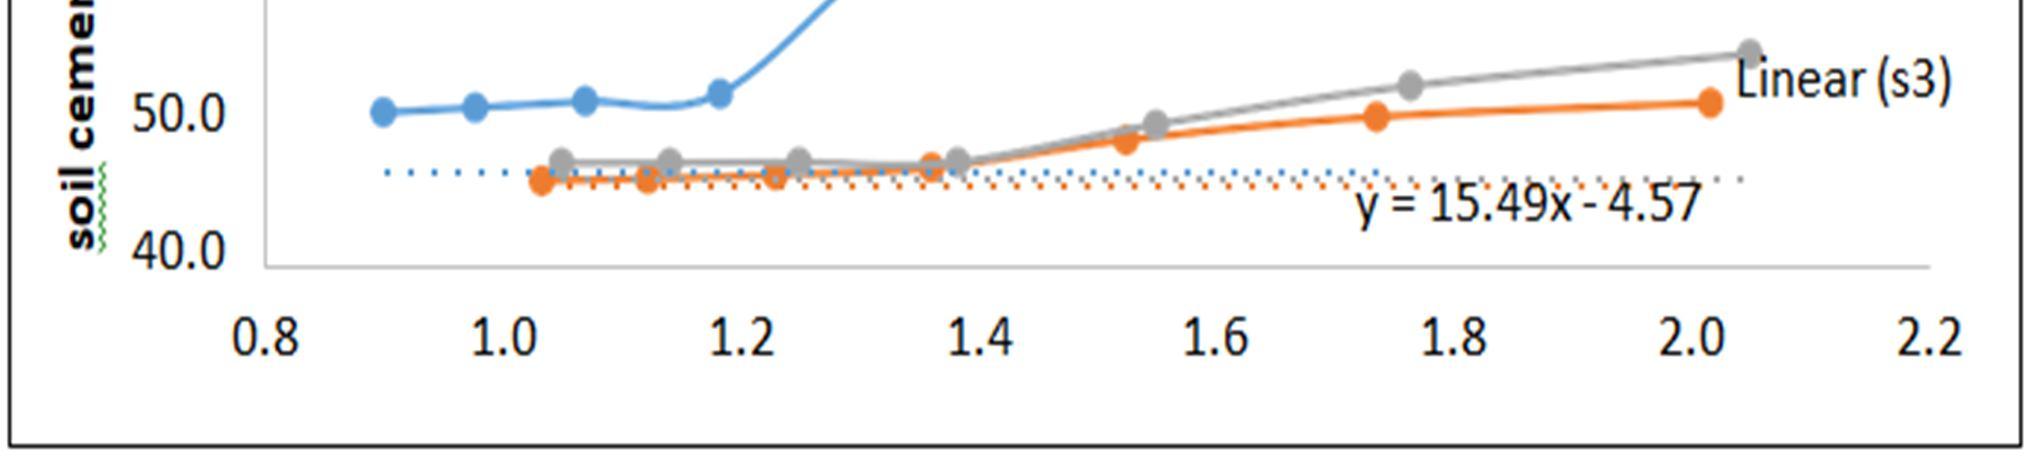
Second relation was developed between the cement content (%) used for stabilisation to the drymass of soil and Mass Loss %. For soils 1 &3 exponential relation was done and the equationsobtained were y= 3744.6x-2.195with R² =0.9109 for soil 1 and y= 210.59x1.174with R² =0.8784 for soil 3, for soil 2 linear regression analysis was found to provide the best fit curve and thus the equation obtained for soil 2 was y = -1.81x + 30.783 with R² = 0.8986. In all the three equations as shown in Figure 5.6 obtained the input value is cement content (%) ofsamples andthe output obtained is Mass Loss % after 12 cycles of wet-dry.
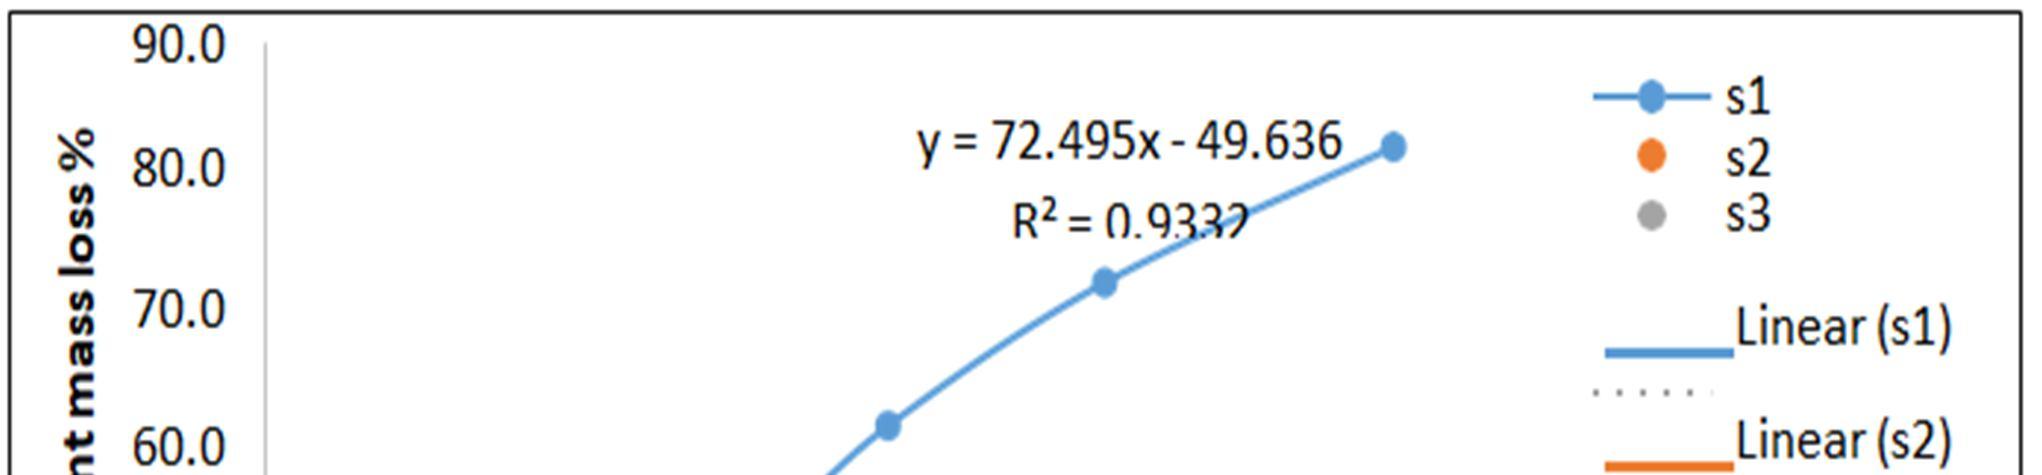
Figure 5.6 Equation Graph between cement content % and Mass loss % for all soils
Third relation was developed between the water-cement ratio used for stabilisation at the time of specimen preparation of soils and Mass Loss %. For all soils linear regression analysis was found to provide the best fit curve and thus the equations obtained were y = 72.495x - 49.636 with R² = 0.9332for soil 1, y= 11.476x - 1.3683 with R² = 0.9588 for soil 2 & y= 15.49x - 4.57with R² = 0.9182 for soil 3. In all the three equations as shown in Figure 5.7 obtained the inputvalue is water-cement ratio of samples at the time of specimen preparation and the output obtained is Mass Loss % after 12 cycles of wet-dry.
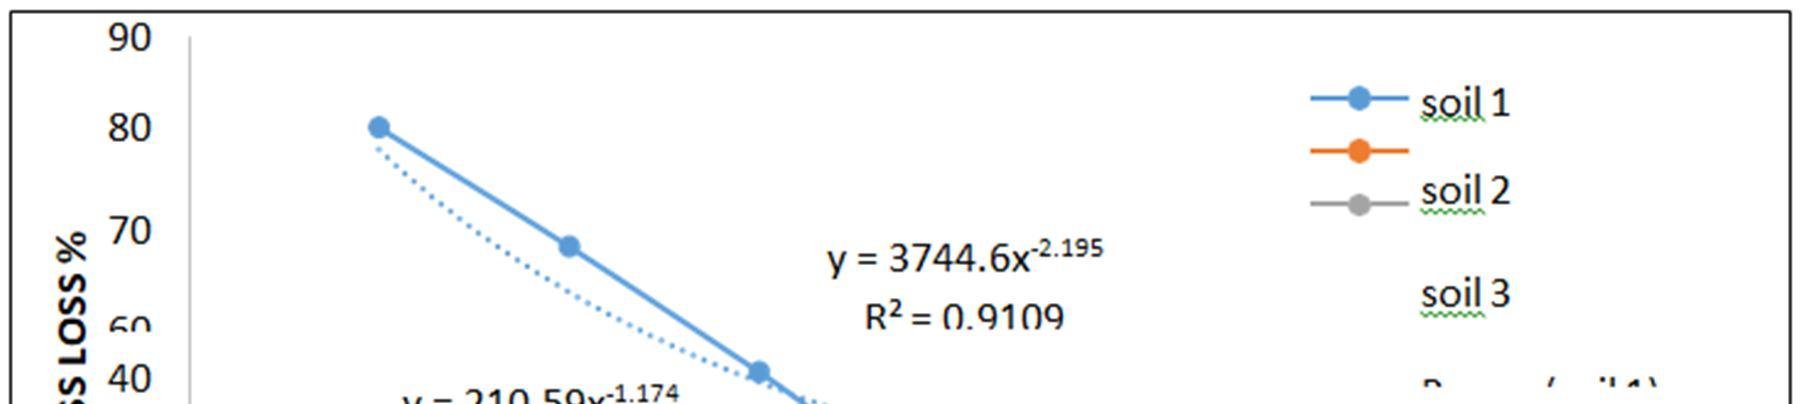
Figure 5.7 Equation Graph Between w-c ratio and mass Loss %
ISSN: 2321-9653; IC Value: 45.98; SJ Impact Factor: 7.538 Volume 10 Issue XII Dec 2022- Available at www.ijraset.com
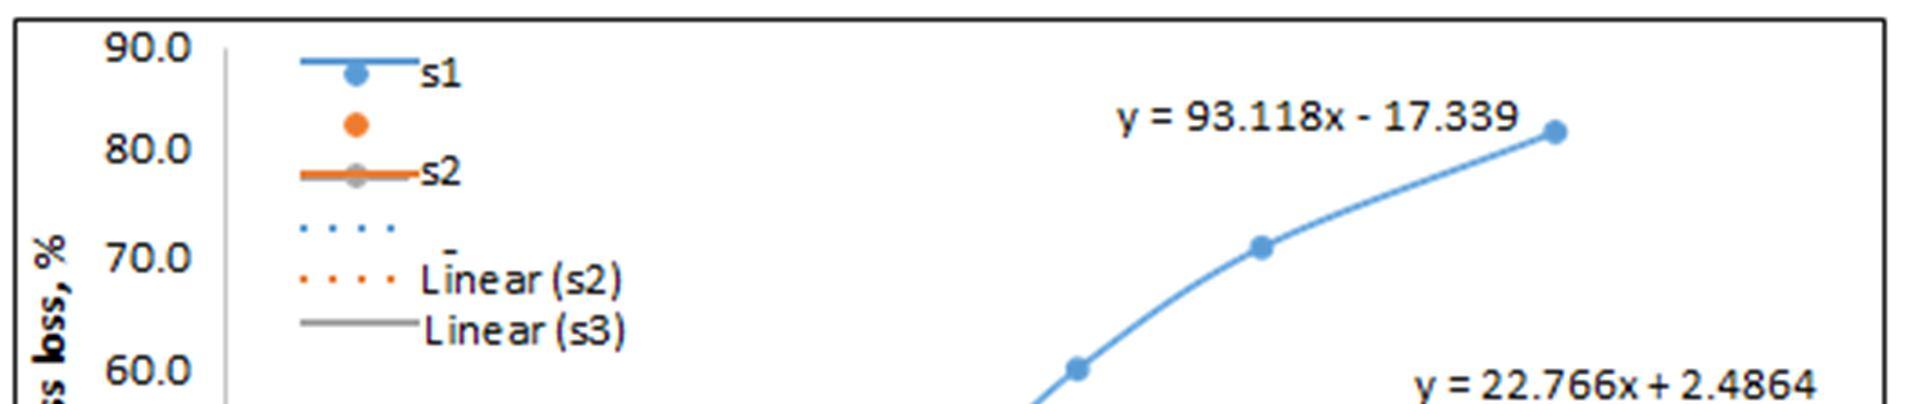
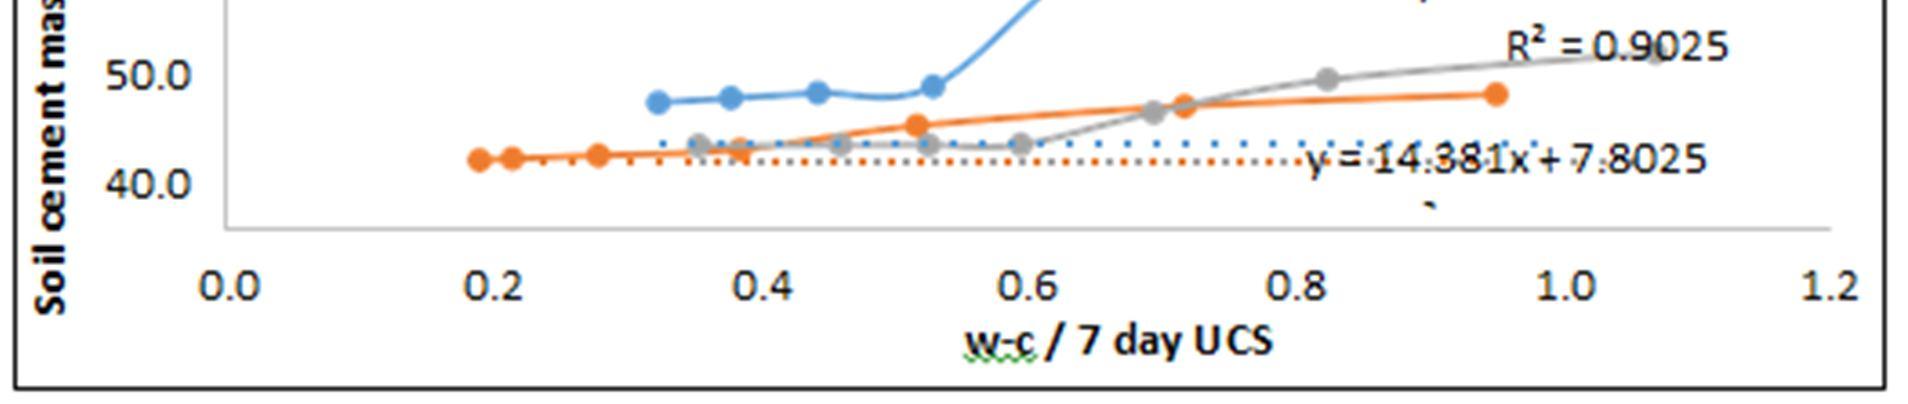
Fourth and last relation was developed between ratio of water cement ratio by 7 day UCS and Mass loss % for all soils. For all soils linear regression analysis was found to provide the best fit curve and thus the equations obtained were y = 93.118x - 17.339 with R² = 0.9425 for soil 1, y= 14.381x +7.8025 with R² = 0.9721 for soil 2 &y= 22.766x + 2.4864 with R² =0.9025forsoil 3. In all thethree equations as shown in Figure 5.8 obtained the input value is ratio of watercement ratio by 7 day UCSof samples and the output obtained is Mass Loss % after 12 cycles of wet-dry.
Figure 5.8 Equation Graph between ratio of (water cement ratio / 7 day UCS) and Massloss % for all soils
The developed empirical correlations based on the explanatory variables and its corresponding correlation coefficients are summarized in Table 5.3.
Table 5.3 Equations developed to predict Mass Loss % Independentvariable Dependentvariable Soil Type Developed Equation R2
7 dayUCS Mass loss %
S-1 y= -59.014x + 173.01 R² = 0.9552 S-2 y = 81.9x-1.382 R² = 0.9177 S-3 y= -59.279x + 174.49 R² = 0.9427
Cement content % Soil cement loss %
S-1 y = 3744.6x-2.195 R² = 0.9109 S-2 y= -1.81x + 30.783 R² = 0.8986 S-3 y = 210.59x-1.174 R² = 0.8784
water cement ratio soil cement loss % S-1 y = 72.495x - 49.636 R² = 0.9332
S-2 y = 11.476x - 1.3683 R² = 0.9588
S-3 y = 15.49x - 4.57 R² = 0.9182 S-1 y = 93.118x - 17.339 R² = 0.9425
w-c ratio / 7 dayUCS soil cement loss %
w-c ratio / 7 dayUCS soil cement loss %
S-2 y = 14.381x + 7.8025 R² = 0.9721 S-3 y = 22.766x + 2.4864 R² = 0.9025
ISSN: 2321-9653; IC Value: 45.98; SJ Impact Factor: 7.538 Volume 10 Issue XII Dec 2022- Available at www.ijraset.com
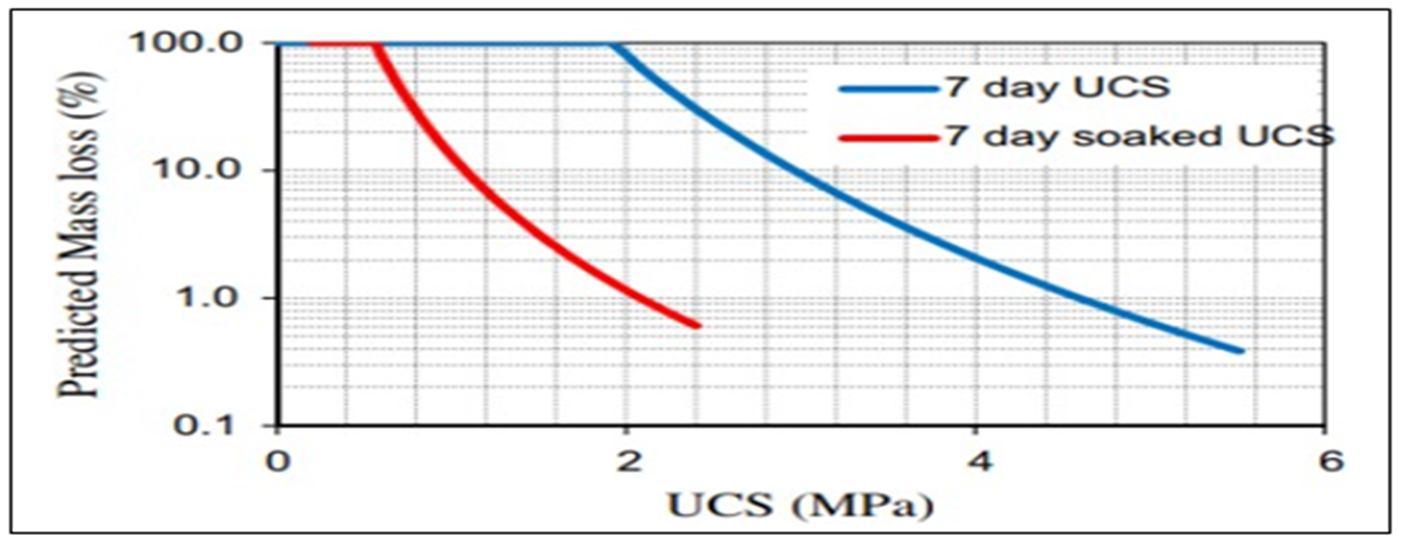
The developed empirical correlations are validated by comparing the mass loss % values predicted from the developed correlations and the mass loss % estimated from the chart suggested by Dipti Ranjan Biswal et.al, 2018 for same soil type i.e. soil 1 of this study which belongs to A-2-6 AASHTO classification. The percentage of variation among these values werecalculated and identified to be less than 10%. Therefore, thedeveloped models areidentified tobe robust in nature.
Figure 5.9 Prediction chart developed by Dipti Ranjan Biswal et.al, 2018 Ranjan
Thus based on the analysis of test results and developed empirical correlations the studyconclusions were drawn as discussed in the subsequent chapter.
SIn this research three soils with different properties and classification were tested for their strength and durability characteristics and final equations were developed regarding the interrelationship between those properties. The soils used were classified as A-26, A-4 & A-6as per AASHTO soil classification. The preliminary tests revealed that soils differ in their properties and thus proposed a good representation of soils used for stabilisation. Following conclusions are drawn:
1) The 7 day UCS test revealed that soil 1 is having minimum clay content possessed minimum strength and soil 2 having maximum clay content had maximum 7 day strength.
2) The wet-dry test also revealed that the durability of soil is largely dependent on the clay+ silt contentpresentin soil. Alsothe wet-drytest revealed that stabilisation withcement increases the durabilityof soil bygreat capacity.
3) Thus cement stabilised soil can be effectively used as sub-base and base material in pavement construction.
4) The developed empirical relations between various properties can facilitate the field engineers easily in predicting the performance in terms of durability of the cement stabilized soils without performing tedious wetting-drying test. Therefore, the developed correlations offer instant excellent engineering judgment and assist inthe quick decision-making process by predicting the durability of the cement stabilized soil duringthedesign phaseandmaintenancephaseas an alternativesolution for the existingdensitybased performance assessment of the cementitious treated pavement layer system.
In this research only three types of soils and only one stabiliser (cement) was used and all the samples were prepared at Optimum Moisture Content. Further research more types of soil withdifferent doses of various stabilisers at various moisture contents can be used and more effectivelyand wide range of experimentation can be carried out.
[1] Ahmed, A. and Issa, U.H., 2014. Stabilityof soft claysoil stabilised with recycled gypsumin a wet environment. Soils and Foundations, 54(3), pp.405-416.
[2] Bahar, R., Benazzoug, M. and Kenai, S., 2004. Performance of compacted cement-stabilised soil. Cement and concrete composites, 26(7), pp.811-820.
[3] Biswal, D.R., Sahoo, U.C. and Dash, S.R., 2018. Durability and shrinkage studies of cement stabilsed granular lateritic soils. International Journal of Pavement Engineering, pp.1-12.
[4] Bruno, A.W., Gallipoli, D., Perlot, C. and Mendes, J., 2017. Effect of stabilisation on mechanical properties, moisture buffering and water durability of hypercompacted earth. Construction and Building Materials, 149, pp.733-740.
[5] Caro, S., Agudelo, J.P., Caicedo, B., Orozco, L.F., Patiño, F. and Rodado, N., 2018. Advanced characterisation of cement-stabilised lateritic soils to be used as road materials.International Journal of Pavement Engineering, pp.1-10.
ISSN: 2321-9653; IC Value: 45.98; SJ Impact Factor: 7.538 Volume 10 Issue XII Dec 2022- Available at www.ijraset.com
[6] Consoli, N.C., Quiñónez, R.A., González, L.E. and López, R.A., 2016. Influence of moulding moisture content and porosity/cement index on stiffness, strength, and failure envelopes of artificially cemented fine-grained soils. Journal of Materials in Civil Engineering, 29(5), p.04016277.
[7] Donrak, J., Horpibulsuk, S., Arulrajah, A., Kou, H.L., Chinkulkijniwat, A. and Hoy, M., 2018. Wetting-drying cycles durability of cement stabilised marginal lateritic soil/melamine debris blends for pavement applications. Road Materials and Pavement Design, pp.1-19.
[8] Estabragh, A.R., Pereshkafti, M.R.S., Parsaei, B. and Javadi, A.A., 2013. Stabilisedexpansive soil behaviour during wetting and drying. International Journal of Pavement Engineering, 14(4), pp.418-427.
[9] Gerritsen, A. H. and Koole R. C., (1987) “Seven Years Experience with Structural Aspectsof the Shell Pavement Design Manual,” Proceedings of the Sixth International ConferenceonStructuralDesignofAsphalt Pavements, UniversityofMichigan,AnnArbor, Michigan,pp. 94-106.
[10] Hoy, M., Rachan, R., Horpibulsuk, S., Arulrajah, A. and Mirzababaei, M., 2017. Effectof wetting–drying cycles on compressive strength and microstructure of recycled asphalt pavement–Flyash geopolymer. Construction and Building Materials, 144, pp.624-634.
[11] Jin, L., Song, W., Shu, X. and Huang, B., 2018. Use of water reducer to enhance the mechanical and durability properties of cement-treated soil. Construction and Building Materials, 159, pp.690-694.
[12] Kamei, T., Ahmed, A. and Ugai, K., 2013. Durability of soft clay soil stabilized with recycled Bassanite and furnace cement mixtures. Soils and Foundations, 53(1), pp.155- 165.
[13] Kampala, A., Horpibulsuk, S., Prongmanee, N. and Chinkulkijniwat, A., 2013. Influence of wet-dry cycles on compressive strength of calcium carbide residue–fly ash stabilized clay. Journal of Materials in Civil Engineering, 26(4), pp.633-643.
[14] Kang, X., Kang, G.C., Chang, K.T. and Ge, L., 2014. Chemically stabilized soft clays for road-base construction. Journal of Materials in Civil Engineering, 27(7), p.04014199.
[15] Khoury, N. and Zaman, M.M., 2007. Durability of stabilized base courses subjected towet–dry cycles. International Journal of Pavement Engineering, 8(4), pp.265-276.
[16] Mengue, E., Mroueh, H., Lancelot, L. and Eko, R.M., 2017. Mechanical improvement of a fine-grained lateritic soil treated with cement for use in road construction. Journal of Materials in Civil Engineering, 29(11), p.04017206.
[17] Nusit, K., Jitsangiam, P., Kodikara, J., Bui, H.H. and Leung, G.L.M., 2016. Advanced characteristics of cement-treated materials with respect to strength performance and damage evolution. Journal of Materials in Civil Engineering, 29(4), p.04016255.
[18] Rahmat, M.N. and Ismail, N., 2018. Effect of optimum compaction moisture content formulations on the strength and durability of sustainable stabilised materials. Applied ClayScience, 157, pp.257-266.
[19] Sahoo U. C. and Reddy K. S. (2011) “Performance Criterion for Thin Surfaced Low Volume Roads”, Transportation Research Record: Journal of Transportation Research Board No. 2203, Vol.1, TRB, Washington D.C., pp. 178-185.
[20] Shihata, S.A. and Baghdadi, Z.A., 2001. Long-term strength and durability of soil cement. Journal of materials in civil engineering, 13(3), pp.161-165.
[21] Shihata, S.A. and Baghdadi, Z.A., 2001. Long-term strength and durability of soil cement. Journal of materials in civil engineering, 13(3), pp.161-165.
[22] Singh, B. and Kalita, A., 2013. Influence of fly ash and cement on CBR behavior of lateritic soil and sand. International Journal of Geotechnical Engineering, 7(2), pp.173- 177.
[23] Walker, P.J., 1995. Strength, durability and shrinkage characteristics of cement stabilised soil blocks. Cement and concrete composites, 17(4), pp.301-310.
[24] Zhang, Z. and Tao, M., 2008. Durability of cement stabilized low plasticity soils. Journal of geotechnical and geoenvironmental engineering, 134(2), pp.203213.
[1] ASTM D 698 standard Proctor compaction effort in accordance with (Standard Test Methods for Laboratory Compaction Characteristics of Soil Using Standard Effort) Method A.
[2] ASTM D559 / D559M Standard Test Methods for Wetting and Drying Compacted Soil-Cement Mixtures
[3] Austroads (2004) , “Technical basis of Austroads pavement design guide,” AP-T-33, Sydney.
[4] IRC: SP-89, 2010. Guidelines for soil and granular material stabilization using cement, lime and flyash. New Delhi, India: Indian Road Congress.
[5] IRC: SP: 121-2018, “Guidelines For use of Iron, Steel and Copper Slag In Construction of Rural Roads”
[6] IRC: SP: 62-2014, “Guidelines for the Design and Construction of Cement Concrete Pavements for Low Volume Rural Roads”.
[7] IRC: SP: 72-2015, “Guidelines for the Design of Flexible Pavements for Low VolumeRural Roads”.
[8] IRC-89 (Part II) - 2018 Guidelines for the Design of Stabilized Pavements (Part-II).
[9] Portland Cement Association, 1956. Soil-cement laboratory handbook. Portland Cement Assoc.