
ISSN: 2321 9653; IC Value: 45.98; SJ Impact Factor: 7.538
Volume 10 Issue X Oct 2022 Available at www.ijraset.com


ISSN: 2321 9653; IC Value: 45.98; SJ Impact Factor: 7.538
Volume 10 Issue X Oct 2022 Available at www.ijraset.com
Bhagirathi Bai V1 , Hanume Gowda Chandrakanth2
1Department of Mechatronics Engineering, Acharya Institute of Technology, India

2Department of Electronics and Communication, Sambhram Institute of Technology, India
Abstract: Liquid level control is a mechanism that monitors, compares, and regulates the level of liquids within a process to a set value. Level measurement determines the position of the level relative to the top or bottom of the process fluid storage tank or silo. Level control and measurement are essential to assuring the safety and profitability of industrial processes. In this project, we are Implementing an intelligent mechanism using machine learning to predict the level of liquid in a reservoir based on the time and motor speed thus avoiding errors and keeping the process is ongoing.
Keywords: Adaptive Liquid level control, Machine learning, Intelligent system, reduced error , improved efficiency
A liquid Level Control System is a system specifically designed to control the level of fluid in tanks. The main aim possessed by these systems is to control the rate at which the pump delivers fluid to the tank so it can reach the desired level inside the tank. The purpose of the liquid level system is to maintain a specific level of fluid inside the tank. The liquid level control systems find major applications in industrial processes. The controller present in the system generates the control signal that is converted into the desired signal by the actuator and is fed to the plant to perform the desired action.

1) Case 1: Flow monitoring
2) Case 2: Orientation of the nozzle if the nozzle is m misaligned, there would be a loss.
3) Case 3: If there is a blockage in the pipe or nozzle it is very difficult to find the area of blockage or sometimes it is unknown whether the tank is empty or there is a blockage in the pipe due to which the flow of fluid is stopped.
4) Case 4: When the tank gets empty the containers are left unfilled with the liquid and if both the tanks are full the liquid overflows out of the tank.
5) Case 5: When the motor has to be running at a speed of 20 rpm but rotates at 30 rpm then the outflow is more and the tank level will increase.
6) Case 6: Based on the product demand, the quantity of liquid level in the tank has to be ensured.
The water level in the tank[1] is controlled according to the set point given by the user,this approach was chosen mainly because fuzzy logic is more accurate and stable for a wide range of set points. The water levels were reached accurately and the time taken to reach the set point depends proportionately upon the value of the error. But the Level in the tank was checked manually. Error Measured Was 2.5. Efficiency was for Different Set Points and Achieved 95.3% 8 Level Set Points Were Used.
Dongsheng Wanga,*, Yan Wang [2] proposes a waterworks optimization control system based on machine learning, through the historical data of the plant water treatment process. offered a new way for optimal control of water, and at the same time confirmed the effectiveness of machine learning in the application of water energy consumption prediction and configuration optimization direction. Second, this paper designs an optimization control system for water plant optimization, consisting of a concise and convenient control interface for the above subsystems, and combines the theory and the use of the water plant optimization control system.This author does not mention the auto correcting of the speed. The efficiency achieved was only 60.9 % .
Kalidasan, J. Ben Ajai Raja proposed an Automatic Bottle Filling Machine [3] where the Motor Is Used to Rotate the Bottle base plate, and Sensors were Used to identify the Position of the Base Plate Rotation. Then the Solenoid Valves are used To open the Valve Of The liquid flow to the bottle for a Particular Time, in this work the quantity of flow of liquid in the tank is not considered, it does not have a feedback loop. And No monitoring of level in the tank and no automatic liquid filling is considered
ISSN: 2321 9653; IC Value: 45.98; SJ Impact Factor: 7.538

Volume 10 Issue X Oct 2022 Available at www.ijraset.com
Filling Machine which can fill different sizes of containers based on the height[4]. The filling of liquid is done based on the threshold set in the controller. In this work Identifying the blockages and errors in flow pipes are not considered. and there is no monitoring of the liquid level in the tank. And no mechanism for auto refilling of the tank was deduced. Md. Liton Ahmedl proposed a n automated bottle filling system using a PLC based controller [5]. The filling and the movement of the bottle along the plant is controlled by the afore mentioned PLC. The PLC controls a conveyor on which the place unfilled bottle move. The position of the bottles are detected by an infrared sensor and a dc pump is used to control the flow of water, hence enabling functionality at night. Here the proposed method doesnot take into consideration the quantity of liquid filled or the monitoring of the level of liquid in the tank. Also it lacks the implementation of a feedback loop and a prediction model to estimate the speed of the motor.
The idea and development of an intelligent tank with a water level sensor [7] is conceptualized wherein the water proportion can be determined by the emptiness and fullness of the tank using artificial intelligence. The proposed system claims the reduction in water wastage but lacks proposing an auto correcting closed loop system. The system also lacks real world efficiency.
The proposed system of ultrasonic transducer based water level sensor using pump switching [8] addresses the problems of untimely response and frequent breakdown of contact sensors due to corrosion and coating from the water medium. Yet it fails to address scenarios where the pump would run unnecessarily when there is no water at the source and overheating of the pump.
Liquid level monitoring using FBG sensor array [9] was also proposed 9 FBG(Fiber Bragg Grating) temperature sensors in a tank of height 100 cm and width 30 cm. The work proposes a level estimation in two steps where level detection is done using classification models and level estimation is done using regression models. The level detection is carried out by calculating under which FBG the liquid level is. The proposed method has error of 3.56 cm to 6.28 cm depending on the machine learning model. It only has a claimed efficiency of 89.50%.
As per our proposed solution, the control of a dc pump using machine learning is a effective and feasible solution. Considering the study done on the comparison between PID control and Neural network control over a dc motor [10], the concept of using newer trained models and logics over conventional PIDs is proven better. Similar work has been done to develop a mechatronic model that monitors the water levels and controls the inflow rate using fuzzy logic [11]. The simulation showed an average 0.345 error with an efficiency on only 75.50%.
The effectiveness of the afore mentioned approach is further emphasized the comparison with fuzzy logics[12], where in the intrustrial controller like PID had an estimated steady state error of 3.56 seconds.
The implantation of IOT for Industrial Monitoring and Control [13] was also proposed. The proposed method relied on the use of a reliable TCP/IP protocol in conjunction with GPRS enabled communication. This was done using a GSM and DTMF module. The proposed system was based on a conventional monitoring system with no auto control or implementation of any prediction models to increase efficiency and effectiveness.
The proposed work is to develop a smart intelligent adaptive system which auto controls the level of liquid in the tank based on the data learn by prediction models to increase efficiency and effectiveness. The proposed solution is as follows.
As we can observe from the above stated literature survey some plants require human interference in the work cell to avoid errors like checking tank level, blockages, flow, leaks, auto refilling, etc. and the systems are not intelligent enough to reduce the error and get the maximum efficiency.and also, these existing system does not consist of any monitoring display to show the parameter values. To overcome these disadvantages, we introduce a hybrid Machine Learning system that can monitor and detects an error in the process and auto correct it intelligently.
The process is integrated with Machine Learning algorithm[15] which was implemented to control the motor speed for better accuracy and less error,which keeps a record of old input commands and compares them with the given command with the help of a database and suggests the best action to be carried out during the period. Even in case, the command is not given it uses the existing commands from the machine learned database and executes to solve the particular error.
This system consists of two modes, semi automatic mode and an automatic mode wherein semi automatic mode the human interference is involved and the input is given to the system through speech commands[14] or GUI. in automatic mode, the system analyses the problem and compares it with the database to solves the situation accordingly.

ISSN: 2321 9653; IC Value: 45.98; SJ Impact Factor: 7.538 Volume 10 Issue X Oct 2022 Available at www.ijraset.com


1) The Machine Learning algorithm [15]compares with the previous data set at that particular time and corrects the rpm according to it and reduces the error.
2) A system in which the Machine Learning algorithm[15] controls the plant with comparison of the previous database where the algorithms is written in such a way to reduce the error and maximize the efficiency of the production. Where the Machine learning code consist of speech recognition where it filters the unregistered speech frequency through database. The micro controller displays all the values of the sensors in the display attached to it. The Machine learning system monitors the flow, liquid output and level of the tank.

3) Where to overcome this scenario data sets which consists of day, time, level of water and motors speed are being recorded.
4) Then the recorded data is processed by the ML algorithm[15] and gives the prediction of fluid required to filled the next day.
5) The ML code compares the data of real time output of the motor speed and the reference speed set from the data set by the trained model to detect the error.
6) The ML code adjusts the motor speed to minimize the error according to the reference speed from the data set.
Fig 2: Block digram of plant with sensors and database
ISSN: 2321 9653; IC Value: 45.98; SJ Impact Factor: 7.538

Volume 10 Issue X Oct 2022 Available at www.ijraset.com
let's assume a plant where the tanks are filled with liquid and they flow through the pipe goes to the nozzle where the containers come through the conveyor belt and the nozzle valve opens and fills the containers with the liquid, Where to be precise the primary tank is filled with the liquid with the help of a pump and when tank A is empty or goes below the threshold the liquid is pumped to tank A from the secondary tank.
1) The input command is given through voice or manually[15] is executed by the controller.
2) Where the controller is connected to the database and checks or compares the input commands parameters with the previous old commands parameters which are stored in the database.

3) Cu(control unit) will decode the tag, and take appropriate decisions on pump automation.



4) The control unit is connected with different types of sensors and actuators to control the error of the operation and increase the efficiency of the production through uninterrupted services.
5) There are three sensors connected to the tank. L3 ( on top) L2( in middle) , L1( bottom).
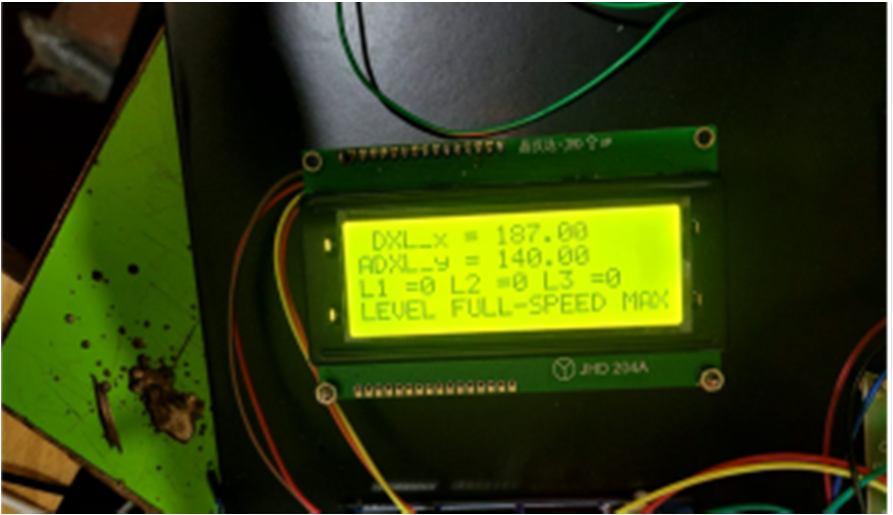
6) As shown in Fig 2, If L1, L2, L3 =1( negative logic ); no sensor data detected= tank is empty and the process will be stopped
7) If the L1, L2=1; L3=0, then the pump speed in the primary will be reduced to 20%.
8) If the L1=1; L2=0; L3=0, then the pump speed is increased by 50%.
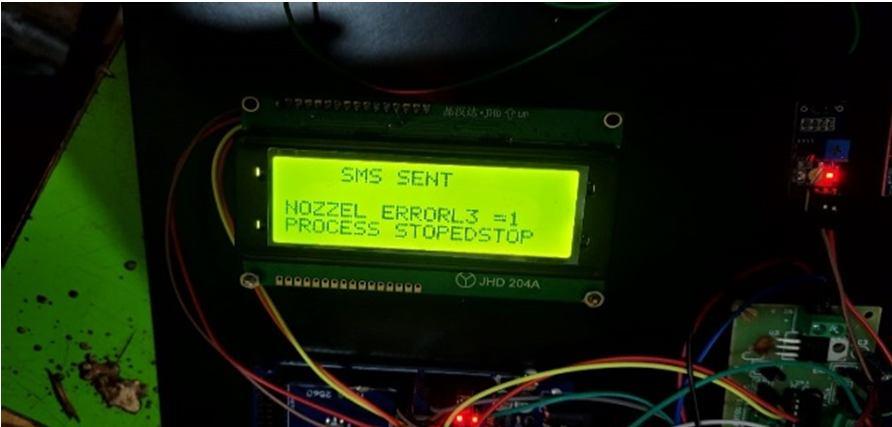
9) If the L1=0; L2=0; L3=0, then the pump speed is increased by 100%.
10) If the Nozzle position is 20<=x<=200, then it indicates a nozzle error and a message will be sent to the control unit for manual verification as shown in Fig 3
11) The entire process is instantaneously controlled by the fusion of sensor data.
ISSN: 2321 9653; IC Value: 45.98; SJ Impact Factor: 7.538 Volume 10 Issue X Oct 2022 Available at www.ijraset.com


1) A smart liquid filling machine that adjusts the motor speed based on time.it can also auto adjust the motor speed in case of any change in the liquid level.
2) Auto adjust system works on RF(random forest). this model is capable of predicting the water level based on the time(run time of system in minutes) and the motor speed
3) The dataset used to train this model consists of the run time of the system in minutes, the motor speed in %, and the water level.
4) The data can be represented in a scatter plot as shown below
Predicting the speed of the motor takes place with three different cases explained below as following
A. Case 1:Interval of 30 min
In case 1 the motor speed and liquid levels are measured at an interval of 30 min as shown in the image below. the results are shown in the below image. we got are accuracy is 0.986 And the mean error is 0.009234 which is the highest accuracy among the other 2 cases.
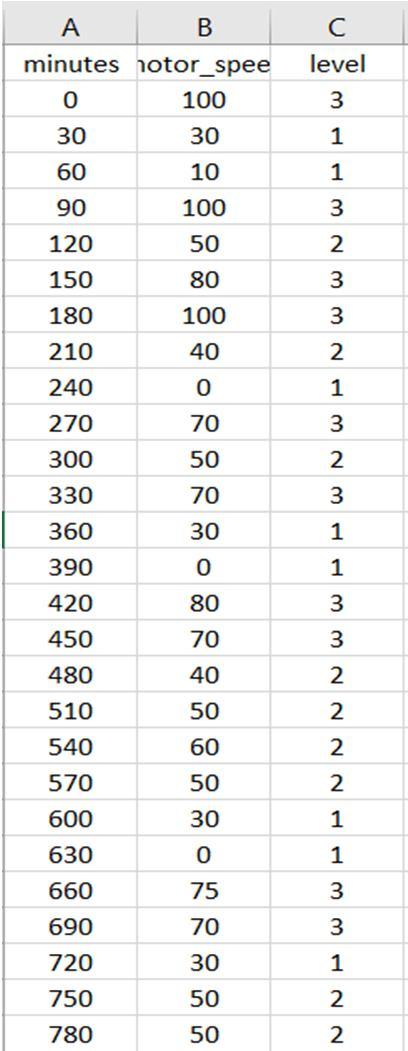
Fig 4: datasets used to train the model
The RF model has the input as the minutes and motor speed and the output as the level
Fig 5: Scatter plot of the Data set
First, we have to split the data set into train and test data. To do it we have to import the function test train split. this function divides the dataset into train and test in a ratio of 7.5:2.5 as shown in Fig 6.
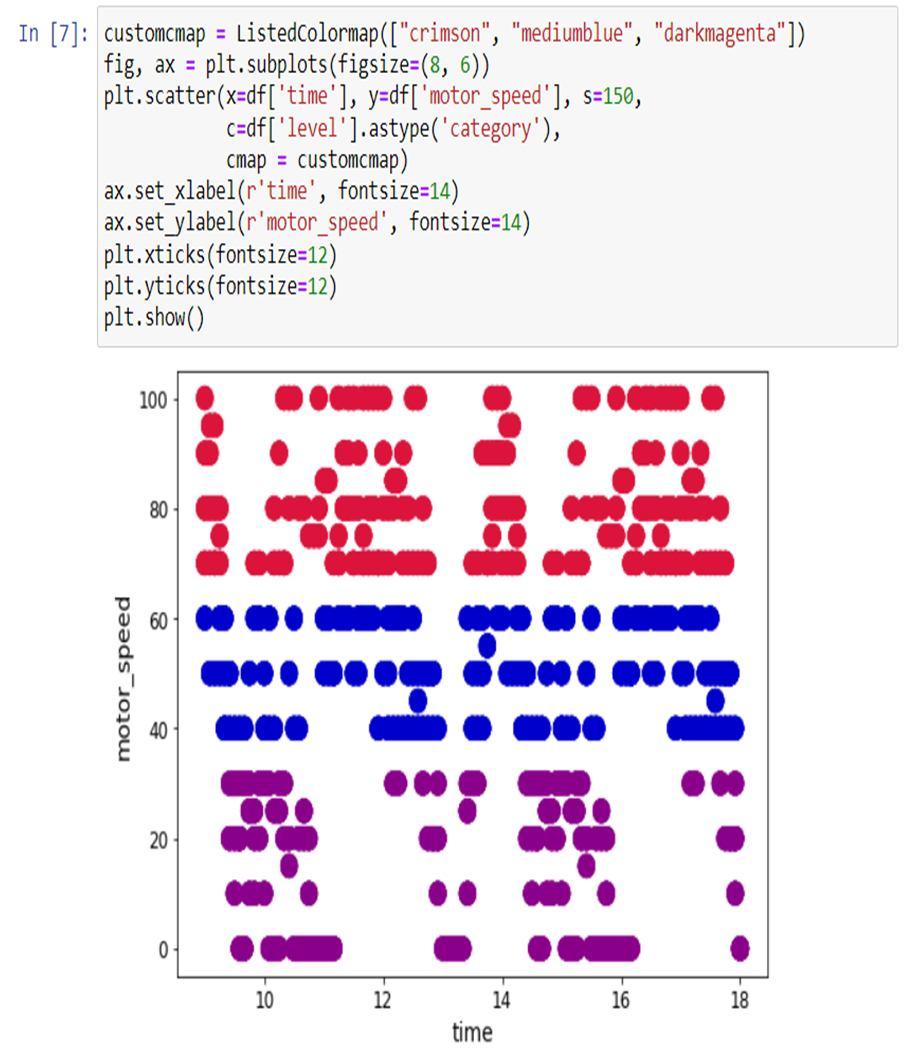
Fig 6: Training and testing of Data set

ISSN: 2321 9653; IC Value: 45.98; SJ Impact Factor: 7.538 Volume 10 Issue X Oct 2022 Available at www.ijraset.com

After splitting the data into train and test we have to import RandomForestClassifier and use this function on the training datasets to create an Rf mode as shown in Fig7



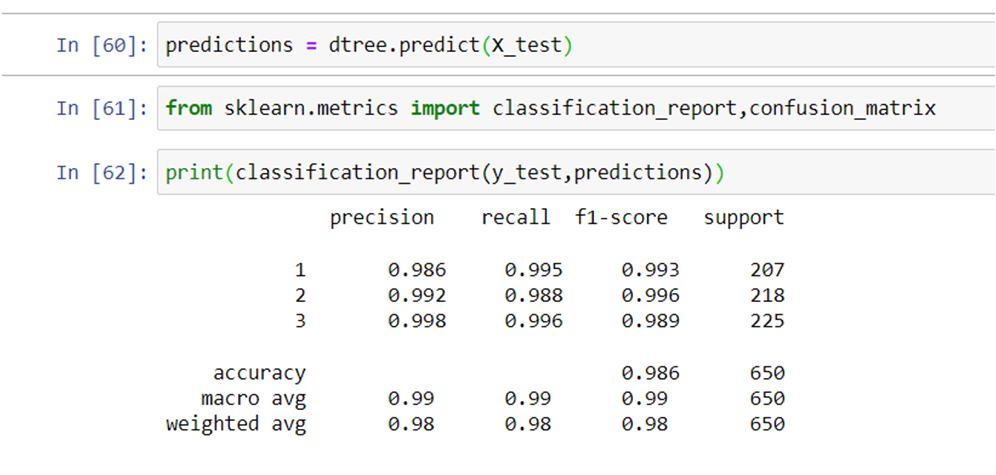
Now we test our RF model by applying it to the test data and verifying the working and accuracy of the model using a confusion matrix classification report as shown in Fig 8. The accuracy measured is 98.6%
Fig8: Confusion matrix, accuracy
A scatter Graph is a plot between the actual and predicted water level as shown in Fig 9.
We have also tested the accuracy by comparing the predicted data and the actual data as shown in Fig 10
ISSN: 2321 9653; IC Value: 45.98; SJ Impact Factor: 7.538

Volume 10 Issue X Oct 2022 Available at www.ijraset.com
1) How the Efficiency is Increased
We reduce the parameter in the data by excluding the days and integrating the water level into one column.

Fig 11: Data set with day wise per week


Fig 12: Data set with time and speed
In the first figure, Fig 11, the time column is taken in a 5 min interval and follows a 5 repetitive entry of each time instance for different days of the week.
The next columns L1, L2, and L3 indicate the liquid level indicated is by 1

The 6th column consists of motor speed percentage
The last column indicates the week
The tank consists of 3 liquid levels denoted as level 1, level 2, and level 3. we have considered 0% 35% motor speed as level 1, this indicates that the liquid is almost filled hence its motor speed is low. level 2 is in the range of 35% 65% motor speed. this indicates that the tank is partially filled and moderate motor speed is required. Level 3 is in the range of 65% to 100% motor speed. this indicates that tank is empty and needs the motor to run at a higher speed In the next figure, we have reduced the level column from 3 to 1 and also have converted the cyclic time dataset to a series dataset to improve the speed as well as the accuracy We also converted the cyclic working hour into a finite set of minutes which has an interval of 30 min as shown in the figure We also added more data to the dataset
ISSN: 2321 9653; IC Value: 45.98; SJ Impact Factor: 7.538

Volume 10 Issue X Oct 2022 Available at www.ijraset.com
Fig 13: Graph of Minutes Vs Speed of motor.
2) Predicting the level of the tank takes place with three different cases explained below as following
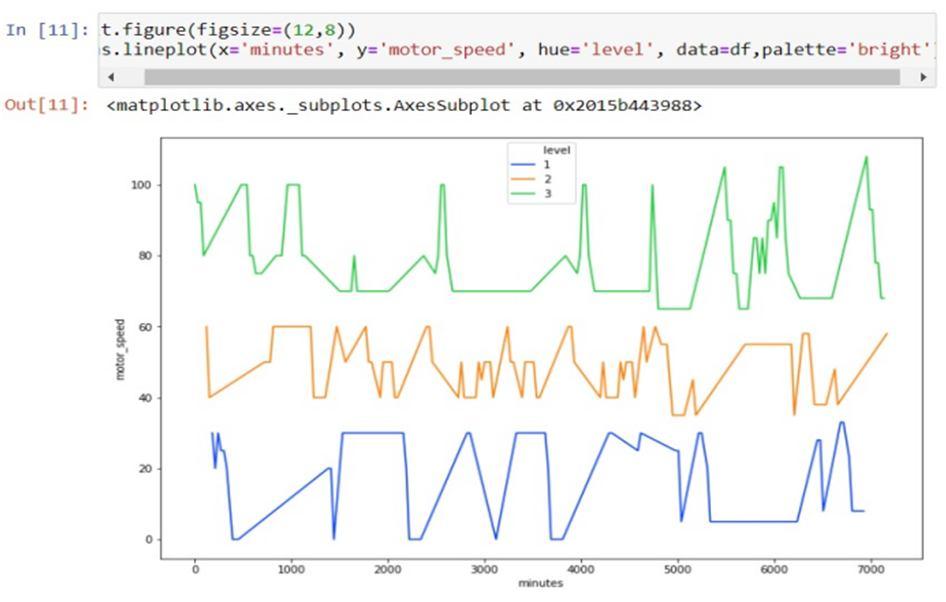
a) First Case: The motor speed is adjusted based on the speed we have set for the particular time and level. the system can also predict the future speed and make its own decision to increase the speed drastically or slowly. we can see from the graph above how the motor speed is varied based on the time
b) Second Case: If the speed is accidentally altered, the system can adjust to the right speed. this is done by predicting the output of the current speed and comparing it with the default speed. In case the next time instance the speed required is less than the current speed or if the level is much higher than the current level it will adjust to an optimal speed

c) Third Case: If the liquid level changes arbitrarily then the system can adjust the motor speed based on the predefined speed and also based on the future level of liquid to set an optimal motor speed
The above graph shows the relation between time, motor speed, and level. the time is plotted on the x axis and the motor speed on the y axis. the liquid level is denoted by 3 different colors as shown above.
Explanation?
Fig 15: plot of actual vs predicted Speed
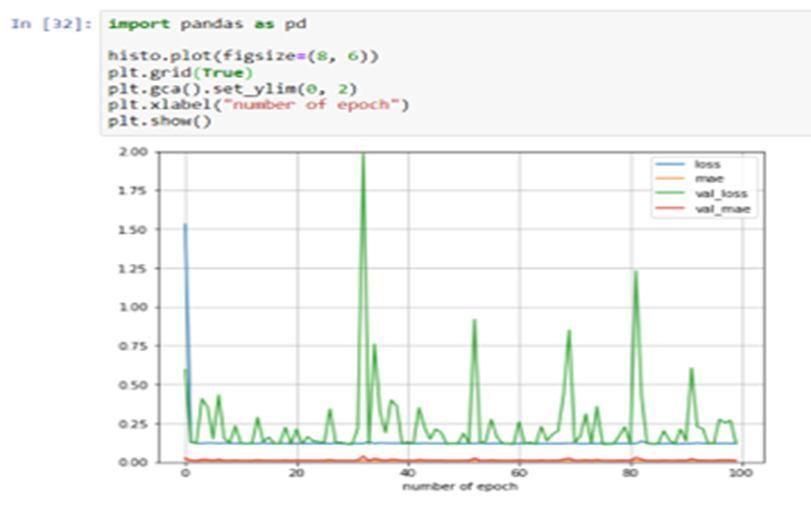

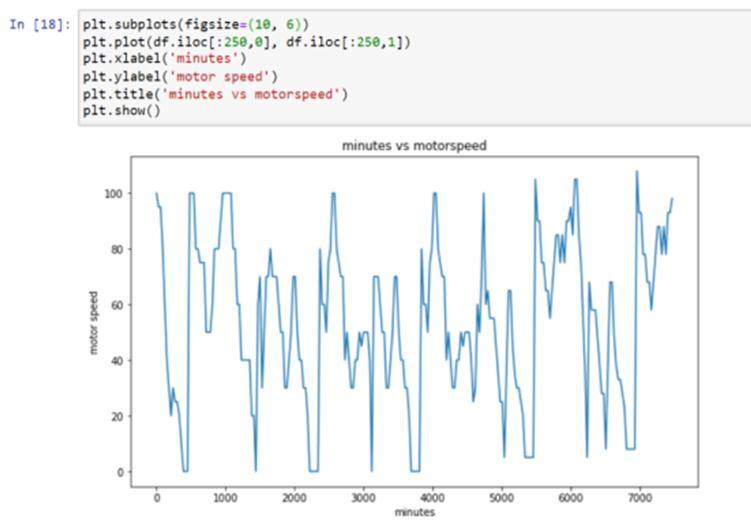
Fig16:trained data with loss and Mae
ISSN: 2321 9653; IC Value: 45.98; SJ Impact Factor: 7.538 Volume 10 Issue X Oct 2022 Available at www.ijraset.com

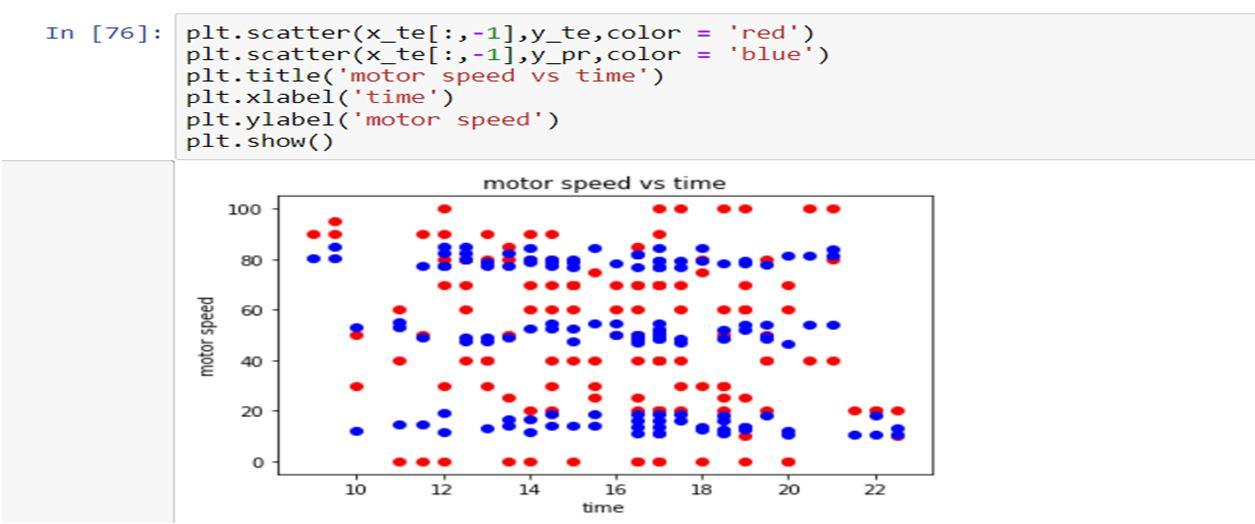
The above graph shows the relation between actual speed and the predicted speed. the red denotes actual speed and the blue for predicted motor speed. the next figure shows the graph of output of the trained ANN model which consists of loss and mae. The x axis is the number of epochs and the y axis are floats. During the first few epoch, we will notice that the error is large. this variation is caused due to The cost function being very large as seen in the fig above. during the second iteration, the model is being calculated based on the initial values and the parameter estimates are improved over several steps such that the cost function assumes a minimum value eventually. we notice that there is more fluctuation over every epoch as the resolution is less compared to 5 min and 15 min this causes weight to oscillate and attend an unstable minimum error.
Fig 17 : Plot of no of epoch vs loss

In case 1 the motor speed and liquid levels are measured at an interval of 5 min as shown in the image below. this datasets is used to train the random forest model as well as artificial neural networks. the results are shown in the below image. we got accuracy of 0.9822 and mean error is 0.009234 .
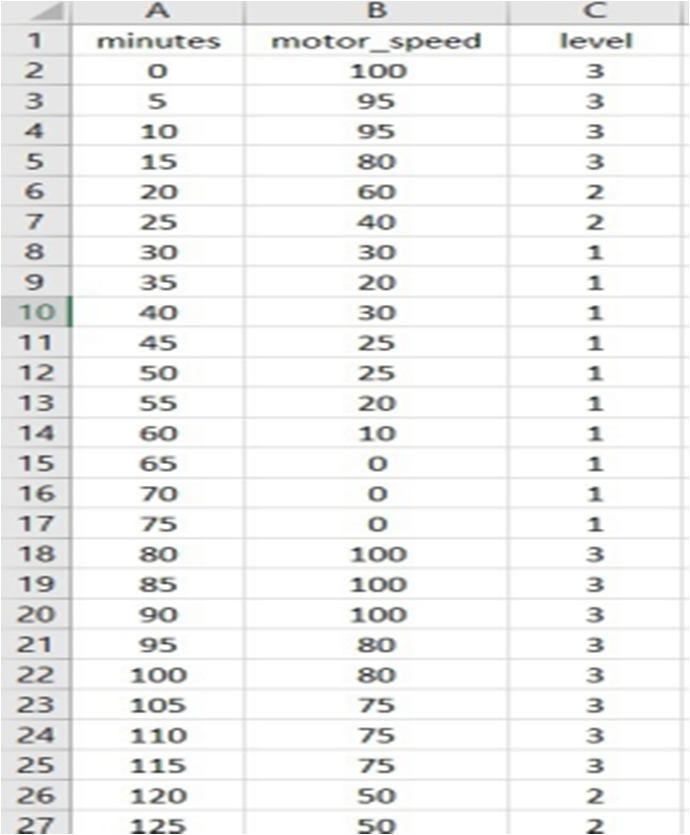

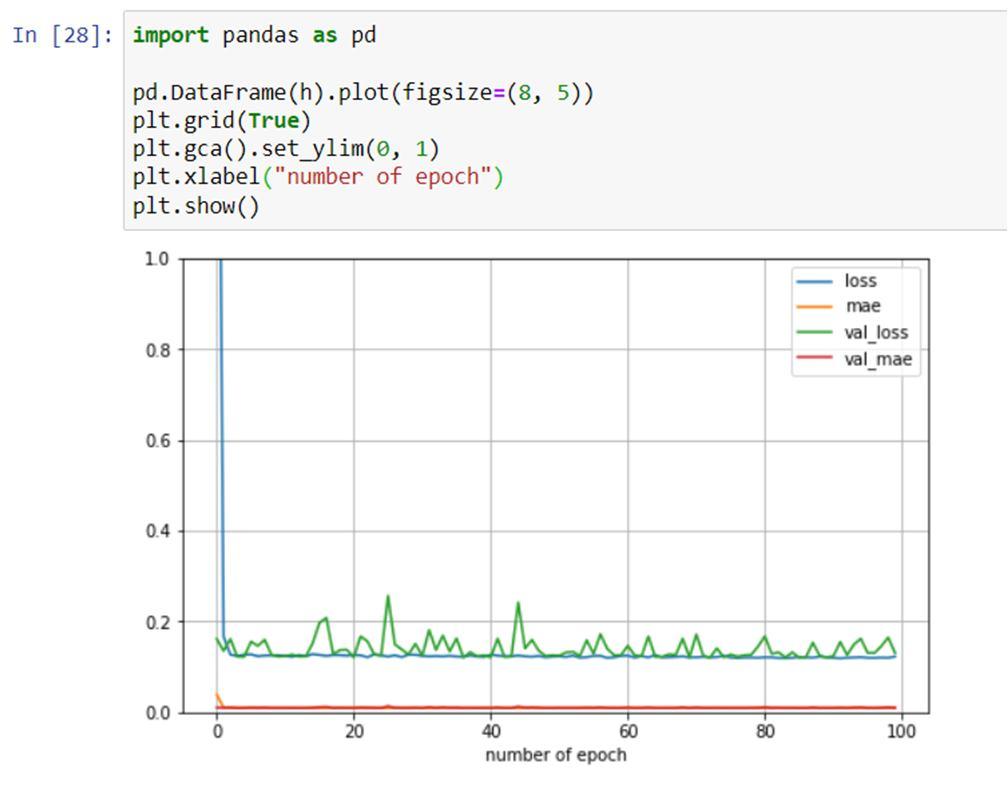
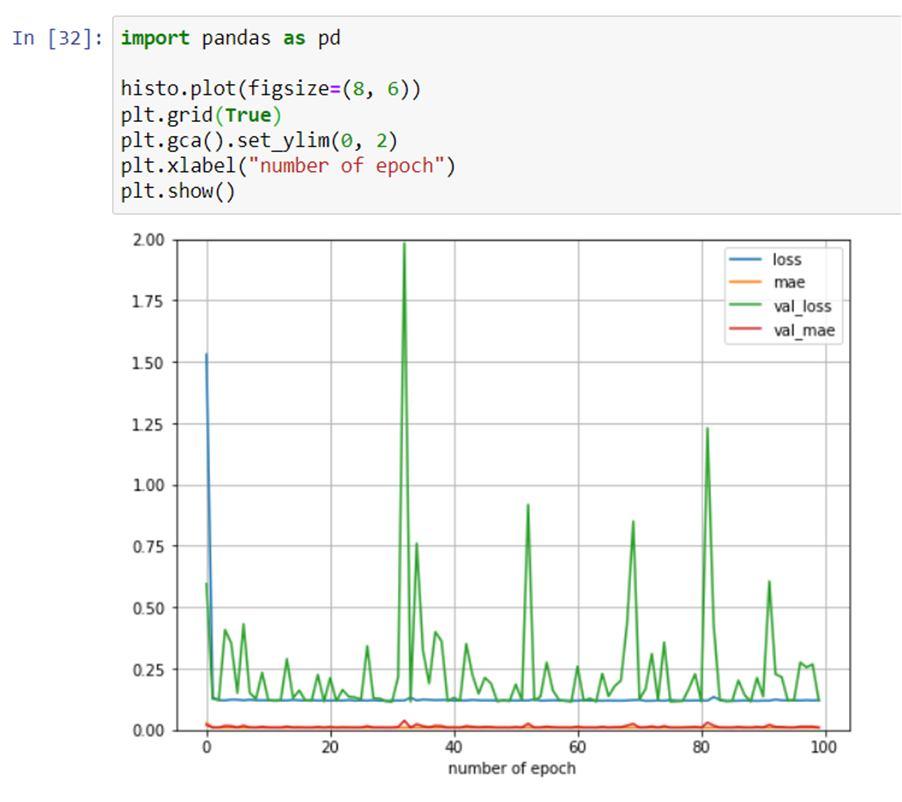
Fig 18: data set for 5 minutes
Fig 19: plot of no of epoch vs loss
Fig 20: actual Vs Predicted for 5 min case
ISSN: 2321 9653; IC Value: 45.98; SJ Impact Factor: 7.538


Volume 10 Issue X Oct 2022 Available at www.ijraset.com
Fig 21: Accuracy and Loss values for 5 min case
The above dataset is similar to the previous dataset.it was derived from the original dataset by taking an interval of 15 min In case 1 the motor speed and liquid levels are measured at an interval of 15 min as shown in the image below. this dataset is used to train the random forest model as well as artificial neural networks. the results are shown in the below image. we got are accuracy is 0.97986 And the mean error is 0.009434
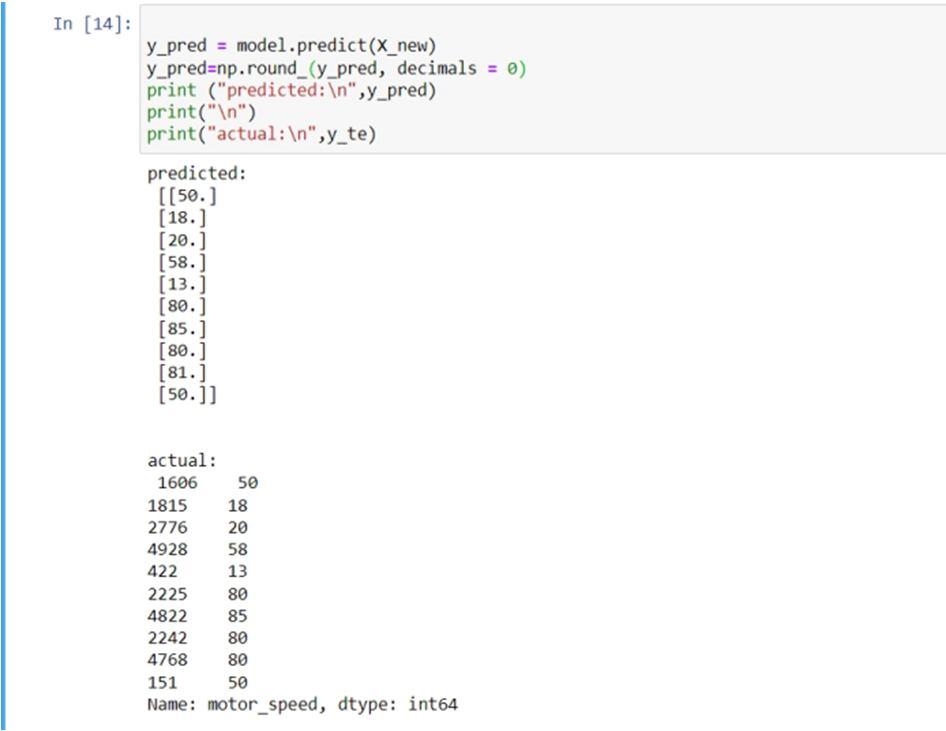


Fig 22: Data set sample for 15 min
Fig 23:Actual vs predicted values for 15 min
Fig 24: Graph of no Epoch vs loss for 15 min


ISSN: 2321 9653; IC Value: 45.98; SJ Impact Factor: 7.538
Volume 10 Issue X Oct 2022 Available at www.ijraset.com
Fig 25: Loss values

In case 1 the motor speed and liquid levels are measured at an interval of 5 min which is randomly organized as shown in the image below.This dataset is used to train the random forest model as well as artificial neural networks. the results are shown in the below image. we got are accuracy is 0.97254 and the mean error is 0.009365


Fig 27: Data set for random Interval


Fig:26 Accuracy for random Interval
Fig 28: epoch vs loss random Interval
ISSN: 2321 9653; IC Value: 45.98; SJ Impact Factor: 7.538 Volume 10 Issue X Oct 2022 Available at www.ijraset.com

The above datasets is similar to the previous datasets.it was derived from the original datasets by taking an interval of 30 min The above graph Fig 28 shows the output of the trained ANN model which consists of loss and Mae we notice that there is more fluctuation over every epoch as the resolution is more compared to other cases but is jumbled hence during training it might give random parameters are allotted during the learning process causing the model to give the wrong cost function which affects the next epoch to change drastically and causes weight to oscillate and attend an unstable minimum error

Fig 29: Actual Vs Predicted values for random interval


Fig 30: Loss values for random Interval

ISSN: 2321 9653; IC Value: 45.98; SJ Impact Factor: 7.538 Volume 10 Issue X Oct 2022 Available at www.ijraset.com

Table 2: comparison analysis of MAE for different cases carried out vs other realted work Sl.no cases MAE 1 5 minutes 0.009234




15minutes 0.009457

30 minutes 0.009322


Random for 5 minutes 0.009365


Namrata Dey, fuzzy logic[2] 2.5 6 Machine learning techniques, FBG using MM [9] 3.56 7 Machine learning techniques, FBG using SVM [9] 6.28 8 Machine learning techniques, FBG using SVMmin [9] 6.14 9 Water level sensor, fuzzy [11] 0.345 10 Speed control using Machine learning Using NN[10] 0.0721 3) Comparison analysis of the datasets for all the cases

MEAN ABSOLUTE ERROR

2.5 3.56 0.345 0.0721 0 1 2 3 4 5 6 7 ERROR
0.009234 0.009457 0.009322 0.009365
Fig a: Dataset for 5mts
Fig b: Dataset for 15mts
Fig c: dataset for 30mts In the above figure, we can see how all the 3 datasets are co related to each other. The motor speed and level at 5 min in fig18 is equal to the motor speed and level of 15 min in fig 22. Similarly The motor speed and level at 30 min in fig a are equal to both the motor speed and level of fig b and fig c
ISSN: 2321 9653; IC Value: 45.98; SJ Impact Factor: 7.538 Volume 10 Issue X Oct 2022 Available at www.ijraset.com
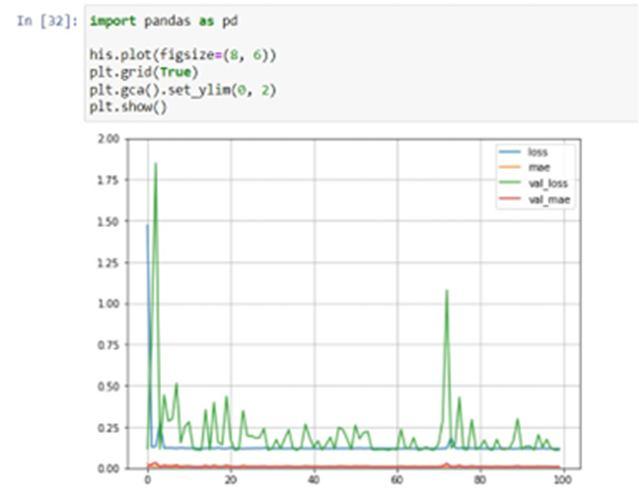
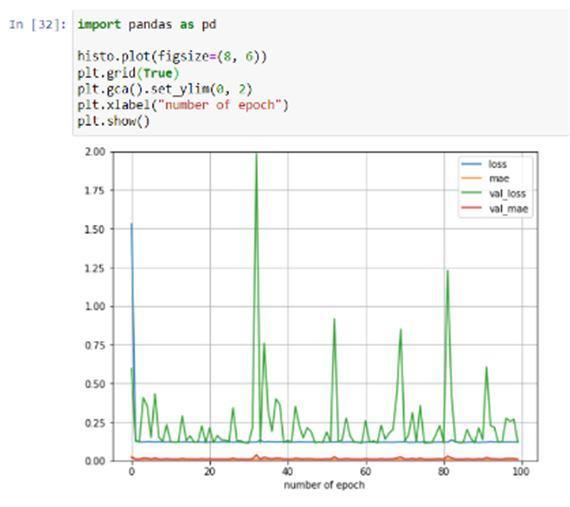
In the first graph, we can see the loss fluctuation per epoch is low compared to the other 2 graphs. This is because the resolution is much higher compared to the other cases. the Mae is almost the same for all 3 cases
Overall its observed that the proposed solution has an overall higher accuracy of 98.6% and above under various testing parameter. This is achieved while maintaining a lower mean absolute error, as low as 0.009234. Considering the precision of the trained machine learning model, its observed from the datasets that motor speed is maintain ensuring efficiency and avoid motor overheating. Comparing the ANN model in various cases also reveals a lower loss fluctuations per epoch as compared to other solutions.

[1] Water plant optimization control system based on machine learning, Dongsheng Wanga,*, Yan Wanga , Rui Zhoua , Yong Caob , Fuchun Jiangb , Xue Zhangb , Jinghua Lia, doi: 10.5004/dwt.2021.27056, 222 (2021) 168 181.
[2] Design and Implementation of a Water Level Controller using Fuzzy Logic, Namrata Dey Ria Mandal , M Monica Subashini, ISSN : 0975 4024 Vol 5 No 3 Jun Jul 2013 2277
[3] Automatic Bottle Filling Machine, . B. Kalidasan1, J. Ben Ajai Raja International Research Journal of Engineering and Technology (IRJET) , Volume: 05 Issue: 03 | Mar 2018, p ISSN: 2395 0072,

[4] Automatic Bottle Filling System Using PLC Based Controller, Md. Liton Ahmed1, Shantonu Kundu, Journal of Advancement in Mechanics Volume 4 , 2019.
[5] Automatic Vessel Filling System Using Raspberry pi, Pallavi Vivek Shete, Minal V. Raundale, International Engineering Research Journal (IERJ) Volume 2 Issue 3 Page 1449 1451, 2016, ISSN 2395 1621
[6] Industrial Monitoring and Control Using Internet of Things, International Journal for Modern Trends in Science and Technology ,2016
[7] Design and Construct Intelligent Tank“Water Level Sensor, Journal of AL Qadisiyah for computer science and mathematics Vol.10 No.3 Year 2018ISSN (Print): 2074 0204 ISSN (Online): 2521 350
[8] Development of an Ultrasonic Sensor Based Water Level Indicator With Pump Switching Technique, June 2018Journal of Electrical Engineering
[9] Machine learning techniques for liquid level estimation using FBG temperature sensor array, Contents lists available at Science Direct Optical Fiber Technology

[10] DC Motor Speed Control Using Machine Learning Algorithm, International Journal of Engineering Research & Technology (IJERT),ISSN: 2278 0181,2018
[11] Design Of Water Level Controller using Fuzzy Logic System , National Institute of Technology Rourkela , 2019
[12] Performance Comparison of Industrial Controller and Fuzzy Logic Controller For Water Level Tank Control System, International Research Journal of Modernization in Engineering Technology and Science ( Peer Reviewed, Open Access, Fully Refereed International Journal ),2022
[13] Industrial Monitoring and Control Applications Using IOT, Shrushti Panpaliya,International Journal of Emerging Technologies in Engineering Research (IJETER) Volume 6, Issue 1, January (2018)
[14] Secured Speech Industrial Automation Based on Raspberry Pi and IoT ,Bhagirathi Bai Vittal Rao 1* Hanume Gowda Chandrakanth ,International Journal of Intelligent Engineering and Systems, Vol.11, No.6, 2018 DOI: 10.22266/ijies2018.1231.23
[15] IoT based Machine Learning Automation Algorithm for Controlling the Industrial Loads ,Bhagirathi Bai Vittal Rao1* Hanume Gowda Chandrakanth,International Journal of Intelligent Engineering and Systems, Vol.14, No.4, 2021 DOI: 10.22266/ijies2021.0831.14
