10 XII December 2022 https://doi.org/10.22214/ijraset.2022.48417
ISSN: 2321-9653; IC Value: 45.98; SJ Impact Factor: 7.538 Volume 10 Issue XII Dec 2022- Available at www.ijraset.com

ISSN: 2321-9653; IC Value: 45.98; SJ Impact Factor: 7.538 Volume 10 Issue XII Dec 2022- Available at www.ijraset.com
Abstract: In the hot and humid environment of Indian summers, a conventional cooling system is too expensive for most people. In this project, Passive cooling systems which consume less power, are more efficient, cost less, and make very little noise are used.
After researching various passive cooling techniques in isolation and running simultaneously, we aim to develop a system that is cost-effective and efficient at cooling the Indian household.

The focus of this project is on the four major types of passive cooling techniques, they are radiant cooling, solar chimneys, wind catchers, and shading devices.
Supplementary techniques like terrace cooling are also included. The initial analysis and study of the windcatcher system with various heights and inlet shapes have been conducted. A software model has been generated using fusion 360, analyzed in Ansys fluent, and results were recorded.
The radiant cooling system has been designed and an analysis of the system is done. Once the individual system analysis is successful, an integrated model containing all four systems will be generated and analyzed. The integrated system hence designed will ensure that there is cooling obtained in the room using low-energy passive cooling techniques. Ⅰ

India is a country with varied climates and a significant portion of the country is living in a hot and humid environment[1]. While many people long for relief from the scorching heat of the sun, an air conditioner is a luxury, that most can’t afford. In a developing country like India, the need for affordable cooling is becoming increasingly apparent. The project aims to provide an affordable cooling system that is accessible to a larger population than it was previously available to.
Conventional cooling has some disadvantages that can be improved with this project. It is costly to purchase and install. Requires frequent maintenance for optimal performance. It has many moving parts which lead to multiple points of failure and consume a massive amount of electricity. These aspects of conventional cooling make it unsuitable for the majority of the population. However, passive cooling is different. Passive cooling systems consume less power, are more efficient, cost less, and make very little noise[2]. They are the ideal system for cooling in the Indian market. This project has the potential to be beneficial not just to any single individual but to the environment too.
It will benefit the common man by being cheaper than a conventional system and consuming less electricity at the same time. Since it consumes less electricity, it also reduces the fossil fuels burned to support the environmental impact of burning fossils. The HVAC industry is one of the largest consumers of electricity[3]. The project has the potential to reduce that consumption by a considerable margin.
The aim of this project is to analyze, design and fabricate a contained passive/hybrid cooling system.
1) To compare the statistical difference in performance between different passive cooling devices.
2) To evaluate the effectiveness of selected passive cooling devices..
3) To determine the rate of cooling in different passive cooling systems due to varied parameters.
4) To develop an optimal structure for a radiant cooling system.
ISSN: 2321-9653; IC Value: 45.98; SJ Impact Factor: 7.538 Volume 10 Issue XII Dec 2022- Available at www.ijraset.com
In this project, some research papers have been explored. Based on the research papers, the shortcomings and findings of research done on passive and hybrid cooling were analyzed. With the knowledge gained, a prototype will be fabricated based on the design finalized using software like SolidWorks, Ansys, etc. The final product will aim to compensate for some of the shortcomings noticed in previous research. The design will be for a residential apartment. Simulations will be conducted on the finalized design of the model using Ansys having a fixed set of parameters including orientation w.r.t. to the sun, ambient temperature and humidity, wind flow, and other factors.
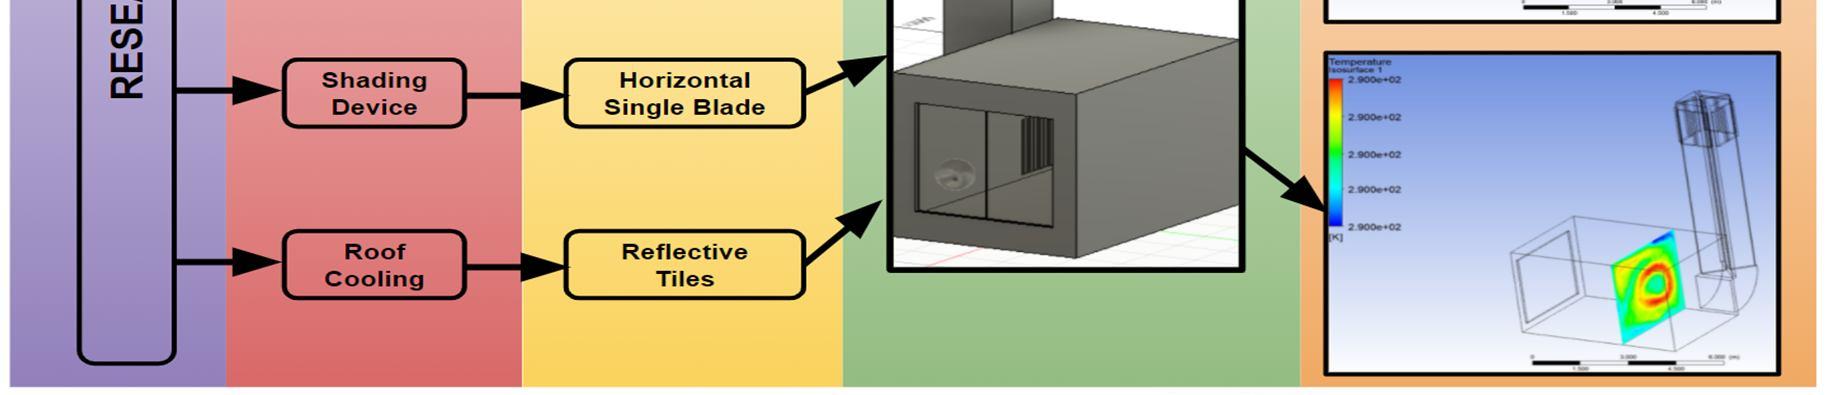
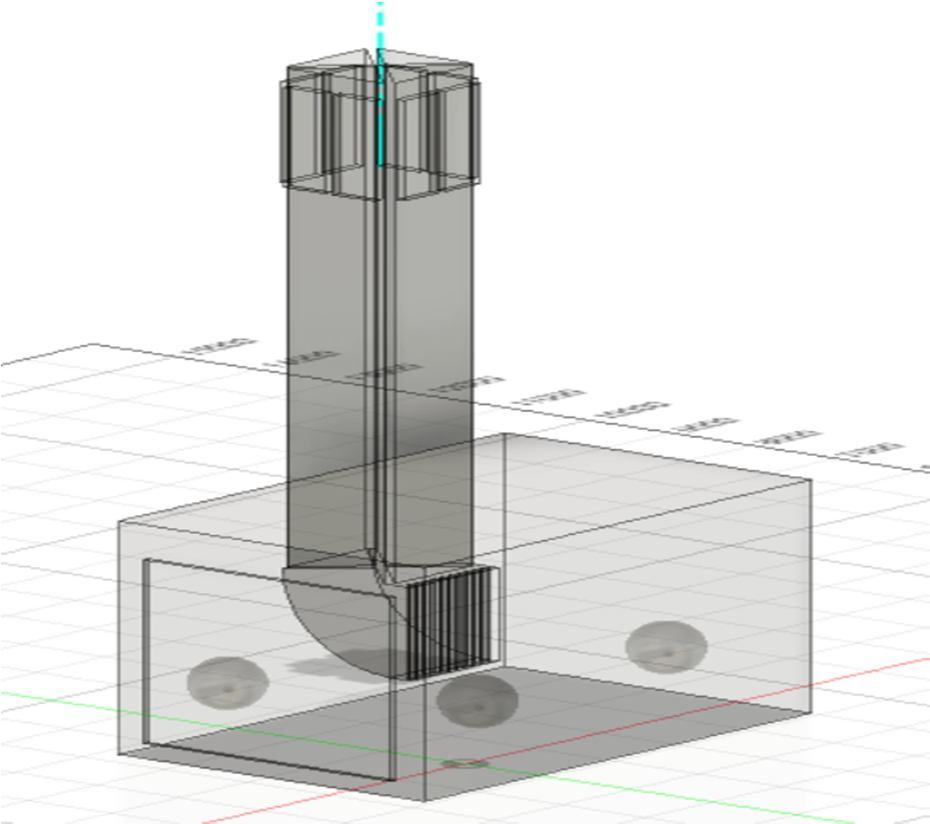
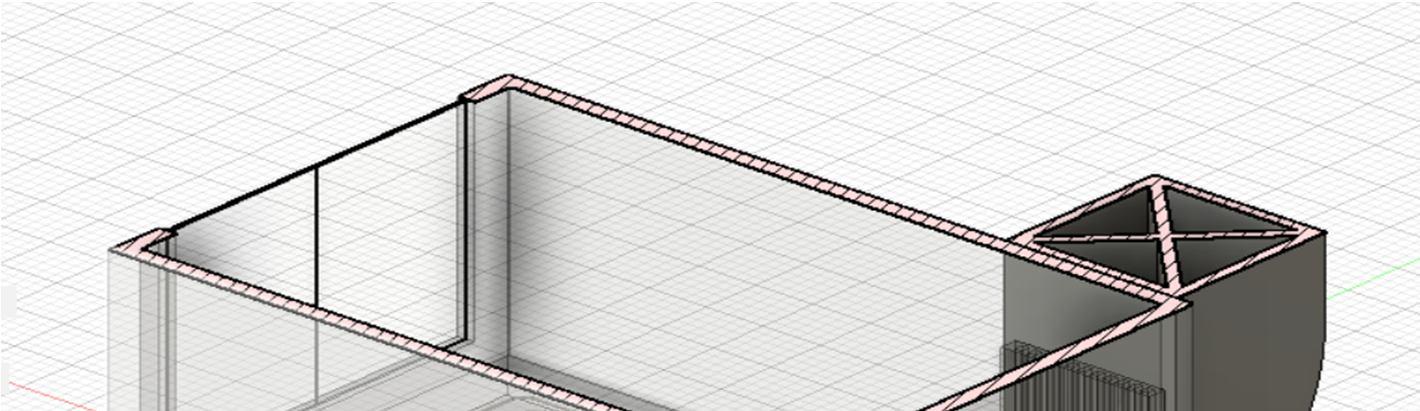
In our design, we decided to incorporate the wind tower and radiant cooling system. A structure that was both performant, included the cooling mechanisms necessary and did not pose unnecessary challenges in the analysis stage was designed.
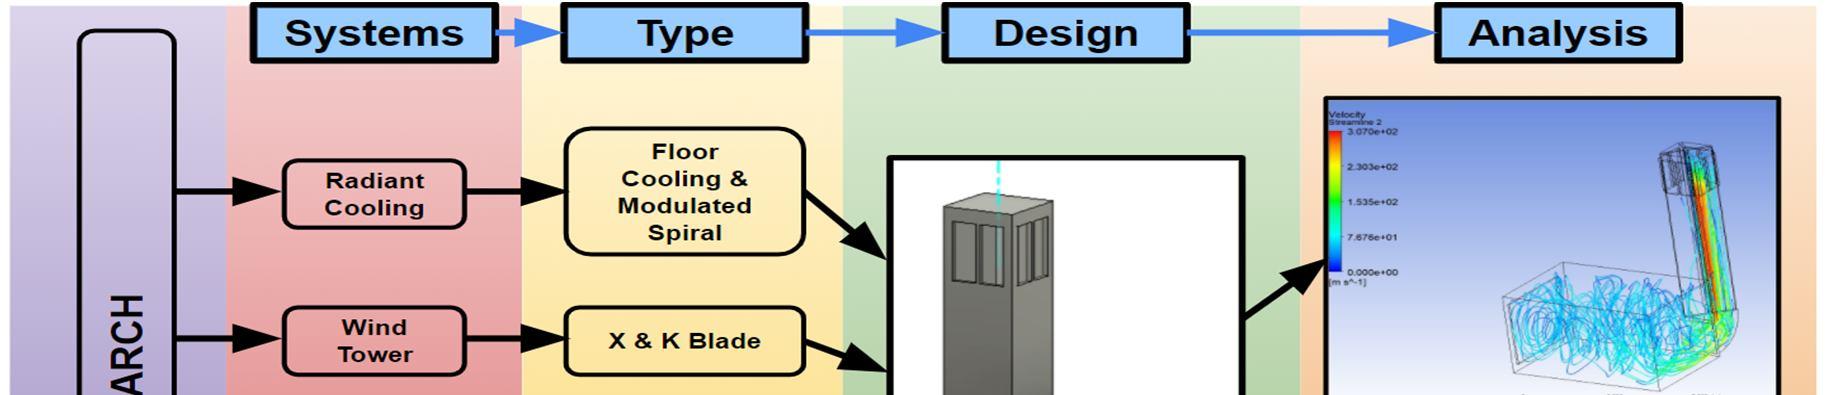
Figure SEQ Figure \* ARABIC 2: Wind Tower
*In this finalized structure the dimensions of the room are
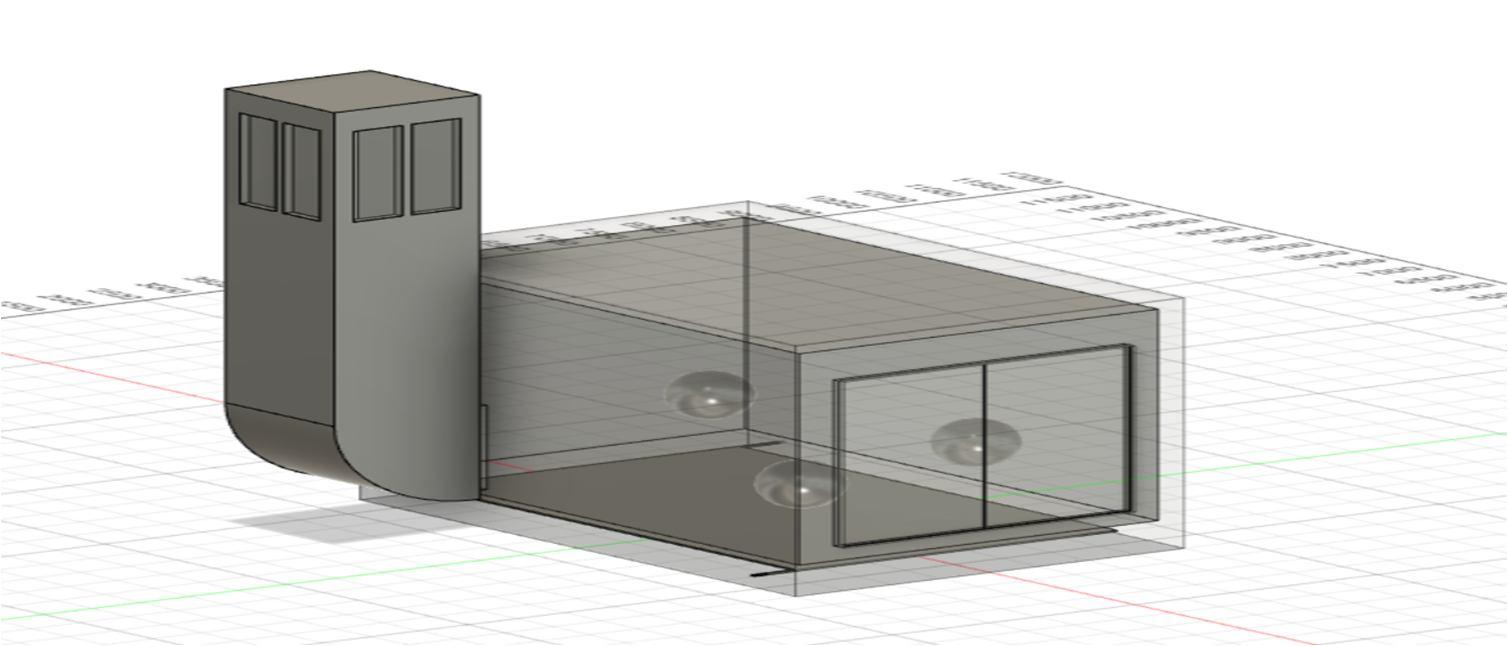
Room length: 6000mm (5700mm)
Room breadth: 4000mm (3700mm)
Room height: 4115mm (35000mm)
ISSN: 2321-9653; IC Value: 45.98; SJ Impact Factor: 7.538 Volume 10 Issue XII Dec 2022- Available at www.ijraset.com
The properties of the materials used in the analysis are:
Glass properties
Density: 2500 kg/m3
Thermal conductivity: 0.8W/mK
Specific Heat: 0.8 J/g/K
Gypsum properties
Density: 2320 kg/m³
Thermal conductivity: 0.5W/mK
Specific heat: 1138J/g/K
And the dimensions of the wind tower are Dimension of wind tower inlet: 1500x500mm Height of the tower from the ground: (from 3m to 9m subject to analysis conditions) length/breadth (cross-section) of tower: 1500mm
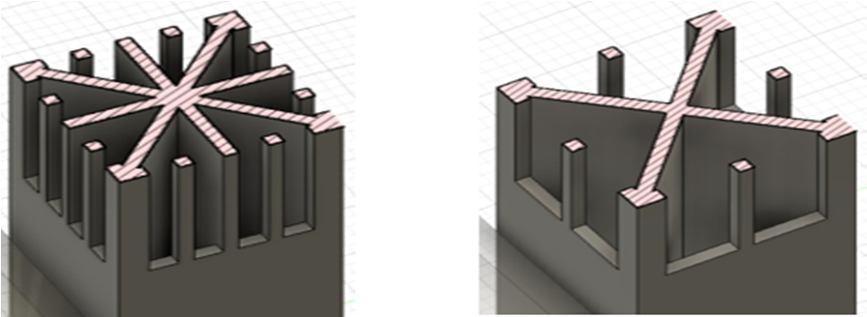
One of the questions the team attempted to solve in the proceeding analysis was if there was a performance difference between the x-blade and k-blade-styled wind catchers in our experiment's climatic conditions, this question arose due to conflicting information obtained in the research phase Hence, the structure of the Wind Tower was designed to accommodate both x blade and k blade windcatchers.
We also chose a radiant cooling system design based on a variety of factors as shown in table 1
TABLE I Factors involved in the design of radiant cooling system[4]
Parameter Counterfl ow Serpentine Modulate d Spiral Comment
Inference
Impact of the water velocity x Negligible effect x Water velocity has negligible effect Water velocity= 0.5-1 m/s
Impact of the supply water temperature x
Average core surface temperature (°C) at Inlet Water Temp = 45°C
Inlet Water Velocity = 0.85m/s
Similar increasing trend during the heating process when the pipe water temperatures are varied from 35° to 50°C.
x
The temp rise is faster with a higher temp of the water. However, Avg Temp is reached at about 3hrs in all temperatures
Heating Period can be reduced if a higher water temp is used. A detailed study is required for optimal water temp and heating time for the least energy
38.026 37.727 38.418
Modulated Spiral has the best avg. temp. although the values don't vary a lot of
ISSN: 2321-9653; IC Value: 45.98; SJ Impact Factor: 7.538 Volume 10 Issue XII Dec 2022- Available at www.ijraset.com
Homogenization level (Temp at various points on the surface)
Better Good Best
Pressure losses Better Good Best (Least Losses)
Hence, the Modulated Spiral type was chosen.
It is clear that for a fixed tubing diameter, an increase of the velocity causes an increase in the pressure losses
Most Homogeneous Temp distribution in Modulated Spiral
Modulated Spiral offers least losses
C. Calculations for a radiant cooling room according to ASHRAE 2019 [5]
A room of 5 occupants in Mumbai, peak temperature 40°C and 86%rh is to be maintained at 24°C and 40%rh Dew point temperature of the room = 9.6°C Moisture content = 0.0087054kg/m3
Step 1: Determine the sensible and latent hourly heat gain for the room.The sensible and latent hourly heat gains are found using accepted procedures found in the ASHRAE handbooks In this case let's assume the formula for sensible heat hS = cP ρ q dt
Where hS = sensible heat (kW) cP = specific heat of air (1.006 kJ/kg oC) ρ = density of air (1.202 kg/m3) q = air volume flow (m3/s) dt = temperature difference (oC) Assuming the air flow to be 1, hs = 1.006×1.202×1×16 =19.347kW
Step 2: Determine the mean water temperature required for cooling Supply water temperature = 9.6°C (A bit higher than the dew point temperature) Assuming a temperature rise by 3K, inlet water temperature is 13°C.
Step 3. Determine the minimum air supply required for the room. According to ASHRAE tabulated data. But it is assumed it to be 1m3/s
Step 4a. Determine the latent load capacity of the air: NP * OCPL × 1.2 × 2500 × (HRODA2 – HRIDA) = W 5 * 0.05861 * 1.2 * 2500 * (0.86 - 0.4) = 404.409 W
Step 4b: Determine the sensible cooling capacity of the primary air: V × 1.2(DBIDA –DBSUP)= ___W 1*1.2*(40-24)= 19.2W
Where
NP = number of occupants in the space
OCPL = latent heat produced by the occupants
HRODA2= humidity ratio of space air HRIDA = humidity ratio of space operating design condition
ISSN: 2321-9653; IC Value: 45.98; SJ Impact Factor: 7.538
Volume 10 Issue XII Dec 2022- Available at www.ijraset.com
V= volumetric flow rate of the supply air
DBIDA = dry bulb temperature of space operating design condition
DBSUP = dry bulb temperature of supply air
Step 5. Determine the sensible load capacity of the air with the following equation:
QS = QPCP(troom – tsupply)×60 = 1×1.2×(24-9.6)×60 = 1036.8kJ/h= 0.288kW
Total sensible cooling required is 0.288×4/3= 0.384kW
Step 6. Select a panel surface temperature at least 2 K higher than the space operating dew-point temperature (13°C) Thus, the required temperature is higher than the MWT calculated in step 2.
Step 7. From the 12°C panel operating temperature or panel mean water temperature, derive the supply water temperature and water temperatures to and from the panels. Typically, the difference between supply and return water temperature is 4 K, so the panel water supply temperature, in this case, is 9.6°C and the panel return water temperature is 14.6°C.
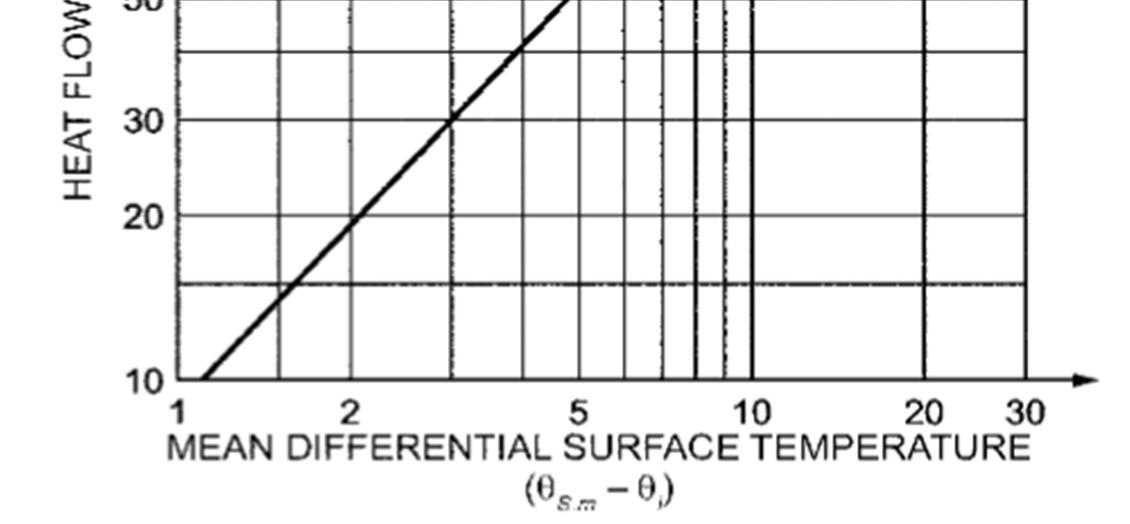
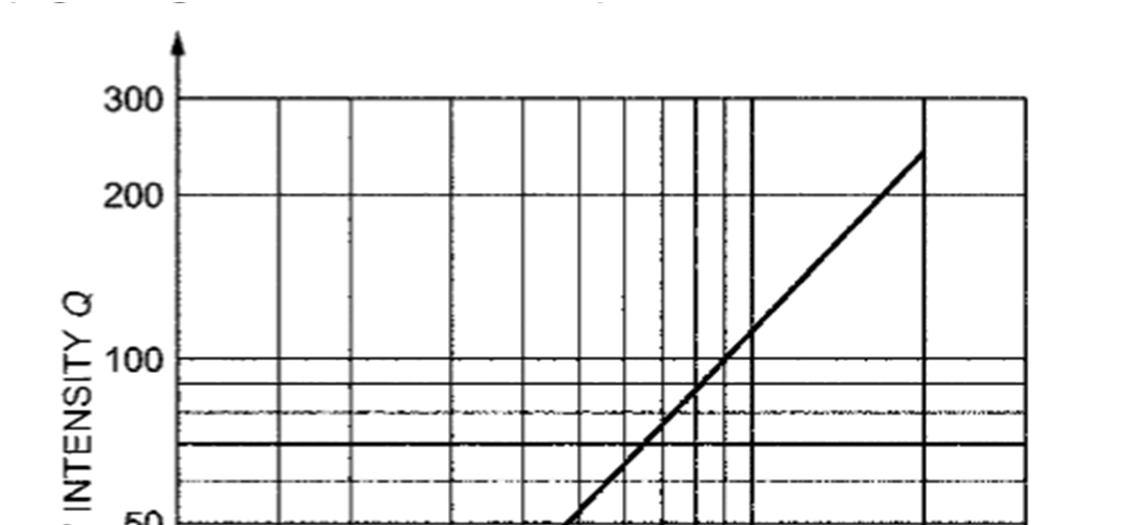
Step 8. Get the output of cooling capacity w.r.t. Temperature.
Heat Exchange Coefficient Between Surface and Space
Floor cooling: q = 7(|θS,m –θi |) = 7(24-15) = 49
Using an injection circuit requires a circulating pump to provide a constant flow of water through the floor.
Sensible heat load QS = 0.384kW = 1310.366 btu/hr
Inlet Temp. (t1) = 11°C= 51.8 °C
Outlet Temp. (t2) = 13°C= 55.4 °C
Therefore, Water Flow Rate q1= QS/((500×(t2-t1)) = 1310.366/((500×(55.4-51.8))
= 0.728 gpm = 45.93 cm3/s
Volumetric flow rate = A×L/t q1 = (π/4 x d2)×v 45.93 = (π/4 x 2.342)×v v = 10.68 cm/s
ISSN: 2321-9653; IC Value: 45.98; SJ Impact Factor: 7.538 Volume 10 Issue XII Dec 2022- Available at www.ijraset.com
And the dimensions of the radiant cooling system are:
3m height Modulated spiral Pipe length= 115 m Supply water temp= 9.6°C Velocity = 10.68 cm/s
The analysis of the efficiency and performance of our cooling system would be incomplete without the presence of a heat source that would be present in the use case scenario of the system. Hence the team set out to design a human-shaped source of heat emission to complete our test scenario. However, the designs were incapable of being meshed in the analysis stage. It was attempted using open-source externally available models but achieved little to no success. Hence it was decided to approximate the shape of a human body to a sphere (Fig 3.24) and adjust the parameters that affect heat output accordingly an were able to successfully proceed with the analysis.
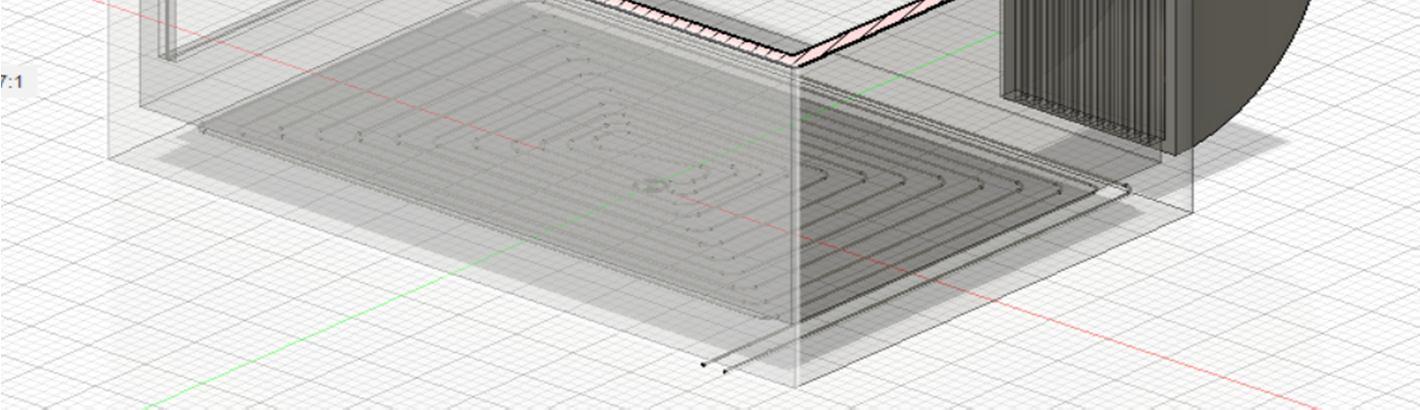
Figure .6 Room with three human spheres
ISSN: 2321-9653; IC Value: 45.98; SJ Impact Factor: 7.538 Volume 10 Issue XII Dec 2022- Available at www.ijraset.com
The parameters used were as follows:
Human shape: Sphere
Sphere Diameter = 780mm (for the average surface area of the adult human body)
Sphere Location: Arbitrary
Heat transfer coefficient = 3.4 w/m2-k
External emissivity = 0.96
Heat generation rate = 2024.875 w/m3
Body temperature: 36°C These values correspond to an average human male’s statistic.
Five separate analyses were conducted
A. Steady-state Comparison of x and k Blade Square Wind Catcher
The physical dimensions used are identical for both wind catchers. In both scenarios, the outside air temperature was 23°C and the internal temperature was 31°C and an identical temperature drop of 8°C was obtained.
Figure .8 K-Blade Wind Catcher
ISSN: 2321-9653; IC Value: 45.98; SJ Impact Factor: 7.538 Volume 10 Issue XII Dec 2022- Available at www.ijraset.com
From the analysis, a Temperature drop of 2.7 °C was observed in the room from 307.00K to 304.30K
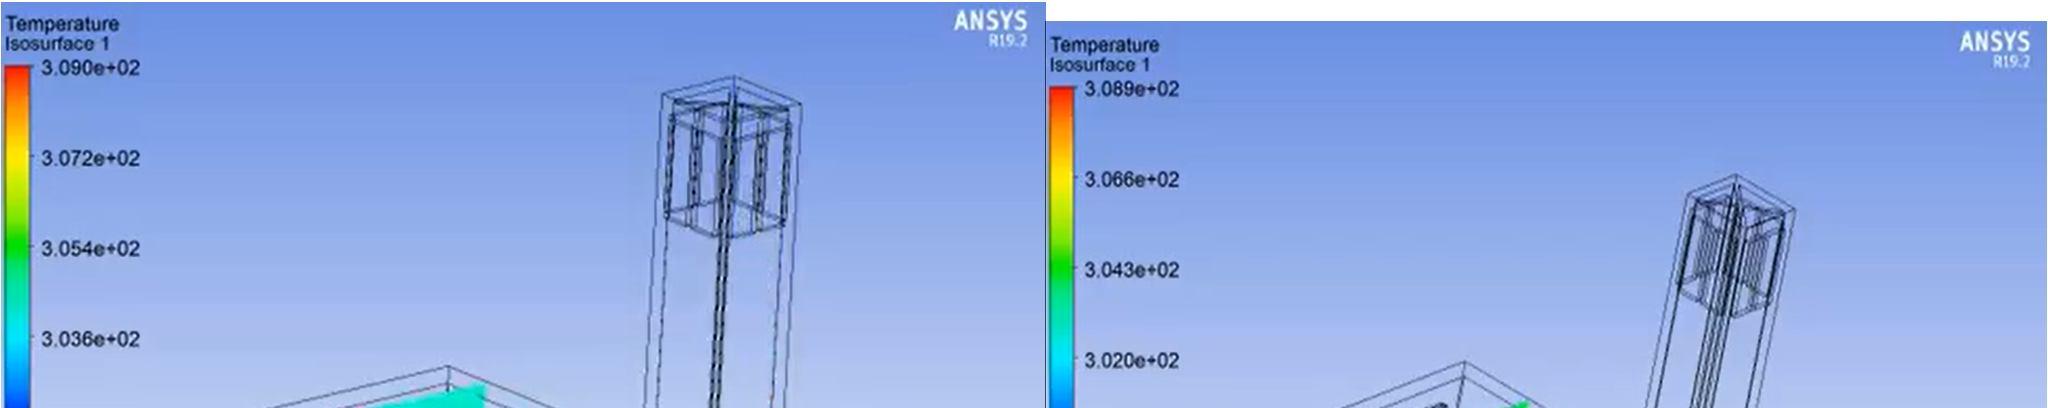
In time the temperature will decrease further. In practical use, the additional airflow provided by the wind tower will provide more cooling than the numbers might suggest.
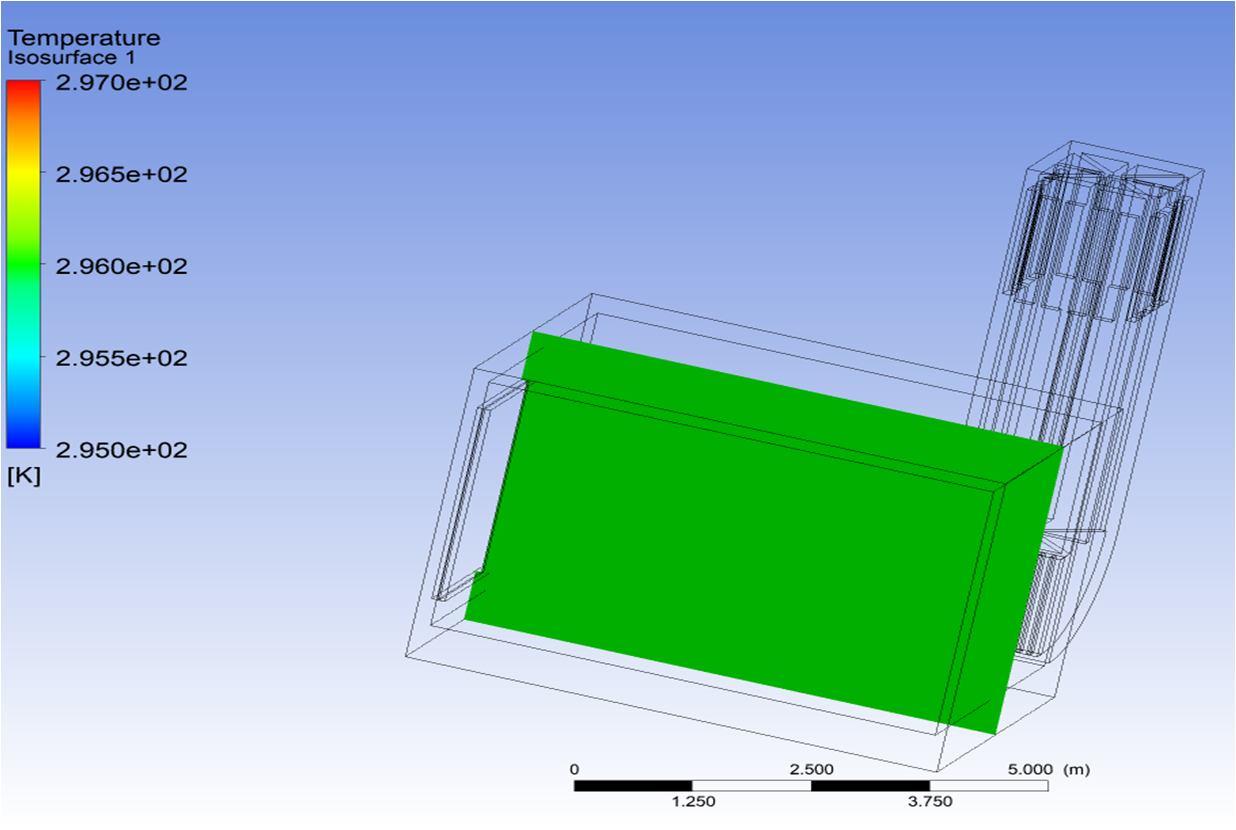
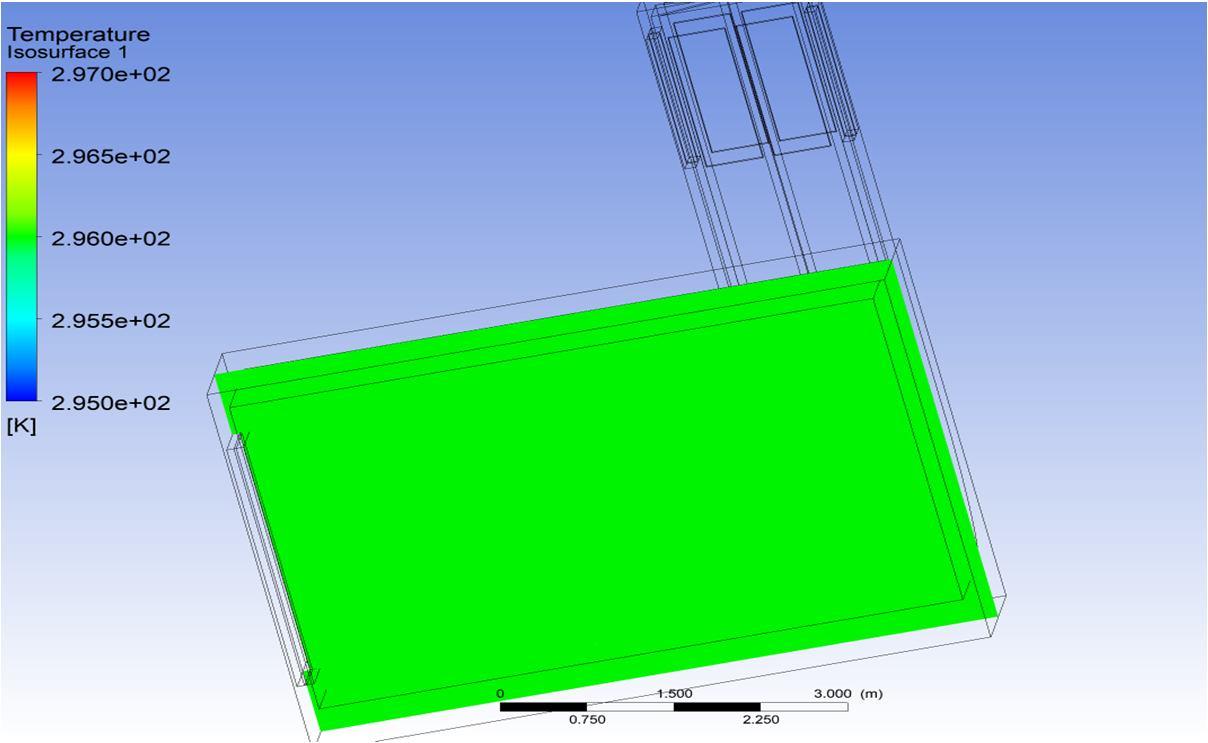
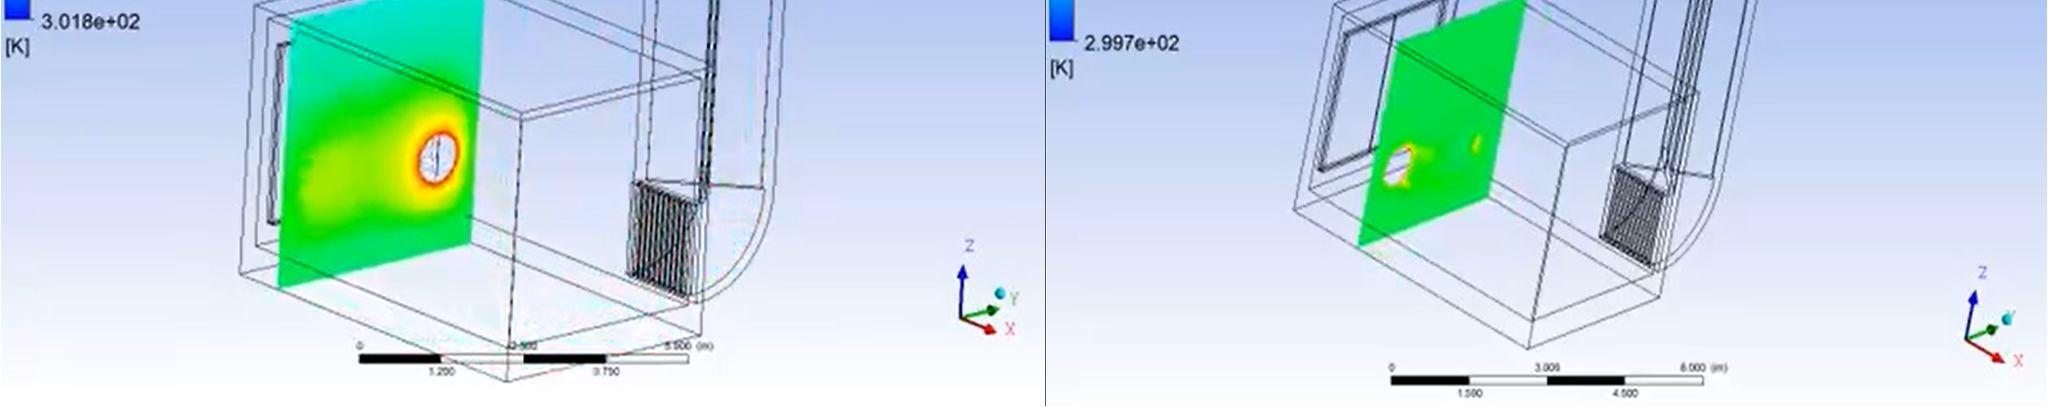
Figure .9 Steady-state Analysis of only humans radiating heat
Figure .10 Steady-state Analysis of Humans radiating heat and Wind Tower cooling the room
C. X Blade Square Wind Catcher Transient State Analysis for 3m height
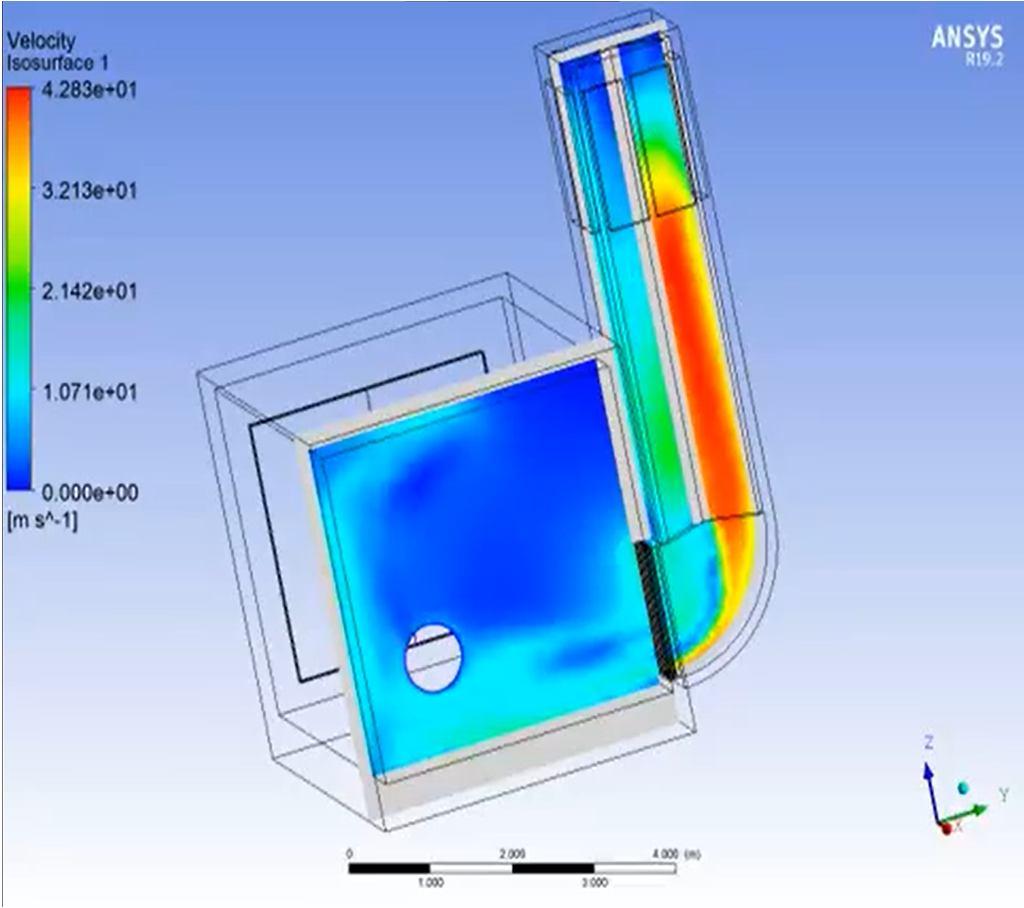
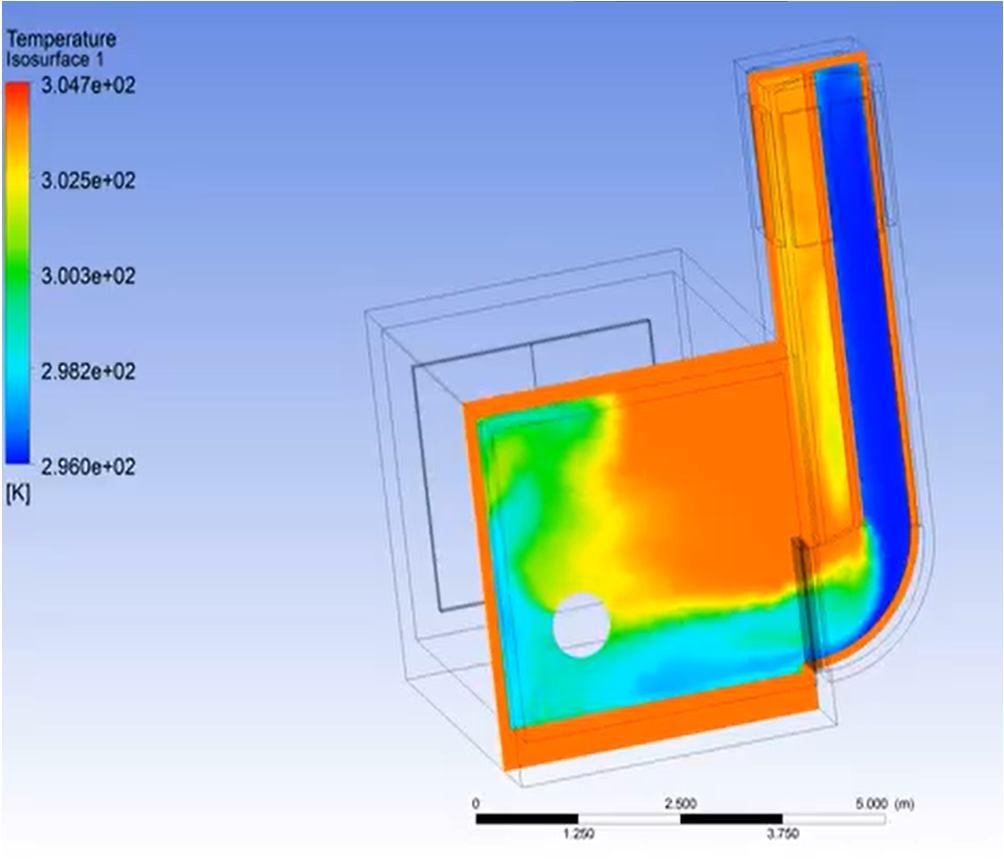
The room is filled with cool air in the first 10.5 seconds of the wind catcher’s operation. Temperature drop and velocity increase are observed wrt time.
Figure .11 Transient State Analysis of 3m Wind Catcher Velocity Profile
Figure .12 Transient State Analysis of 3m Wind Catcher Temperature Profile
ISSN: 2321-9653; IC Value: 45.98; SJ Impact Factor: 7.538 Volume 10 Issue XII Dec 2022- Available at www.ijraset.com
The room is filled with cool air in the first 9.2 seconds of the wind catcher’s operation.
Temperature drop and velocity increases are observed wrt time.
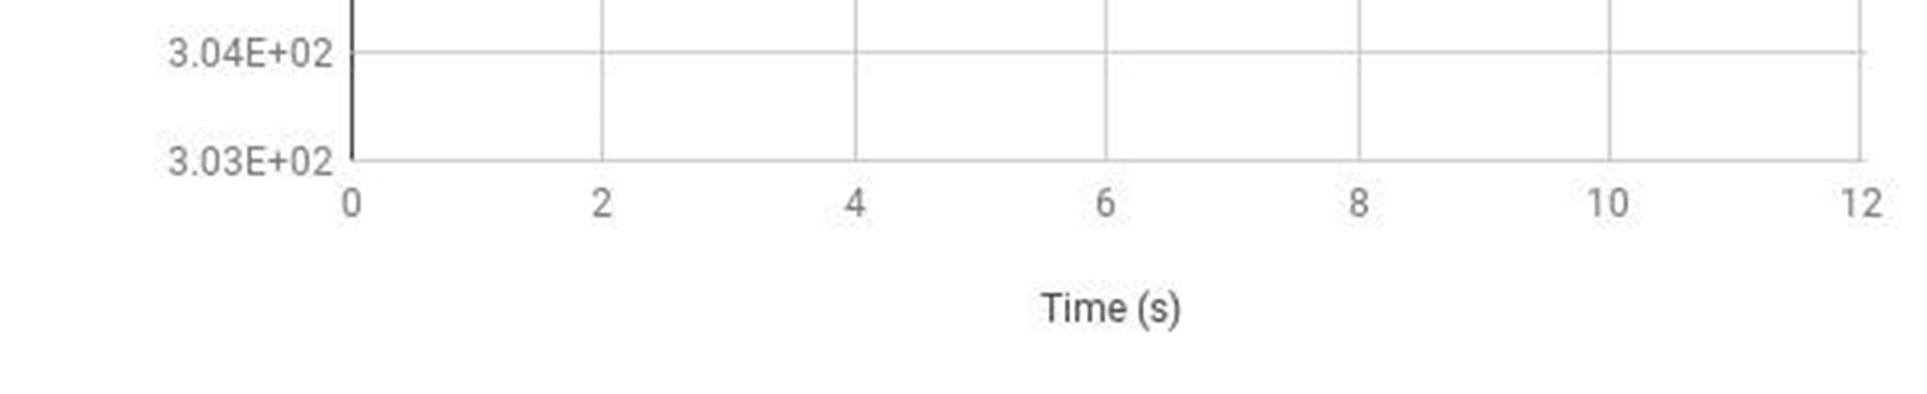
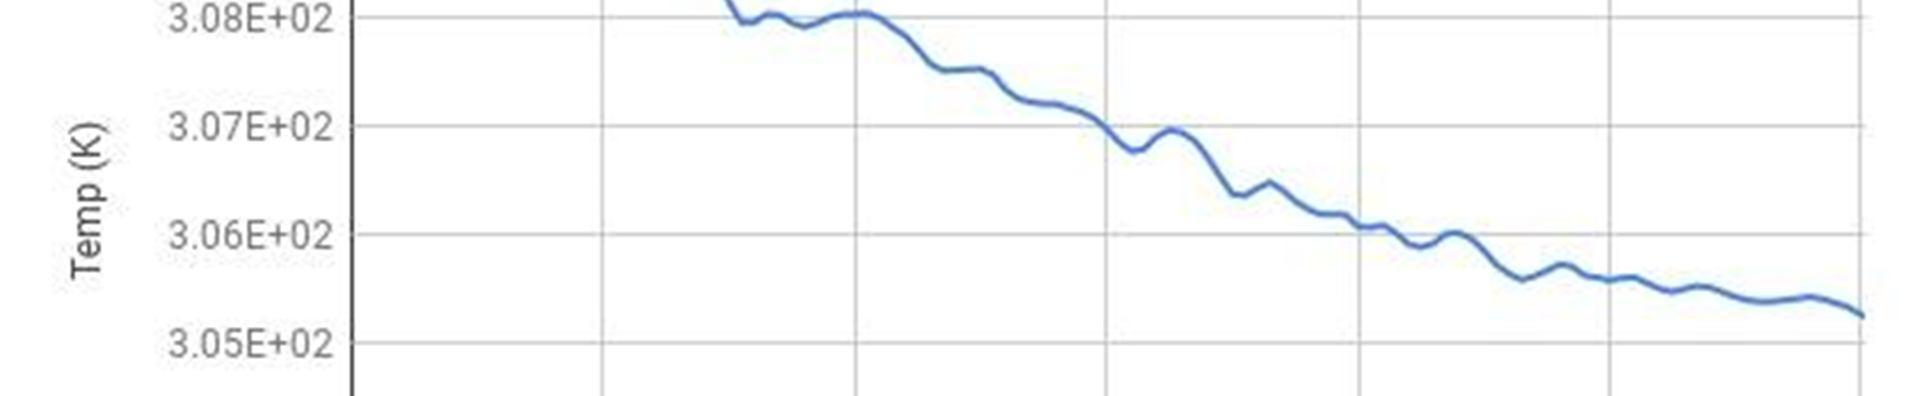
Figure SEQ Figure
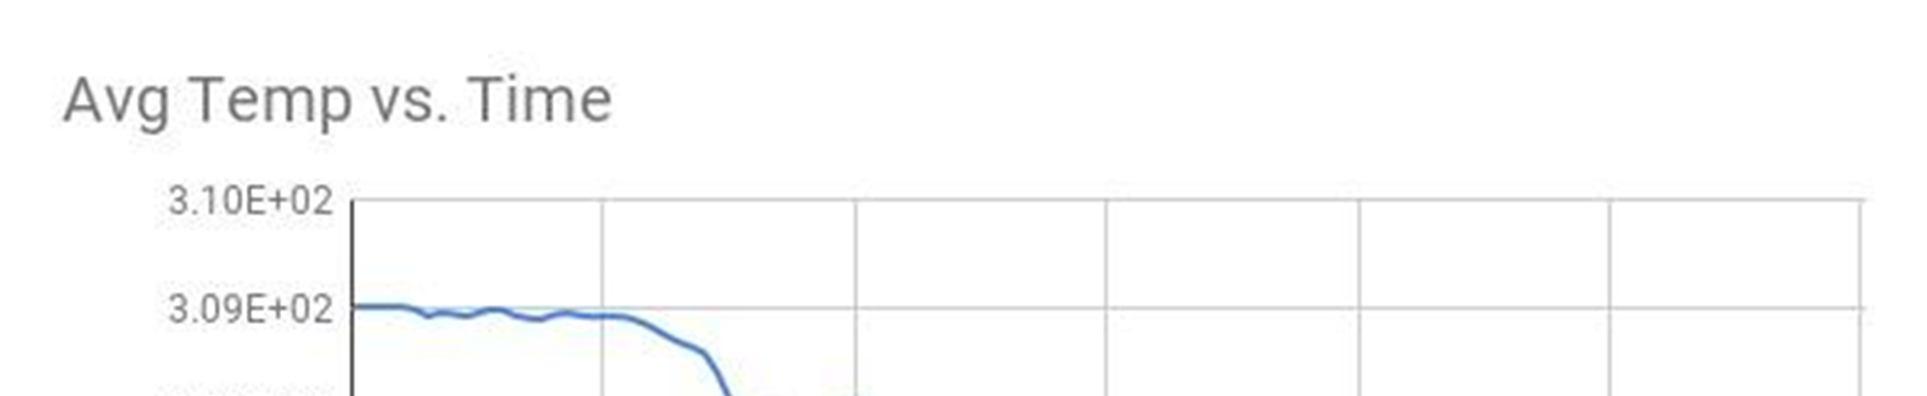
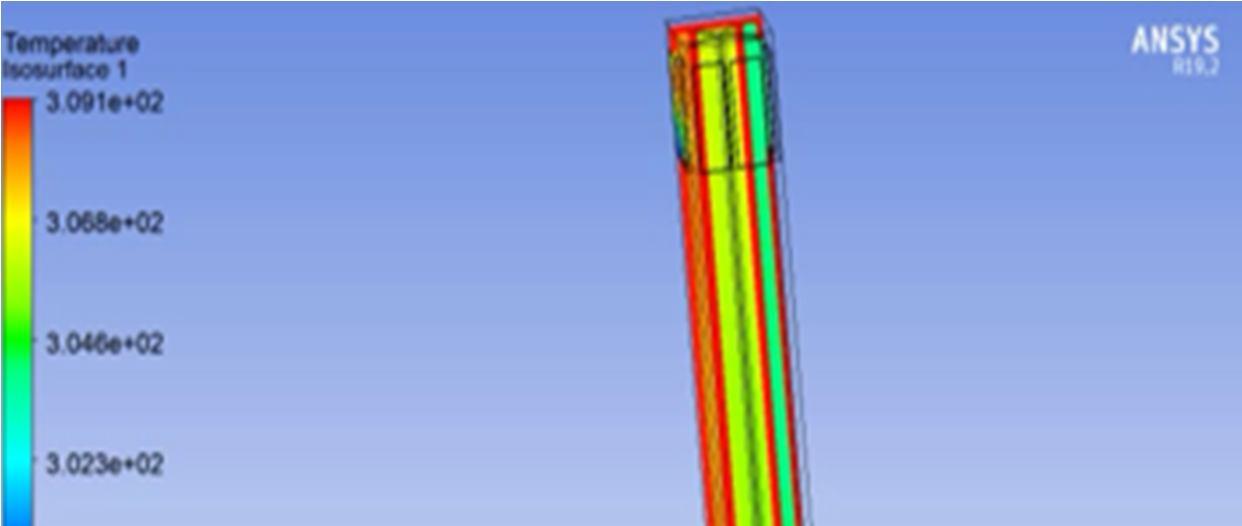
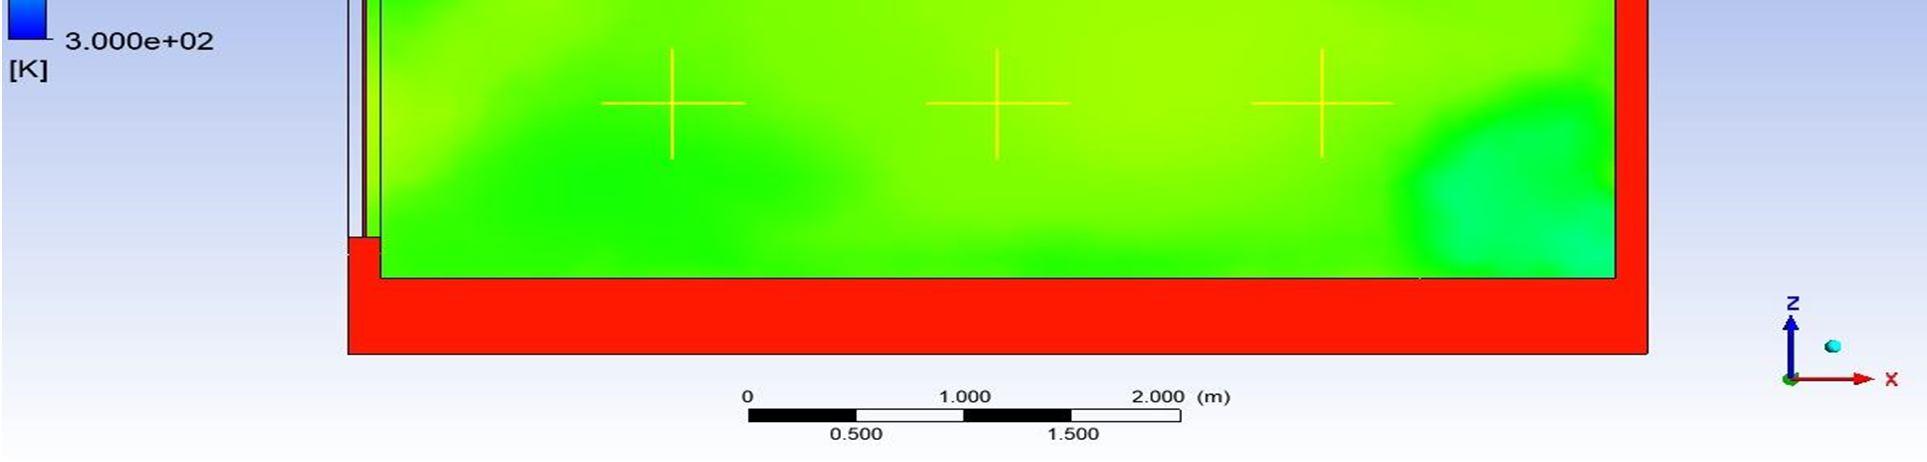
Figure 13:Transient temperature analysis for 9 m wind tower
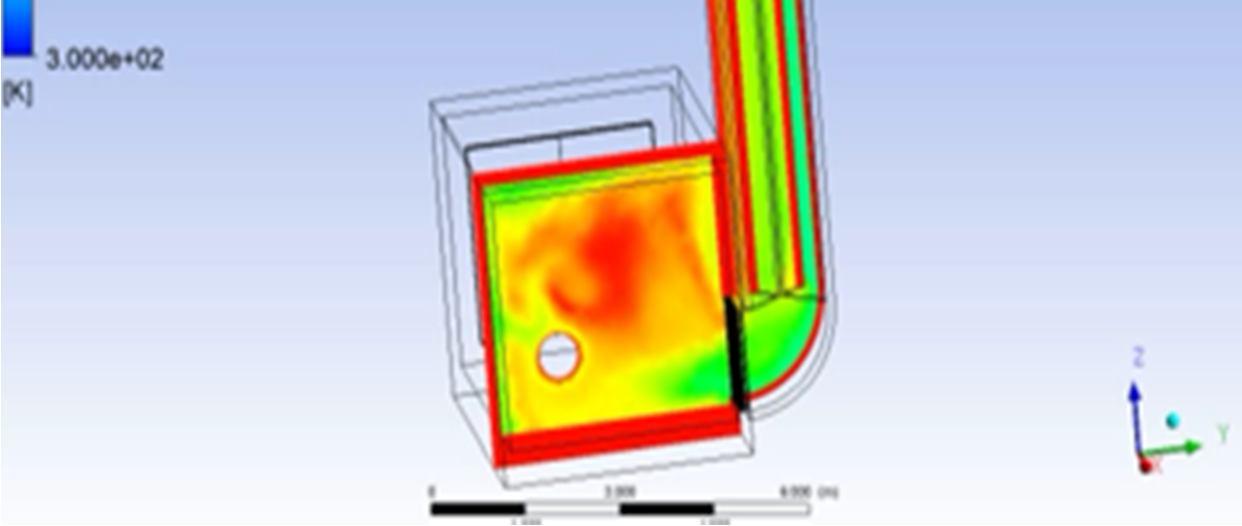
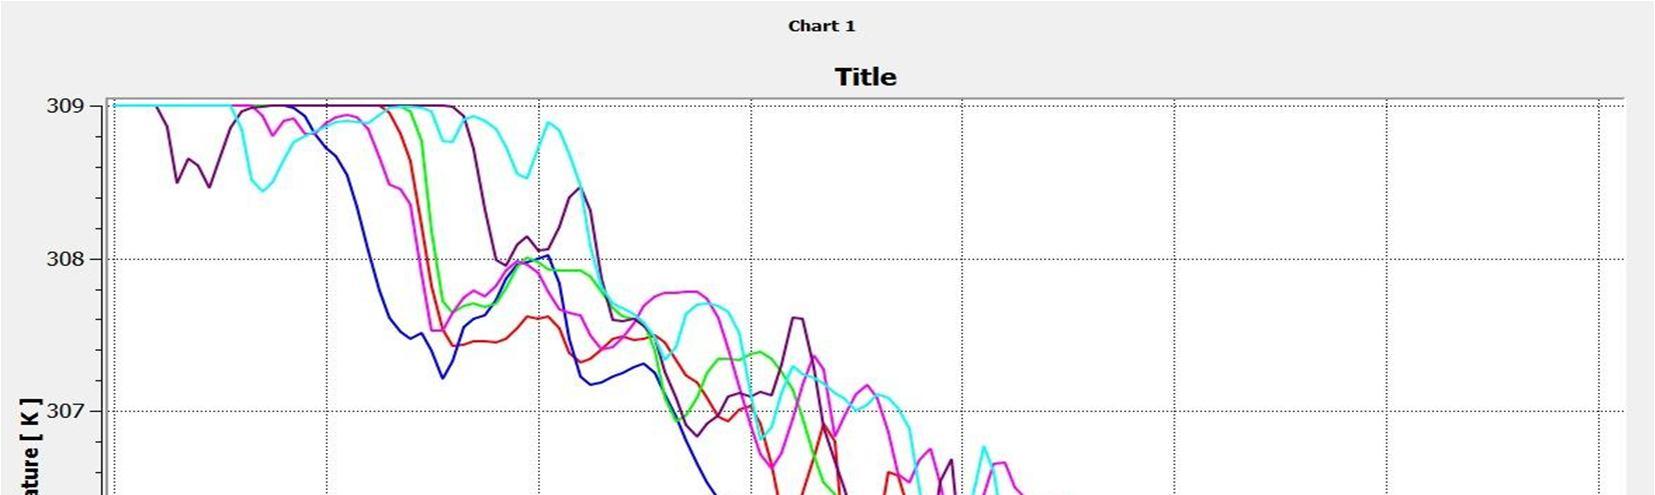
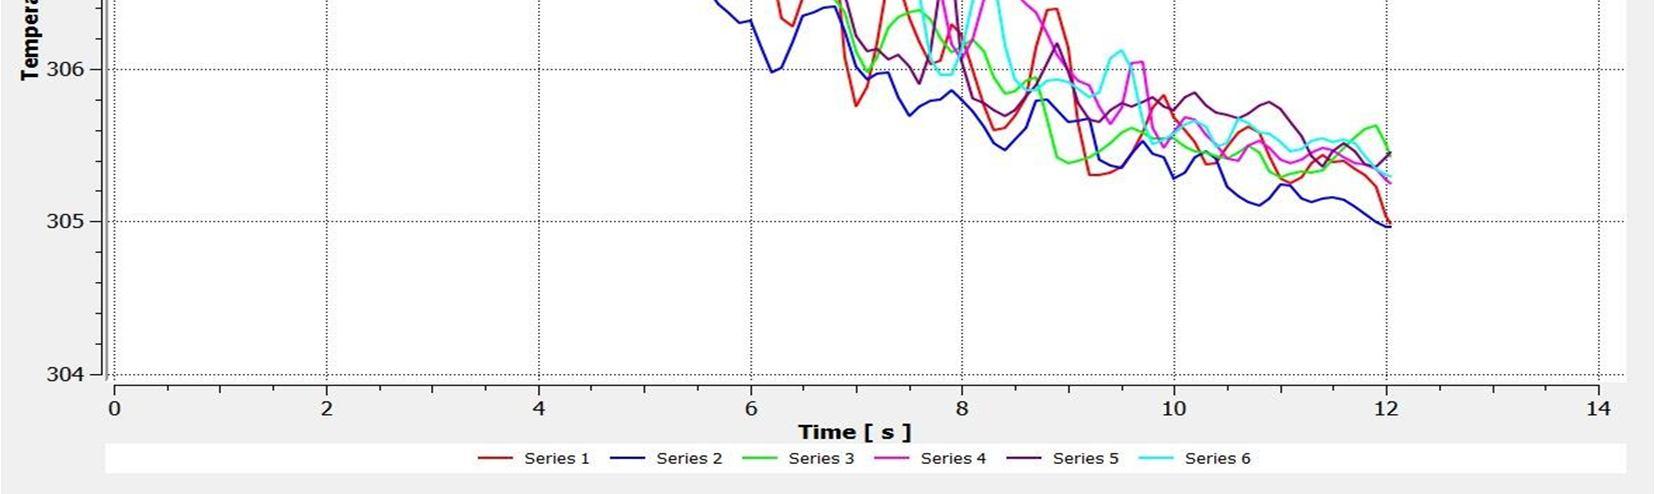
Figure 14: Temperature vs time analysis for 9m wind tower
ISSN: 2321-9653; IC Value: 45.98; SJ Impact Factor: 7.538 Volume 10 Issue XII Dec 2022- Available at www.ijraset.com
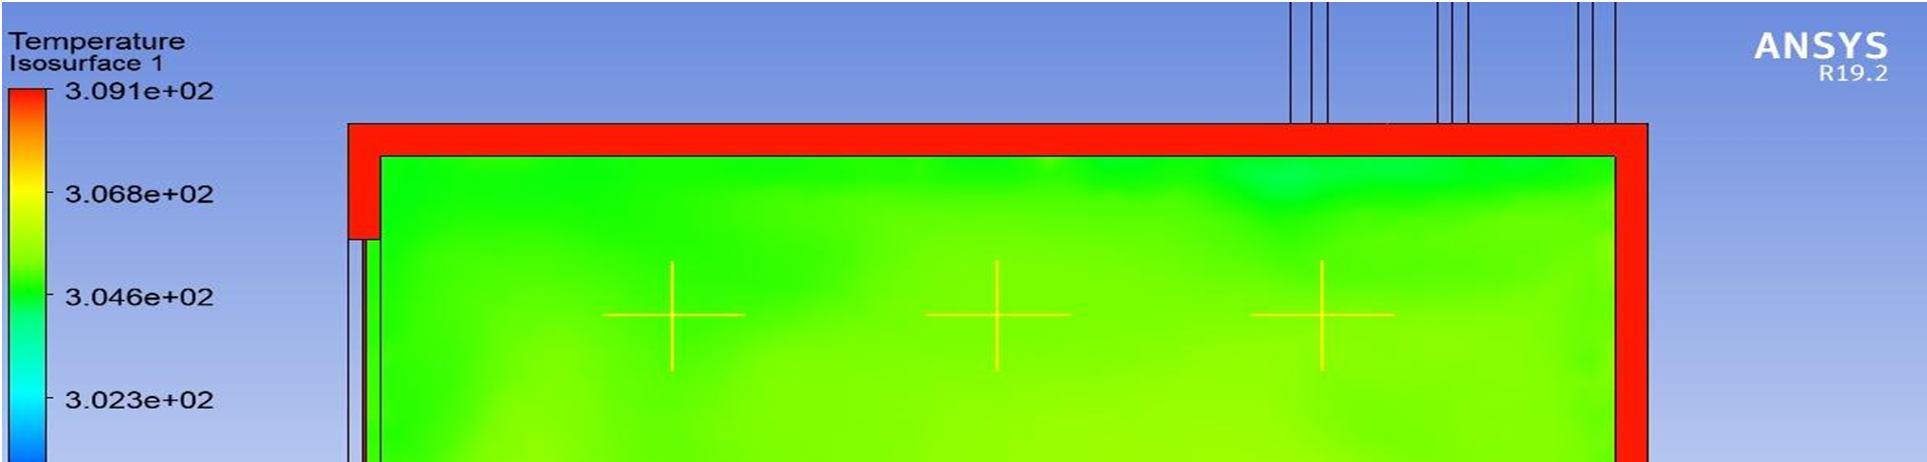
To conclude whether there is a relationship between increasing wind tower height and temperature drop, a steady-state analysis on the wind tower structure is conducted and measured the temperature at 6 separate locations inside the structure A plot of the graph of the variation of temperature with respect to time at these 6 spots was generated. The variation of temperature vs time graph is shown below.
This experiment is then repeated for all four heights of our windcatcher and plotted the temperature is with respect to their increasing heights.
ISSN: 2321-9653; IC Value: 45.98; SJ Impact Factor: 7.538
Volume 10 Issue XII Dec 2022- Available at www.ijraset.com
A. From the first analysis, it can be concluded that there is no statistical difference in performance between the x and k blade windcatcher for our experiment's climatic conditions, hence we can proceed with any design of windcatcher.
B. From the second analysis, it can be concluded that the windcatcher mechanism is a viable method of cooling for our experiment’s location and climatic conditions with sizable cooling effects.
C. From the third analysis it can be concluded that this cooling effect occurs in a short amount of time and attains equilibrium quickly.
D. From the fourth analysis, an increase in wind catcher height increases the rate of cooling, and a temperature drop is noticed, but a definite relationship between the wind tower's height and cooling effect cannot be determined.
E. From the fifth analysis it can be concluded that temperature drop and by extension cooling effect is directly proportional to wind tower height.
[1] Hindoliya, D. A., & Mullick, S. C. (2004). Direct Evaporative Cooling for Thermal Comfort in a Building in the Summer Months for Four Climatic Zones of India. SESI Journal, 14.
[2] Dnyandip K. Bhamare, Manish K. Rathod, Jyotirmay Banerjee, Passive cooling techniques for building and their applicability in different climatic zones The state of art, Energy and Buildings, Volume 198, 2019, Pages 467-490, ISSN 0378-7788.
[3] Payne, F. William, and John J. McGowan. Energy management and control systems handbook. Springer Science & Business Media, 2012.
[4] Chowdhury, Ashfaque & Rasul, Mohammad & Khan, M. Masud. (2008). Thermal-comfort analysis and simulation for various low-energy coolingtechnologies applied 66 to an office building in a subtropical climate. Applied Energy.85.449-462.
[5] American Society of Heating, Refrigerating and Air-conditioning Engineers. (2019). 2019 ASHRAE Handbook. Atlanta, Ga, American Society of Heating, Refrigerating and Air Conditioning Engineers. www.ashrae.org