10 VIII August 2022 https://doi.org/10.22214/ijraset.2022.46156
In order to perform its functions i.e. social, economic and general government needs funds that have to be garnered from a variety of sources. Revenue and Expenditure plays a very significant role to achieve the major economic goals of growth, stability, equity and efficiency. The revenue and capital receipts, revenue and capital expenditure of the state determine their ability to deliver services. Weaknesses in revenue and expenditure management could constrain the ability of a state to contribute to poverty reduction and economic development. The importance of public revenue has greatly increased during recent times. This paper reviews key trends in public spending and revenue during this period. The result indicates that the revenue and expenditure of the state government increases from 17% to 23% during study period.
A. To analyze the growth in the revenue and capital receipt of state government from 200001 to 201617
The study covers the period 2000 01 to 2016 17 and base on secondary data, which is collected from various issues of statistical diary of Uttarakhand and from budgetary analysis of state revenue and expenditure (NITI Ayog) government of India. The research tools and concepts used for the study include simple percentage, compound growth rate etc.
Key words: Revenue receipt, Capital receipt, Revenue expenditure, Capital expenditure I. INTRODUCTION
Dr. Kailash Bharti Goswami Assistant Professor, Department of Economics, Leh Campus, University of Ladakh
International Journal for Research in Applied Science & Engineering Technology (IJRASET) ISSN: 2321 9653; IC Value: 45.98; SJ Impact Factor: 7.538 Volume 10 Issue VIII Aug 2022 Available at www.ijraset.com 235©IJRASET: All Rights are Reserved | SJ Impact Factor 7.538 | ISRA Journal Impact Factor 7.894 |
An Analysis of Growth and Pattern of Revenue and Expenditure in the State of Uttarakhand
Abstract: The focus of the paper is to examine trends and growth in state government revenue and expenditures in Uttarakhand.
B. To analyze the growth in the revenue and capital expenditure of state government from 200001 to 201617
II. OBJECTIVES OF THE STUDY
III. RESEARCH METHODLOGY
Fiscal policy plays an important part in achieving macroeconomic balance. The adequate fiscal policy has been seen as a necessary instrument used to achieve sustainable growth, price stability and increase in employment in any economy. Public finance is a field of economics concerned with how a government raises money, how that money is spent and the effects of these activities on the economy and society, It studies how government at state and local, provide the public with desired services and how they secure the financial resources to pay for these services. Public finance deals with the finances of public bodies for the performance of their functions. The performance of these functions leads to expenditure. The expenditure is incurred from funds raised through taxes, fees, sale of goods and services and loans. The different sources constitute the revenue of the public authorities. Public finance studies the manner in which revenue is raised; the expenditure is incurred upon different items etc. The state of Uttarakhand has its own receipts but these receipts are very low to meet the expenditure, so the union government gives special category status to state. Due to special status, the state government gets maximum receipts from union government. The receipts of the state broadly categorized into revenue and capital receipts. Revenue receipts are the income generated from the operating activities of the business, which don’t create additional assets while capital receipts are the income generated from investment and financing activities of the business, which create physical or financial assets. Both revenue and capital receipts plays a vital role in the state economy. Uttarakhand is one of the fastest growing states of the India. The State’s economy grew at an annual growth rate of over 10 percent during the last decade. In terms of economic growth, the state’s performance has been above the national average. Karnataka has made notable progress in all sectors during the course of the 11th Plan. As far as overall growth is concerned, the increase in State Income has been satisfactory. When these receipts are used for the growth and development of economy and expends on different sectors. When some expenditure is incurred for the sake of generation of revenue in the current year, this is revenue expenditure. This type of expenditure doesn’t create any productive assets


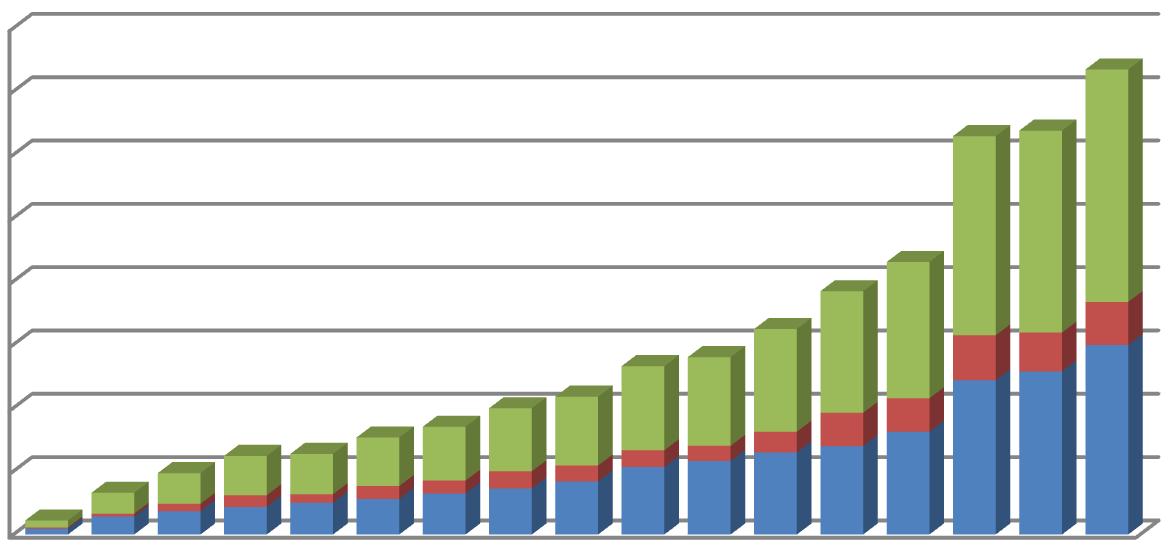
International Journal for Research in Applied Science & Engineering Technology (IJRASET) ISSN: 2321 9653; IC Value: 45.98; SJ Impact Factor: 7.538 Volume 10 Issue VIII Aug 2022 Available at www.ijraset.com 236©IJRASET: All Rights are Reserved | SJ Impact Factor 7.538 | ISRA Journal Impact Factor 7.894 | IV. DATA ANALYSIS & INTERPRETATION Table 1: Total Receipts of the State Government of Uttarakhand Year Revenue Receipts Capital Receipts Total Receipts % (Rs. crore) % (Rs. crore) % (Rs. crore) 2000 2001 66.5 924 33.5 465 100 1389 2001 2002 63.8 2733 36.2 1546 100 4279 2002 2003 61.8 3218 38.2 1983 100 5201 2003 2004 59.9 3600 40.1 2404 100 6004 2004 2005 64.7 4086 35.3 2231 100 6313 2005 2006 69.4 5537 30.6 2445 100 7982 2006 2007 86.8 7373 13.2 1120 100 8493 2007 2008 81.6 7891 18.4 1782 100 9673 2008 2009 84.6 8635 15.4 1568 100 10203 2009 2010 70.4 9486 29.6 3989 100 13475 2010 2011 74 11608 26 4069 100 15667 2011 2012 83.8 13691 16.2 2638 100 16329 2012 2013 78.8 15747 21.2 4233 100 19980 2013 2014 78.7 17321 21.3 4691 100 22012 2014 2015 76.4 20247 23.6 6240 100 26487 2015 2016 79 26013 21 6932 100 32945 2016 2017 81.5 32276 18.5 7336 100 39612 Source: Uttarakhand Public Finance Statistics various issues Table 1 shows the amount of total receipts, revenue receipts and capital receipts of the state government of Uttarakhand. Figure 1 exhibits that total receipts, revenue receipts and capital receipts of the state government of Uttarakhand are showing an increasing trend. Total receipts of the state government of Uttarakhand have been continuously increasing since 2000 01. The total receipts of state government in 2000 01 was ₨ 1389 crore in which the share of revenue receipts was 66.5% and share of capital receipts was 33.5%. The total receipts showed an increasing trend and reached to the line of Rs 9697 crore in 2007 08 from Rs 1389 crore in 2000 01. It showed further increasing trend and reached Rs 39612 crore in 2016 17. Table 2 shows that during 2000 01 to 2007 08, the total receipts of the state government increased at the rate of 27% per annum. From 2008 09 to 2016 17 the total receipts increased at the rate of 16% per annum and during the study period it increases 21% per annum. Along with the increase in total receipts of the state government of Uttarakhand, the revenue receipts of the state government have also witnessed a rise. Such receipts increased from Rs 924 crore in 2000 01 to Rs 7891 crore in 2007 08. The total receipts increases by 27% from 2000 01 to 2007 08. It constituted 66.5% in 2000 01 of the total receipts of the state government (as shown in Table 1). This percentage declined to 59.9% in 2003 04. The share of revenue receipts in total receipts increased to 86.6% in 2006 07, which reached at highest level, after onwards there were shown fluctuations in revenue receipts. It has been fluctuating from 70% to 85%. The revenue receipts of the state government increased at the rate of 30% per annum from 2000 01 to 2007 08. From 2008 09 to 2016 17 the total receipts increased at the rate of 15% per annum and during the study period it increases 23% per annum.
International Journal for Research in Applied Science & Engineering Technology (IJRASET) ISSN: 2321 9653; IC Value: 45.98; SJ Impact Factor: 7.538 Volume 10 Issue VIII Aug 2022 Available at www.ijraset.com 237©IJRASET: All Rights are Reserved | SJ Impact Factor 7.538 | ISRA Journal Impact Factor 7.894 | Figure 1: Trends in Revenue, Capital and Total Receipts of the State Government of Uttarakhand
Year 2000 01 to 2007 08 2008 09 to 2016 17 2000 01 to 2016 17 Total Receipts 27 16 21 Revenue Receipts 30 15 23 Capital Receipts 18 18 17 Note: As in Table 1 Source: Computed on the basis of data compiled from various issues of Uttarakhand Public Finance Statistics Looking at capital receipts as a proportion of total receipts of the state government, the share of capital receipts showed a fluctuating trend. Table 3: Total Expenditure of the State Government of Uttarakhand Year Revenue Expenditure Capital Expenditure Total Expenditure % (Rs. crore) % (Rs. crore) % (Rs. crore) 2000 2001 82.2 914 17.8 197 100 1111 2001 2002 85.9 2833 14.1 465 100 3298 2002 2003 75.8 3676 24.2 1173 100 4849 2003 2004 70.3 4362 29.7 1845 100 6207 2004 2005 79.1 5036 20.9 1330 100 6366 2005 2006 73.2 5611 26.8 2053 100 7664 2006 2007 76 6477 24 2039 100 8516 2007 2008 72.7 7255 27.3 2720 100 9975 450004000035000300002500020000150001000050000 Revenue receipts Capital Receipts Total Receipts
Source: Computed on the basis of Uttarakhand Finance
Public
The capital receipts of the state government increased from Rs 465 crore in 2000 01 to Rs 2445 crore in 2005 06 mainly because of larger market borrowings, state and public provident funds. It further moved up to Rs 4069 crore in 2010 11 and further declined to Rs 2638 crore in 2011 12. The capital receipts of the state government increased at the rate of 18% per annum from 2000 01 to 2007 08. From 2008 09 to 2016 17 the total receipts increased at the rate of 18% per annum and during the study period it increases 17% per annum. of the State Government of Uttarakhand (%)
Table 2: Compound Growth Rates of Receipts
Statistics
data compiled from various issues of
The share of capital receipts in total receipts was 36.2% 2001 02. This percentage rose to 40.1% in 2003 04 and in 2006 07 it declined to 13.1%.
International Journal for Research in Applied Science & Engineering Technology (IJRASET) ISSN: 2321 9653; IC Value: 45.98; SJ Impact Factor: 7.538 Volume 10 Issue VIII Aug 2022 Available at www.ijraset.com 238©IJRASET: All Rights are Reserved | SJ Impact Factor 7.538 | ISRA Journal Impact Factor 7.894 | 2008 2009 77.1 8395 22.9 2493 100 10888 2009 2010 80.1 10657 19.9 2640 100 13297 2010 2011 83 11621 17 2389 100 14010 2011 2012 79.9 12975 20.1 3257 100 16232 2012 2013 72.6 13960 27.4 5256 100 19216 2013 2014 75.3 16216 24.7 5307 100 21523 2014 2015 77.4 24352 22.6 7107 100 31459 2015 2016 80.7 25739 19.3 6154 100 31893 2016 2017 81.5 29918 18.5 6809 100 36727
Source: Uttarakhand Finance
Table 3 shows the amount of total expenditure, revenue expenditure and capital expenditure of the state government of Uttarakhand.
The total expenditure showed an increasing trend and reached to the line of Rs 9975 crore in 2007 08 from Rs 1111crore in 2000 01. It showed further increasing trend and reached Rs 36727 crore in 2016 17. Table 4 shows that during 2000 01 to 2007 08, the total expenditure of the state government increased at the rate of 31% per annum. From 2008 09 to 2016 17 the total expenditure increased at the rate of 14% per annum and during the study period it increases 22% per annum. Along with the increase in total expenditure of the state government of Uttarakhand, the revenue expenditure of the state government has also witnessed a rise. Such expenditure increased from Rs 914 crore in 2000 01 to Rs 7255 crore in 2007 08. It constituted 85.9% in 2001 02 of the total expenditure of the state government (as shown in Table 1). This percentage declined to 72.7% in 2007 08. The share of revenue expenditure in total expenditure increased to 83% in 2010 11, which reached at highest level, after onwards there were shown fluctuations in revenue receipts. It has been fluctuating from 70% to 80%. The revenue expenditure of the state government increased at the rate of 31% per annum from 2000 01 to 2007 08. From 2008 09 to 2016 17 the revenue expenditure increased at the rate of 11% per annum and during the study period it increases 22% per annum ( as in Table 4)
80000700006000050000400003000020000100000
2000-2001 2001-2002 2002-2003 2003-2004 2004-2005 2005-2006 2006-2007 2007-2008 2008-2009 2009-2010 2010-2011 2011-2012 2012-2013 2013-2014 2014-2015 2015-2016 2016-2017 Total RevenueCapitalExpenditureExpenditureExpenditure
Public
Statistics various issues
Figure 2 exhibits that total expenditure, revenue expenditure and capital expenditure of the state government of Uttarakhand are showing an increasing trend. Total expenditure of the state government of Uttarakhand has been continuously increasing since 2000 01. The total expenditure of state government in 2000 01 was ₨ 1111 crore in which the share of revenue expenditure was 82.2% and share of capital expenditure was 17.8%.
Source: Computed on the basis of data compiled from various issues of Uttarakhand Public Finance Statistics The share of capital expenditure in total expenditure was 17.8% in 2001 02. This percentage rose to 27.3% in 2007 08 and in 2010 11 it declined to 17%. The capital expenditure of the state government increased from Rs 465 crore in 2000 01 to Rs 2445 crore in 2005 06. It further moved up to Rs 2720 crore in 2007 08 and further declined to Rs 2389 crore in 2010 11.
Figure 2: Trends in Revenue, Capital and Total Expenditure of the State Government of Uttarakhand
International Journal for Research in Applied Science & Engineering Technology (IJRASET) ISSN: 2321 9653; IC Value: 45.98; SJ Impact Factor: 7.538 Volume 10 Issue VIII Aug 2022 Available at www.ijraset.com 239©IJRASET: All Rights are Reserved | SJ Impact Factor 7.538 | ISRA Journal Impact Factor 7.894 | The capital expenditure of the state government increased at the rate of 38% per annum from 2000 01 to 2007 08. From 2008 09 to 2016 17 the capital expenditure increased at the rate of 15% per annum and during the study period it increases 23% per annum ( as in Table 4). Table 4: Compound Growth Rates of Expenditure of the State Government of Uttarakhand (%) Year 2000 01 to 2007 08 2008 09 to 2016 17 2000 01 to 2016 17 Total Expenditure 31 14 22 Revenue Expenditure 29 11 22 Capital Expenditure 38 15 23 Note: As in Table 2 Source: Computed on the basis of data compiled from various issues of Uttarakhand Public Finance Statistics Table 4 shows that during 2000 01 to 2007 08, the total expenditure of the state government increased at the rate of 31% per annum. From 2008 09 to 2016 17 the total expenditure increased at the rate of 14% per annum and during the study period it increases 22% per annum. The revenue expenditure and capital expenditure during 2000 01 to 2007 08, 2008 09 to 2016 17 and 2000 01 to 2016 17 increased at the rate of 29%, 11%, 22% and 38%, 15%, 23% respectively in the state of Uttarakhand. Table 5: Difference in Total Revenue & Expenditure of the State Government of Uttarakhand Year Total Revenue Total Expenditure Difference 2000 2001 1389 1111 278 2001 2002 4279 3298 981 2002 2003 5201 4849 352 2003 2004 6004 6207 207 2004 2005 6313 6366 53 2005 2006 7982 7664 318 2006 2007 8493 8516 23 2007 2008 9673 9975 302 2008 2009 10203 10888 685 2009 2010 13475 13297 178 2010 2011 15667 14010 1657 2011 2012 16329 16232 97 2012 2013 19980 19216 764 2013 2014 22012 21523 489 2014 2015 26487 31459 4972 2015 2016 32945 31893 1052 2016 2017 39612 36727 2885
REFERENCES
[3]
Source: Computed on the basis of data compiled from various issues of Uttarakhand Public Finance Statistics
[1] Ernest, Kurnow, "Determinants of State and Local Expenditure, Reexamined", National ,Jou_J_~1, Vol.XV1, pp.252 254 [2] Gangal and Gupta, “Public Expenditures and Economic Growth A Case Study of India”, Global Journal of Management and Business Studies, Vol.3, No.2, 2013, pp.191 196 Martin, A. and Arthur Lewis, A.W., "Pattern of Public Revenue and Expenditure", The Manchester School of Economic and Social Studies, Vol. XXIV, 1956, pp.102 [4] Niti Ayoug [5] Reserve Bank of India:”State Finances A Study of Budgets”, RBI Bulletin various issues”. [6] www.rbi.org.in Revenue Total Expenditure
Table 5 shows the difference in total revenue and total expenditure in the economy of Uttarakhand during study period. The trend shows that only some financial years has more expenditure than revenue. In figure 3 the trend line of total revenue and total expenditure coincide with each other, this shows that there is balance in revenue and expenditure in the state of Uttarakhand.
450004000035000300002500020000150001000050000 Total
International Journal for Research in Applied Science & Engineering Technology (IJRASET) ISSN: 2321 9653; IC Value: 45.98; SJ Impact Factor: 7.538 Volume 10 Issue VIII Aug 2022 Available at www.ijraset.com 240©IJRASET: All Rights are Reserved | SJ Impact Factor 7.538 | ISRA Journal Impact Factor 7.894 | Figure 3: Trends in Total Revenue & Total Expenditure of the State Government of Uttarakhand