
10 VIII August 2022 https://doi.org/10.22214/ijraset.2022.46303

Keywords: Goods and Services Tax (GST), Awareness, Perceptions.
City
Consumers
Mr. Chittibabu C1, Mr. Arun Kumar B.C Assistant professor, Department of Commerce, Silicon City College of Management and commerce Affiliated to Bangalore University, Bengaluru Assistant professor, Department of Commerce, SJB College of Management Studies Affiliated to Bangalore University, Bengaluru
On July 1st 2017, the Goods and Services Tax implemented in India But, the process of implementing the new tax regime commenced a long time ago. In 2000, Atal Bihari Vajpayee, then Prime Minister of India, set up a committee to draft the GST law. In 2004, a task force concluded that the new tax structure should put in place to enhance the tax regime at the time. In 2006, Finance Minister proposed the introduction of GST from 1st April 2010 and in 2011 the Constitution Amendment Bill passed to enable the introduction of the GST law. In 2012, the Standing Committee started discussions about GST, and tabled its report on GST a year later. In 2014, the new Finance Minister at the time, Arun Jaitley, reintroduced the GST bill in Parliament and passed the bill in Lok Sabha in 2015. Yet, the implementation of the law delayed as it was not passed in Rajya Sabha. GST went live in 2016, and the amended model GST law passed in both the house. The President of India also gave assent. In 2017 the passing of 4 supplementary GST Bills in Lok Sabha as well as the approval of the same by the Cabinet Rajya Sabha then passed 4 supplementary GST Bills and the new tax regime implemented on 1st July 2017.
A. History of GST
Study
A on Awareness and Perception of towards GST Restaurants in Bengaluru
Abstract: In India different kind of indirect taxes applied on goods and services by central and state government like Sales tax, VAT, Service tax, excise duty, entry tax etc., In the year 2017 Goods and Services Tax (GST) implemented all over the country with an intention of one nation, one tax and one market. The GST subsumed all the indirect taxes including taxes levied in restaurants like service tax, VAT etc. Taxes levied on services is a major contributor to government revenue. GST implementation has made an impact on consumers who pay taxes on services provided by restaurants. The objective of the study is to find out the level of awareness and perception of consumers on GST in restaurants. The study used descriptive research design. A sample of 100 consumers from different restaurants were randomly taken from the Bengaluru city. Both Primary and Secondary sources were used within the study. Data collected were analyzed by using frequency and percentages and findings are interpreted accordingly.
B. Meaning of Goods and Service Tax (GST)
2
Clauses 366 (12A) of the constitution Bill defines GST as ― goods and service tax means any tax on supply of goods, or services or both except taxes on the supply of the liquor for human consumption. Further the clause 366 (26A) of the Bill defines Services means anything other than Goods. Thus, it can be said that GST is a comprehensive tax levy on manufacture, sale and consumption of goods and services at a national Therelevel are 3 types of GST, CGST collected by Central Govt., SGST collected by State Govt. and IGST for interstate transaction. GST will remove cascading tax effects. ‘Cascading tax effect’ means tax on tax i.e. a consumer has to pay tax on tax.
The tax system in India classified in two, namely Direct and Indirect taxes. Direct taxes are those taxes which are directly paid by individuals to Govt (income tax, Wealth tax, corporate tax) and indirect taxes are taxes on goods and services (Central and state sales tax, Custom duties, Value added taxes, excise duty etc.).
with Special Reference to
I. INTRODUCTION
2 1
International Journal for Research in Applied Science & Engineering Technology (IJRASET) ISSN: 2321 9653; IC Value: 45.98; SJ Impact Factor: 7.538 Volume 10 Issue VIII August 2022 Available at www.ijraset.com 945©IJRASET: All Rights are Reserved | SJ Impact Factor 7.538 | ISRA Journal Impact Factor 7.894 |


1) To study the awareness level of consumers towards the GST in Restaurants.
II. REVIEW
The Goods and Services Tax was introduced to promote equitable distribution of tax revenue between the authorities and clear any confusion pertaining to the various indirect taxes, among other things. Since 2017, only three forms of Goods and Services Tax have been charged to the parties involved in trading a particular product or service, namely CGST, SGST, and IGST. OF LITERATURE
Most of the consumers are unaware of GST applicability and rates on various goods and services and also, they are confused with tax rates charges on the food, beverages and services in the different restaurants. Not only that some of the restaurants are charging different rate of GST on their food, beverages and services when comparing with other restaurants, which resulting in restaurants fooling the customers by charging high rate or different rate of GST.
5) (Krishan Kumar, 2017), in this study “A Study on Customers Perception towards GST (Goods& Service Tax)”, focuses on Analysis customers perception regarding Goods and Service Tax (GST)and to find out the perception and their views on new implemented taxation system. This study highlighted the overall overview of GST. Good understanding among customers is important as it can generate a positive perception towards taxation policy.
International Journal for Research in Applied Science & Engineering Technology (IJRASET) ISSN: 2321 9653; IC Value: 45.98; SJ Impact Factor: 7.538 Volume 10 Issue VIII August 2022 Available at www.ijraset.com 946©IJRASET: All Rights are Reserved | SJ Impact Factor 7.538 | ISRA Journal Impact Factor 7.894 | C. GST Restaurant Bill
6) (Dr Sandip S Tapkir & Ms Jyoti Peswani, 2019), In this study, “A Review of GST effect on the Food consumers in the Restaurant with in the Pune City.”, understand the concept of Goods & Service tax and to obtain a comprehensive overview of consumer’s awareness and perceptions of GST. 83% responded that they are aware about GST and 17% said that they have at least some idea about GST. 80% of the respondents believed that the introduction of GST has no impact on their frequency of eating out and 20% stated that it has impacted their frequency of eating out
3) (Nitin Kumar, 2020), In this study “Customers Perception towards GST (Good & Service Tax) in Distt Jind, Haryana (India)” several identifiable variables were selected concerning tax knowledge, tax morale, tax compliance. Using questionnaire as a research instrument, 50 sets of questionnaires had been distributed. Multiple regression analysis was used to test cause of relationship among tax knowledge, tax morale, and tax compliance with tax payer's awareness on GST. This study highlighted the overall overview of GST in Jind Area of Haryana.
these restaurants
2) (Abilash & D, 2021), In their study “A Study on Public Awareness towards Goods and Service Tax with Special Reference to Coimbatore City” The study focuses on measure the level of awareness of GST among consumers and to know the impact and opinion of consumers towards GST. This study result indicates that the awareness level of customers about GST is not up to the mark. The government has to put more effort to ensure that consumer have a clear understanding and develop a positive perception towards GST.
IV. NEED OF THE STUDY
As an end consumer, we hardly pay attention to our food bill in and most of us are not even aware of the components included in it. If you revisit your food bill from the pre GST fine dine experience, you’ll find Service Tax, Service Charge, VAT being added over and above the food value.
4) (MINU.C.G & JIJI.K, 2019), In this study “A Study on Consumer Perception Towards Goods and Service Tax” The aim of the study is to know the consumers awareness towards GST in Cherpulassery Municipality, Palakkad (Dist), Kerala after the implementation in India. The study found that the majority of the consumers are agreed that GST is a simple and transparent tax system and it helps to increase the revenue of the Government. The data for the study been collected from both primary and secondary sources. Primary data was collected by using questionnaire and schedules from 40 respondents from Cherpulassery municipality. The secondary data was collected from various sources like journals, Magazines and web site etc. The sample size for the study is 40 respondents.
1) (Dr. G., 2019),in his study “Consumers’ perception towards GST Rates in India” focuses on study the consumers perception towards GST rates in India and furnish the information regarding GST rates to the consumers. The study is totally based on secondary data. The relevant data is collected from newspapers, research studies, reputed journals, books and websites etc. In conclusion, GST is a step forward for India to integrate its market and systematically develop its economy as a whole.
2) To find out the consumers perception towards GST 3) To analyze the satisfaction level of consumers towards the GST in Restaurants.
III. OBJECTIVES OF THE STUDY
in the form
The study is used descriptive research. It describes the situation or phenomenon. Survey method used in the study to collect responses from customers in different restaurants. The data for the study been collected from both primary and secondary sources.
Primary Data was collected by using questionnaire technique. The questionnaire was collected on 100 respondents belonging to Bengaluru city. The sample was selected by using random sampling technique from the population belonging to different demographic profile like gender, age, education and occupation. Secondary data was collected through internet, website, research journals and published books
etc VI. DATA ANALYSIS AND INTERPRETATION
tables and graphs. A brief description
have
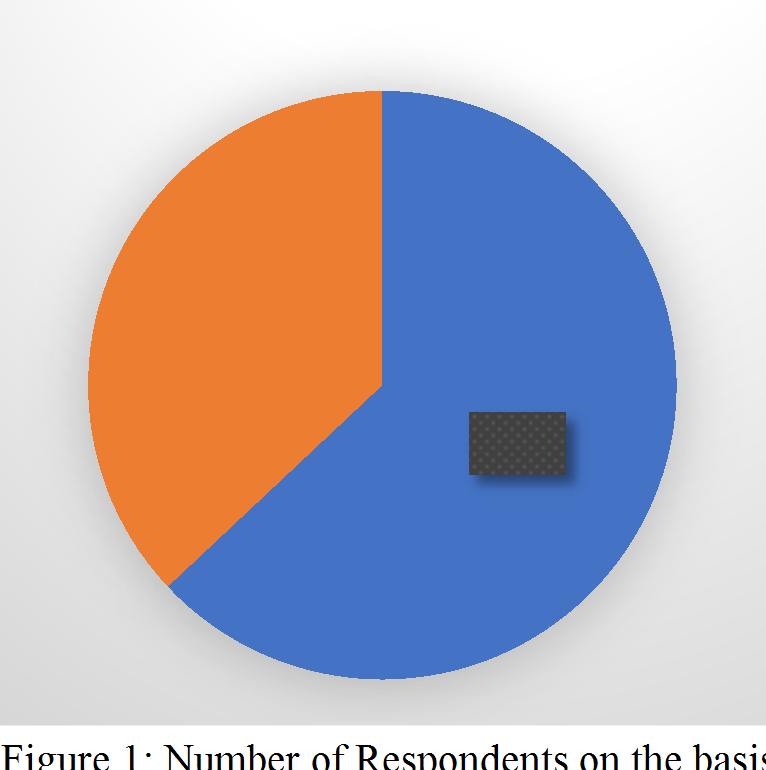
and interpretation are given below: Table 1: Number of Respondents on the basis of Gender Sl. No Gender No. of Respondents Percentage 1 Male 63 63 2 Female 37 37 3 Others 00 00 Total 100 100 Figure 1: Number of Respondents on the basis of Gender. 1) Interpretation: As per the
and
The data collected from various respondents to analysis interpret data collected been presented of of analysis above
International Journal for Research in Applied Science & Engineering Technology (IJRASET) ISSN: 2321 9653; IC Value: 45.98; SJ Impact Factor: 7.538 Volume 10 Issue VIII August 2022 Available at www.ijraset.com 947©IJRASET: All Rights are Reserved | SJ Impact Factor 7.538 | ISRA Journal Impact Factor 7.894 | Hence, there is a need to provide the awareness to the consumers on the GST in restaurants. V. RESEARCH METHODOLOGY
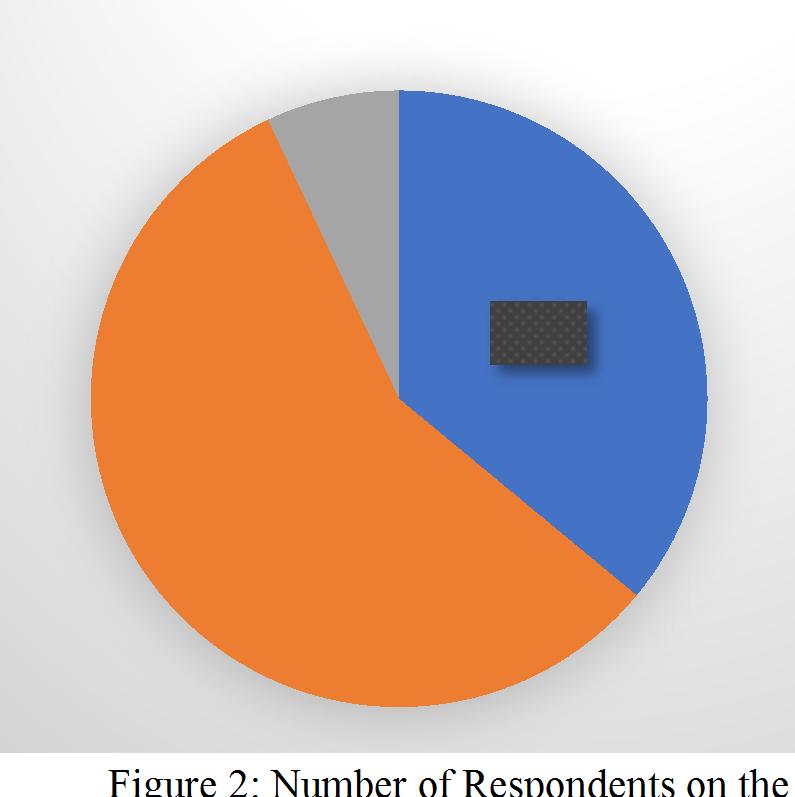
table and graph it can be observe that, among all the respondents 63% respondents are male and 37% respondents were female. Table 2: Number of Respondents on the basis of Age Sl. No Age No. of Respondents Percentage 1 Below 25 Years 36 36 2 25 60 Years 57 57 3 Above 60 Years 07 07 Total 100 100 63% 37% 0% Number of Respondents on the basis of Gender OthersFemaleMale
the conclusion. The


International Journal for Research in Applied Science & Engineering Technology (IJRASET) ISSN: 2321 9653; IC Value: 45.98; SJ Impact Factor: 7.538 Volume 10 Issue VIII August 2022 Available at www.ijraset.com 948©IJRASET: All Rights are Reserved | SJ Impact Factor 7.538 | ISRA Journal Impact Factor 7.894 | Figure 2: Number of Respondents on the basis of Age. 2) Interpretation: From the above table and graph, it is observed that among all the respondents 36% are below 25 years of age group, 57% respondents belong to 25 60 years of age group and 7% of the respondents fall in the above 60 years of age group. Table 3: Number of Respondents on the basis of Education Sl. No Education No. of Respondents Percentage 1 Primary Education 19 19 2 Secondary Education 14 14 3 Degree Holders or UG 45 45 4 Master Degree Holders or PG 8 8 5 Above Master Degree Holders 2 2 6 Illiterate 12 12 Total 100 100 Figure 3: Number of Respondents on the basis of Education. 36% 57% 7% Number of Respondents on the basis of Age Below 25 Years 25 60 Years Above 60 Years 19% 14% 45% 8% 2% 12% Number of Respondents on the basis of Education Primary MasterDegreeSecondaryEducationEducationHoldersorUGDegreeHolders or PG Above Master Degree Holders Illiterate


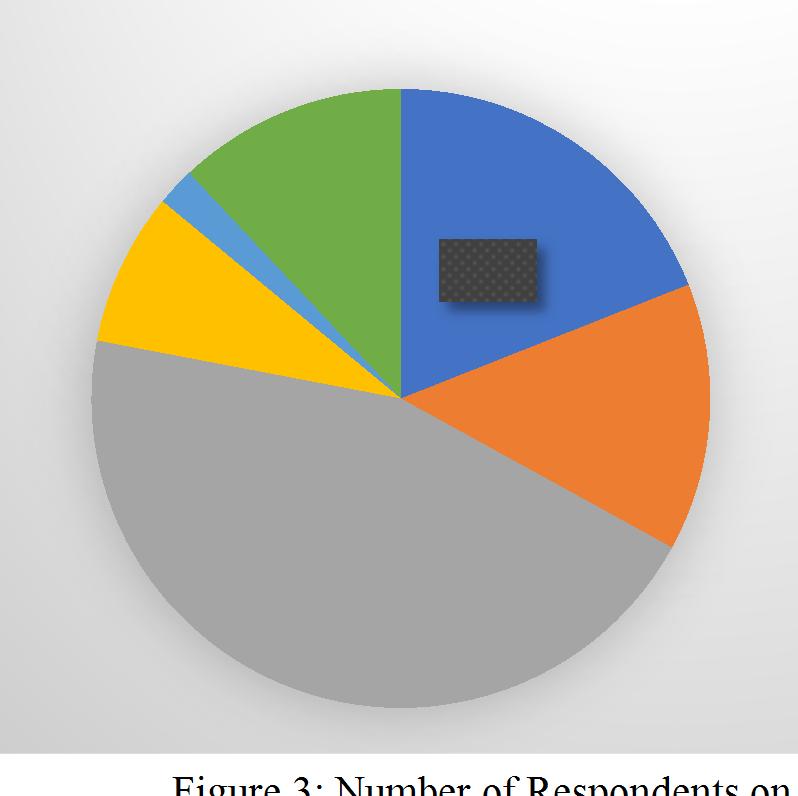


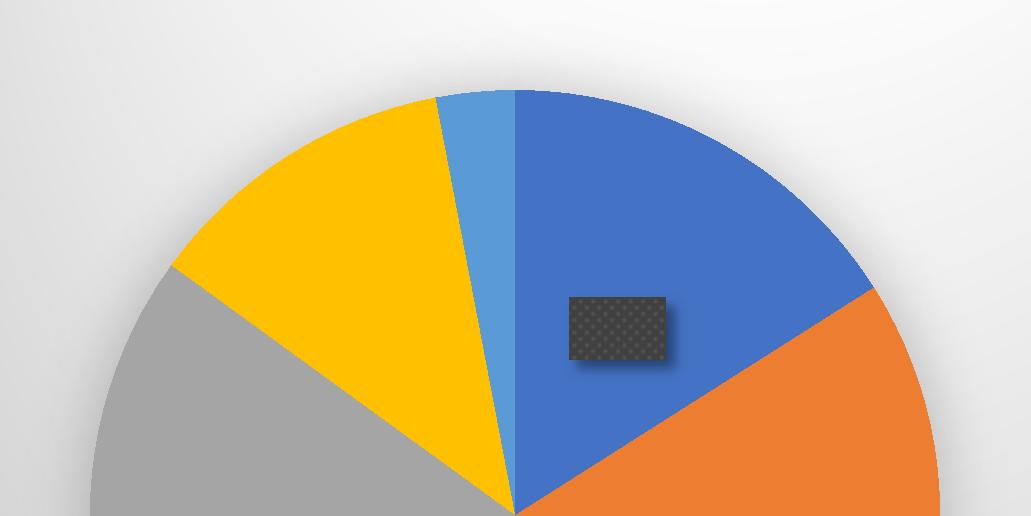
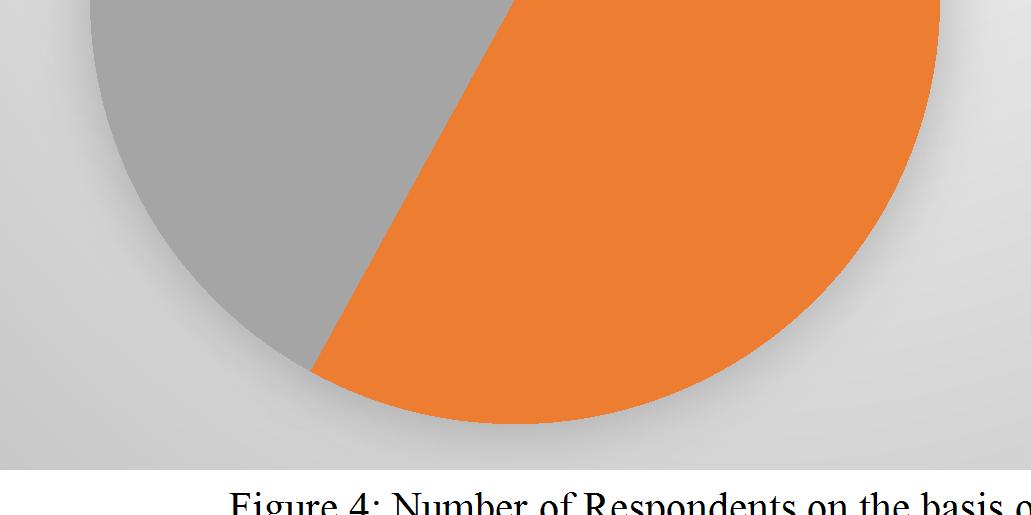
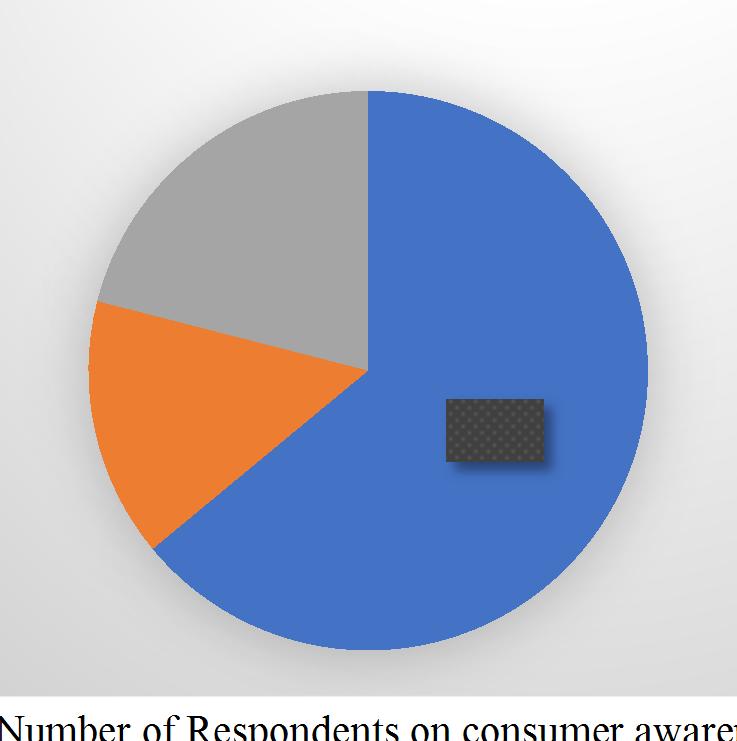
International Journal for Research in Applied Science & Engineering Technology (IJRASET) ISSN: 2321 9653; IC Value: 45.98; SJ Impact Factor: 7.538 Volume 10 Issue VIII August 2022 Available at www.ijraset.com 949©IJRASET: All Rights are Reserved | SJ Impact Factor 7.538 | ISRA Journal Impact Factor 7.894 | 3) Interpretation: From the above table and graph, it can be observed that among all the respondents 19% belongs to primary education group, 14% respondents belong to secondary education, 45% of the respondents belong to Degree graduates, 8% respondents belong to PG, 2% of the respondents belong to above PG education group and 12% of the respondents has no education qualification. Table 4: Number of Respondents on the basis of Occupation. Sl. No Occupation No. of Respondents Percentage 1 Government Employees 16 16 2 Private Employees 47 47 3 Business Persons 28 28 4 Students 12 12 5 Unemployed 07 07 Total 100 100 Figure 4: Number of Respondents on the basis of Occupation. 4) Interpretation: From the above table and graph, it is observed that among all respondents 16% belong to Government employee group, 42% respondents are employed in Private institutions or organizations, 27% of the respondents are business people, 12% of the respondents are students and 3% of the respondents are unemployed. Table 5: Number of Respondents on consumer awareness about GST in Restaurants Sl. No Response No. of Respondents Percentage 1 Yes, Fully aware 64 64 2 No, Not aware 15 15 3 May be, not sure 21 21 Total 100 100 16% 42% 27% 12% 3% Number of Respondents on the basis of Occupation Government Employees Private UnemployedStudentsBusinessEmployeesPersons


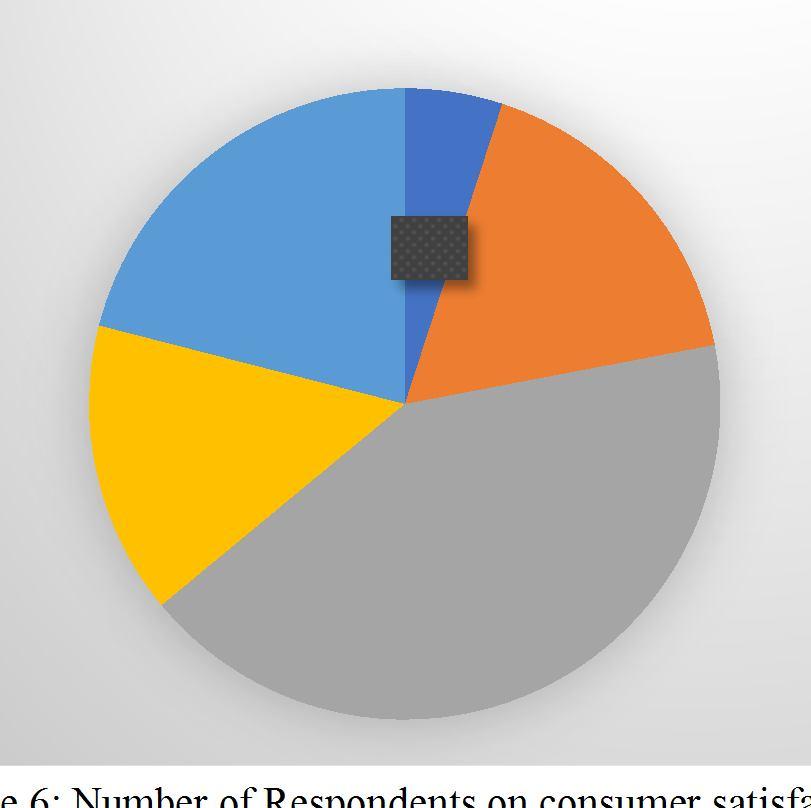
International Journal for Research in Applied Science & Engineering Technology (IJRASET) ISSN: 2321 9653; IC Value: 45.98; SJ Impact Factor: 7.538 Volume 10 Issue VIII August 2022 Available at www.ijraset.com 950©IJRASET: All Rights are Reserved | SJ Impact Factor 7.538 | ISRA Journal Impact Factor 7.894 | Figure 5: Number of Respondents on consumer awareness about GST in Restaurants. 5) Interpretation: From the above table and graph, it is observed that out of 100 respondents 54% of respondents are actually aware about GST charged in restaurants, 15% of respondents are completely unware about GST and 31% of respondents are are not sure about GST charges in restaurants. Table 6: Number of Respondents on consumer satisfaction with regard to GST in Restaurants Sl. No Response No. of Respondents Percentage 1 Highly Satisfied 05 05 2 Satisfied 17 17 3 Dissatisfied 42 42 4 Highly Dissatisfied 15 15 5 Neither Satisfied nor Dissatisfied 21 21 Total 100 100 Figure 6: Number of Respondents on consumer satisfaction with regard to GST in Restaurants 64% 15% 21% Number of Respondents on consumer awareness about GST in Restaurants Yes, Fully aware No, Not aware May be, not sure 5% 17% 42% 15% 21% Number of Respondents on consumer satisfaction with regard to GST in Restaurants Highly NeitherHighlyDissatisfiedSatisfiedSatisfiedDissatisfiedSatisfiednor Dissatisfied


agree
dis agree and 8%
is
40%
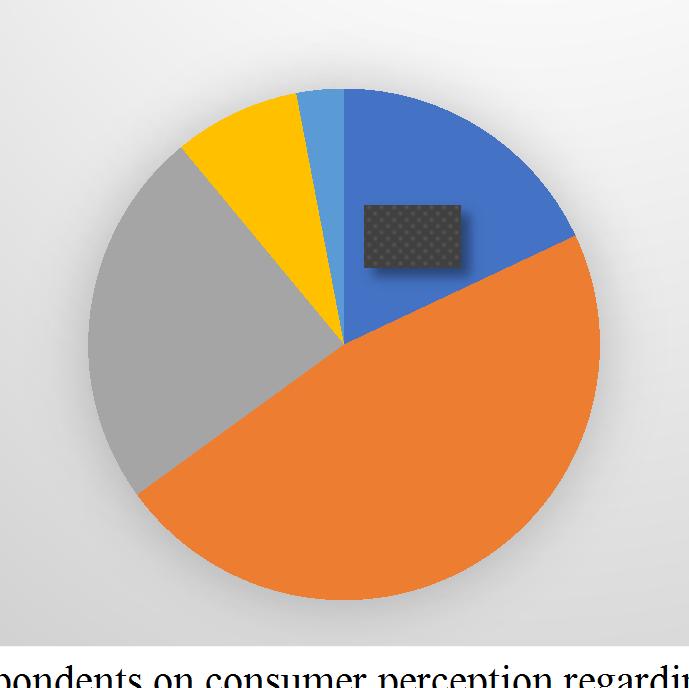
increased tax burden on consumers. Sl. No Response No. of Respondents Percentage 1 Strongly Agree 18 18 2 Agree 47 47 3 Neutral 24 24 4 Dis Agree 08 08 5 Strongly Dis Agree 03 03 Total 100 100 28% 40% 8% 16% 8% Number of Respondents on consumer perception regarding GST is a very good tax reforms for India Strongly Agree StronglyDisNeutralAgreeAgreeDis Agree
regarding
regarding
strongly agree
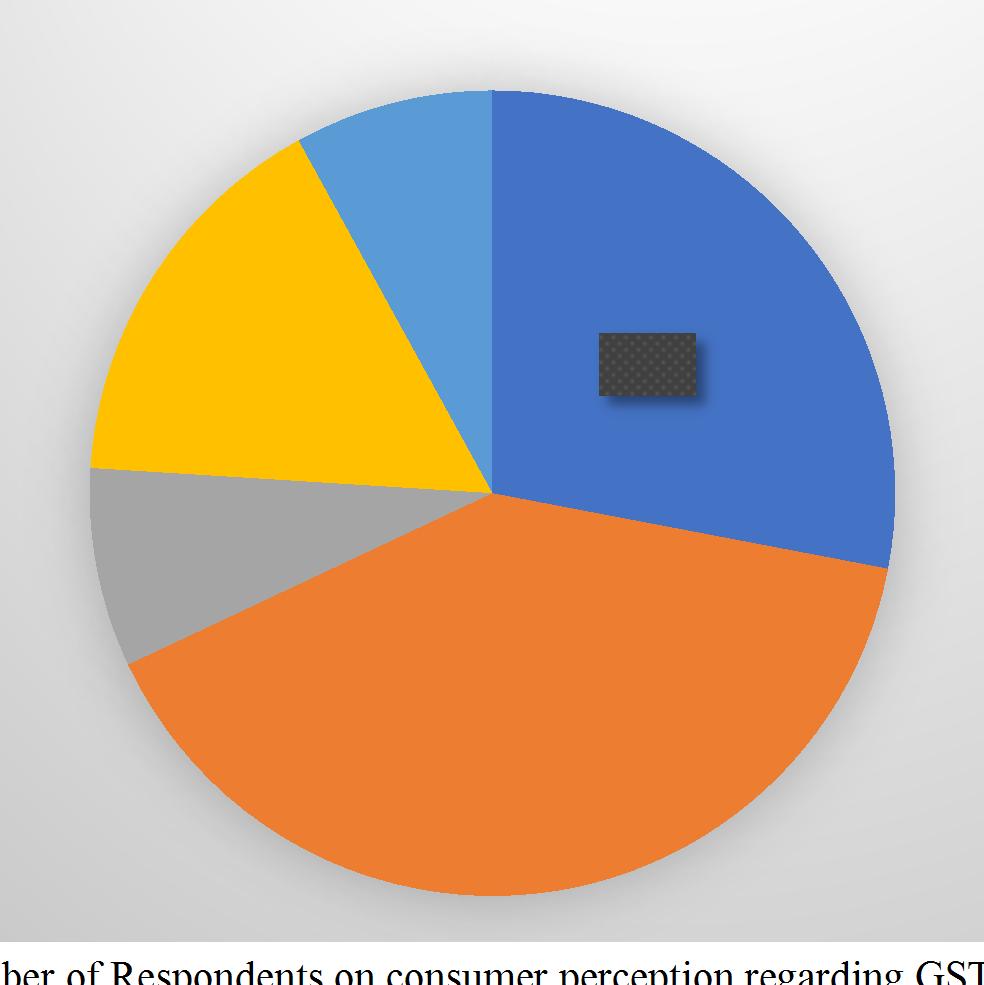
very good tax reforms for India. 7) Interpretation:
Figure Number of Respondents on consumer perception GST a The above table and graph shows that among all the respondents are and are with this statement, of the respondents are of the respondents are with the statement. it is concluded that majority o the consumers said that GST is a very good Number of Respondents on consumer perception GST has
8%
28%
7:
So,
strongly dis agree
International Journal for Research in Applied Science & Engineering Technology (IJRASET) ISSN: 2321 9653; IC Value: 45.98; SJ Impact Factor: 7.538 Volume 10 Issue VIII August 2022 Available at www.ijraset.com 951©IJRASET: All Rights are Reserved | SJ Impact Factor 7.538 | ISRA Journal Impact Factor 7.894 | 6) Interpretation: From the above table and graph, it is observed that among all the respondents 5% and 17% of the respondents are satisfied with regard to GST in Restaurants. Majority of the respondents i.e., 42% and 15% of respondents are Dissatisfied and 21% of the respondents are Neither Satisfied nor Dissatisfied with regard to GST in Restaurants. Table 7: Number of Respondents on consumer perception regarding GST is a very good tax reforms for India. Sl. No Response No. of Respondents Percentage 1 Strongly Agree 28 28 2 Agree 40 40 3 Neutral 8 8 4 Dis Agree 16 16 5 Strongly Dis Agree 8 8 Total 100 100
neutral, 16%
tax reforms for India. Table 8:


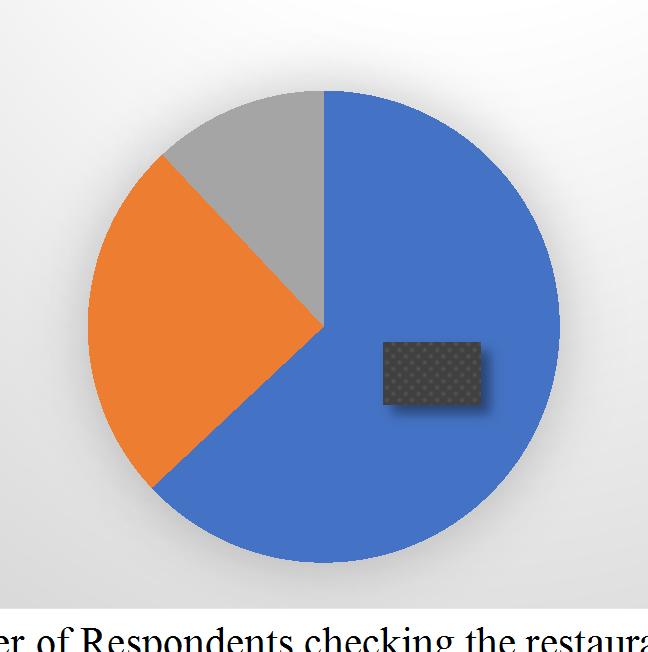
International Journal for Research in Applied Science & Engineering Technology (IJRASET) ISSN: 2321 9653; IC Value: 45.98; SJ Impact Factor: 7.538 Volume 10 Issue VIII August 2022 Available at www.ijraset.com 952©IJRASET: All Rights are Reserved | SJ Impact Factor 7.538 | ISRA Journal Impact Factor 7.894 | Figure 8: Number of Respondents on consumer perception regarding GST has increased tax burden on consumers. 8) Interpretation: According to the above table and graph, it is observed that majority of the respondents 47% are agree with this statement and 24% are neutral and also 18% are strongly agree with this statement. So, it is concluded that majority of the consumers are said GST has increased the tax burden on consumers. Table 9: Number of Respondents checking the restaurants bill for the GST component Sl. No Response No. of Respondents Percentage 1 Always 63 63 2 Sometimes 25 25 3 Never 12 12 Total 100 100 Figure 9: Number of Respondents checking the restaurants bill for the GST component 9) Interpretation: From the above table and graph, out of 100 respondents 63% of respondents always check the restaurant bill for GST component while making the payment. Only 12% of the respondents don’t check the bill for GST component while making the payment. 18% 47% 24% 8%3% Number of Respondents on consumer perception regarding GST has increased tax burden on consumers Strongly Agree StronglyDisNeutralAgreeAgreeDis Agree 63% 25% 12% Number of Respondents checking the restaurants bill for the GST component NeverSometimesAlways


5)
From the above findings, it can be concluded that majority of the people are aware about GST charged in restaurants including the rate of GST. The rate of GST must reduce since the people feel it is a burden on consumers and most of the consumers are not satisfied with GST rates charged on food, beverages and services in restaurants. People are well aware about GST implementation in India and they feel GST reforms is very good for India in terms of economic development. The government and restaurants need to make few steps to make consumers well aware about GST rates charged on food, beverages and services.
9)
3)
VIII. CONCLUSION
6)
services tax [8] https://cleartax.in/s/gst full form meaning [9] https://groww.in/p/tax/gst on food and restaurants#:~:text=The%20GST%20rate%20levied%20on,)%20is%205%25% 20 excluding %20ITC. [10] https://cleartax.in/s/impact gst food services restaurant business
REFERENCES
[1] A. S., & D, S. (2021, June). Study on Public Awareness towards Goods and. International Journal of All Research Education and Scientific Methods, 9(6), 888 893. [2] Dr Sandip S Tapkir, & Ms Jyoti Peswani. (2019, May). A Review of GST effect on the Food consumers in Journal of Emerging Technologies and Innovative Research, 6(5), 49 53. Retrieved from www.jetir.org [3] Dr. G., S. B. (2019, January). Consumers‟ perception towards GST Rates in India. RESEARCH REVIEW International Journal of Multidisciplinary, 04(01), 680 686. [4] Krishan Kumar. (2017). A Study on Customers Perception towards GST. Journal of Advances and ScholarlyResearches in Allied Education, XIV(1), 604 609. [5] MINU.C.G, & JIJI.K. (2019, March). A STUDY ON CONSUMER PERCEPTION TOWARDS. International Journal of Scientific & Engineering Research, 10(3), 82 90. Retrieved from http://www.ijser.org [6] Nitin Kumar. (2020, January). Customers Perception towards GST (Good &. International Journal of Science and Research, 9(1), 1000 1008. and
2)
7)
doi:10.21275/ART20204199 [7] https://cleartax.in/s/gst law goods
8)
1)
International Journal for Research in Applied Science & Engineering Technology (IJRASET) ISSN: 2321 9653; IC Value: 45.98; SJ Impact Factor: 7.538 Volume 10 Issue VIII August 2022 Available at www.ijraset.com 953©IJRASET: All Rights are Reserved | SJ Impact Factor 7.538 | ISRA Journal Impact Factor 7.894 | VII. FINDINGS OF THE STUDY
Majority of the respondents are from male category i.e. 63%. Most of the respondents falls in the age group of 25 60 years i.e. 57%. Majority of the respondents (i.e. 45%) are under graduates as their highest level of education qualification. Most of the respondents (i.e. 37%) are private institution or organization employees and 28% of respondents are Business people as their occupation level. Among all the respondents, majority of the respondents (i.e. 64%) are ware about GST charged in Restaurants. Among all the respondents, 42% of the respondents are not satisfied with regard to GST charged in restaurants. Majority of the respondents (i.e. 40%) are agreed for the statement of GST is very good tax reforms in India. Among all the respondents, 47% of the respondents agreed for the statement that GST has increased tax burden on consumers. Majority of the respondents (i.e. 53%) check the restaurants bill for GST component while making the payment.
From the above data analysis and interpretations, following are the findings of the study:
4)