

A Novel method of QRS Detection Using Adaptive Multilevel Thresholding with Statistical False Peak Elimination
A. Rajani1 , V. Sandeep2
1Assistant Professor, JNTUK, Andhra Pradesh

2Student, M. TECH, JNTUK, Andhra Pradesh
Abstract: Heart is the vital organ of a Human Body, because of its involvement in various works and processes in the entire body such as blood pumping etc., so recording a heart function is also a great thing, it is done through ECG signals. ECG signal records the electrical signals and activity of a Human Heart based on the electrical signals released by the Heart.
ECG signal consists of PQRST waves, which are the reference points on an ECG signal. But, recording them is much easy than extracting and analyzing them, so, as to extract them, we are applying an advanced adaptive multi level thresholding (AAMT) along with a selective statistical false peak elimination for the detection of QRS peaks of an ECG signal. Initially, median and moving average filters are applied for removing noise as well as terms.
After AAMT is implemented on the complete dataset of ECG signals. Then selective statistical false peak elimination (SSFPE) is implemented for removing noise terms that might be missed out during filtering. At last, a search back stage will be implemented to search for low amplitude useful peaks.
We used MIT-BIH arrhythmia and fantasia databases and got a higher accuracy in detecting and sensitivity is increased to 99.3 for MIT BIH arrhythmia and 99.7 for fantasia database compared to existing previous methods.
Keywords: AAMT, SSFPE, QRS peaks, Arrhythmia, ECG signals, Search back.
I. INTRODUCTION
The Heart ofa Human bodyis an essential and most vital organ Thehuman heart isresponsible for various processes inside our body. Heart’smainpurposeistopumpbloodtovariouspartsofthebodywhichisthemostimportanttaskfor ourbody.Thehumanheartemits electricalsignalsata verylow volts ofthe order of60mV, so, we have torecord those electrical signals for checking and validatingthe functions of a healthyheart, the recording of the electricalactivity ofthe human heart is done byElectro Cardio Gram (ECG) signals. But, the problem with those ECG signals is their complexity during plotting and analyzing.
An ECG signal consists of PQRST waves of which QRS are principal components. QRS waves are also difficult to detect, but we can detect R peaks easily.
Thereexistsanumber oftechniquesfor detectingRpeaks, suchasFourierTransform(FT), DirectCosineTransform(DCT),FastFourier Transform(FFT)andapplication ofWaveletssuch asContinuousWavelet, DiscreteWaveletetc.Transformingasignalintofrequency domain and taking the instantaneous peaks of the signal will result in R peaks. R peaks can be extracted using statistical analysis with thresholds of different lengths.
The extraction of remaining waves such as, Q or S can also be done by statistical analysis. That involves thresholding at different instants. Q and S peaks along with R forms a complex trio of QRS peak which is a quite different and difficult to be extracted. There existseveraltechniquesin extractionanddetection ofQRSpeaksbut,here, weareusinganadvancedadaptivemulti levelthresholding (AAMT)combinedwith selectivestatisticalfalsepeakelimination (SSFPE)for detectingor extractingQRSpeaksfromanECGsignal record.
AnECGsignalcontainsPQRSTwaves ofwhichQRSarethemostimportantwaves, but, theextraction ofaQ, R, Sor anywaveisquite difficultandchallenging, for thatweareimplementinganadvancedadaptivemulti levelthresholding(AAMT)combinedwithselective statistical false peak elimination (SSFPE) for detecting or extracting QRS peaks from an ECG signal record. After, all the statistical analysis of the segments it uses a search back stage for detecting anymissed out true peaks in the ECG signal segment., we have used MIT BIH arrhythmia and fantasia databases for the implementation.
Technology (IJRASET
ISSN: 2321 9653; IC Value: 45.98; SJ Impact Factor: 7.538

Volume 10 Issue IX Sep 2022 Available at www.ijraset.com
A. Types of Noises in ECG Signals
Thereexistsanumber ofnoisesthatcorruptstheECGsignalinadifferentmanner. Somedegradethesignal’sstrength, somecompletely the spectral characteristics of the signal and some completely change or destroys the signal. Such as, Baseline Wander, Power line interference andmotion artifacts. Themotion artifacts are due tothemotion ofthe person duringthe process of fetching theECG from the person. Person’s movement can affect the signal’s quality from a low level to a considerable level or even higher. The power line interference is a typical type of noise that occurs due to the interference of electrical signals that does not belongs to the activity of the Heart. The interference of the signals that are captured by the ECG during the initial process. Baseline Wander is a type of noise produced in ECG signals because of the poor equipment or presence of any disturbances in the middle and presence of any electrical equipment near to the person who’s taking the ECG test.
B. Median and Moving Average Filter
TheusageofaMedian filterscascadedwith MovingAveragefilteristhewholenewapproach ofthiswork. Median filtersaregenerally used for removingnoise from the signals. The median filter uses the median values toreplace the noisyterms. Usually, thenoisyterms deviate from the remaining terms in a locality. They might be too high or too low than the regular values in the particular location. Median filter calculatesthemedian oftheparticularlocationandcheckfor itsneighborstoreplacethedeviatedvalues.Thereby,reducing or minimizing the noise from the signal
MovingAveragefilterisalsoanoiseremovingfilter fromthesignals. Movingaveragefilterisatype ofFIRfilterwhicheliminatesnoise terms. Moving average filter byits name, this calculates the series of averages from the signal locations or instants that moves over a seriesofinstantsonthesignal. Later, itreplacesthemovingaverageswith thenoisytermstoeliminatethenoisefromtheoriginalsignal. Moving average filter followed by two median filters gives more robust signal than the existing methods or techniques. Later, the de noisedornoisefree(almost)signalissenttotheAdvancedAdaptiveMulti LevelThresholding(AAMT)for thedetectionofQRSpeaks or waves from the noise removed ECG signal.
ECG signalnoise elimination actuallymade easythrough the process ofapplyinga median filter along with the moving average filter. Twomedian filtersareemployedtogetnoisesuppressedattwolevelsmakingthesignaltonoiseratioimprovement.Later,anadditional filter known as, moving average filter is applied to remove the noise at another level, making the noise eliminated at even low levels. Signal tonoise ratio is further more improvised for the ECG signal and making it easier for detection bythe processes involved in the work. De noised signal at each level is made easy, through this type of application of filters at multiple levels. This type of approach makes the signal to noise ratio improving even better than the previously existing works
C. AAMT
The Advanced Adaptive Multi Level Thresholding (AAMT) is extension of the existing technique known as Adaptive Multi level Thresholding (AMT)
TheAAMTfor detectingorextractingQRSpeaksofanECGsignalarequiteimpressive, becausethecurrenttechniquetakesbeatsaswell asamplitudethresholdsthantheexistingAMTtechnique.TheAAMTconsumeslesstimethantheAMT.Thepeaksarefirstextractedand their locations along with their amplitudes are recorded and their average value is taken. It uses two levels called signal level and noise levelwhichareinitiallytakenaszeroor 0forreference.Later,theaveragesareusedtoreplacethelocationswherethenoisetermswillbe present that means deviation from the remaining neighbors at that particular location. Later, updating these levels at everystage when we findanewtrue peak or a discardednoise peak. Here, we use another twothresholds both fornoiseandtruepeaks,RathresholdofloweramplitudebelowwhichpeaksarethenoisepeaksandarediscardedandTathreshold of high amplitude above are true peaks and updated. The resultant gets the pseudo peaks with a much more accuracyin detection after beingfilteringofnoiseandinterferencetermsinthepreviouslevel.Ifallthepseudopeaksareextractedthesignalissegmentedwith less than50Ksamplesandwitheach segmentcontainingtwotimesthesamplestakenbyexistingAMTtechnique.Afterthat,thesegmentsare sent to the next stage for removing noise terms. AAMT uses thresholds at multiple levels or stages todetect or extract peaks or waves even more accurately. AAMT implements a new typeofacombination ofmedianfilteralongwithamovingaveragefiltertode noisetheECGsignal. Acombinationoftwomedianfilters cascaded with a moving average filter makes the noise removal more. Three stages of noise removing from the ECG signal is the new approach usedbythispaper. Later,thede noisedsignalisthresholdedateach levelandthepeaksor wavesaredetectedusingmulti level thresholding.TheobtainedECGsignalissegmentedintoseveralsegmentsoflengthmaximumof50Ksamplesandsenttothenextstage known as Selective Statistical False Peak Elimination (SSFPE).
Technology (IJRASET
ISSN: 2321 9653; IC Value: 45.98; SJ Impact Factor: 7.538 Volume 10 Issue IX Sep 2022 Available at www.ijraset.com

D. Selective Statistical False Peak Elimination (SSFPE)
The Selective Statistical False Peak Elimination (SSFPE) is a statistical analysis of the extracted ECG segments. The technique uses statisticalthresholdsandselection toeliminateanyfalsepeakspresentin thesegments. After, thesegmentedECGsignalsareextracted, the SSFPE uses the pseudotrue peaks for analysis and calculates the difference between the peaks that lie adjacentanda mean peakto peakdifferenceaswellastheir weightsarealsocalculated. After, allthestatisticalanalysisofthesegmentsitusesasearchbackstagefor detecting any missed out true peaks in the ECG signal segment. The thresholding technique yields several true positive peaks at this stage. Later,asearchbackstageisemployed for detectingthemissed outpeaks. Search backworkslikefeedbackforthesystemwhereit checks once again for the remaining missed out true peaks
II. PROPOSEDMETHOD
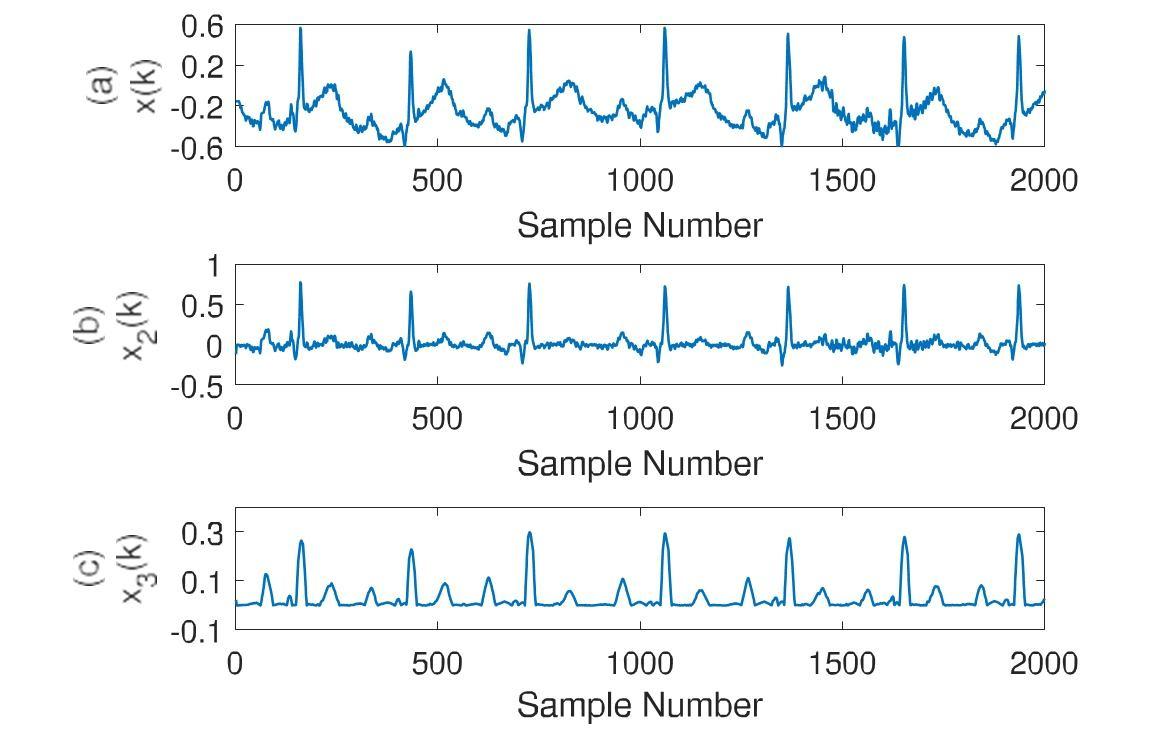
The proposed work starts with a Pre processing stage, detection of peak stage followed by a post processing stage. The initial stage extractsthesuitableinformation fromanECGsignalbysuppressingnoiseorinterferences.Thedetectionisdoneintwotimestomakethe detectionrobust;firstdetectionisdonethroughAAMTusingR peakswithanadaptivethreshold.TheseconddetectionisdonebySSFPE through segmented and analysis of previously detected peaks. At last, the search back stage tries to detect any missed out true peaks. Pre processingstageinvolvestheelimination ofthenoiseandinterferencetermsfromthesignalthroughtwoMedianfiltersandaMoving Average filter. Median filters aim to filter the median values that are higher through a sample of ECG signal. After that, the moving averagefilteralsoaimsforaveragevaluedpeaksinthesignal. Median filtersaretheonewhichcalculatesthemedian valuesofthesignal in a location where the noise will be present. After the calculation of median for the locality verifies the neighbors of the particular location,ifanyvaluehasmoredeviation ornot. Ifanyvaluehasahighdeviationthatmaybe veryhighvalueor verylowvaluethatvalue will be replaced bythe previouslycalculated median value. Likewise, the median filtering is applied two times to reduce or nullifythe noise at more levels. This type of approach makes the signal to noise ratio improving much better than the previously existing works. Themovingaveragefilterisalsoanoiseremovingfiltermainlychoosestofilterthehighfrequencies. Movingaveragefiltercalculatesthe averageofaparticularlocationandthataveragecalculationismovedovertheentiresignal.Thisway, themovingaveragefiltercalculates the series of averages of the locations over the signal. Later, the averages are usedtoreplace thelocations where thenoise terms will be presentthatmeans deviation fromtheremainingneighbors at that particular location. Thereby, improvisingthe signaltonoise ratiotoa new level that is much better than the previous works.
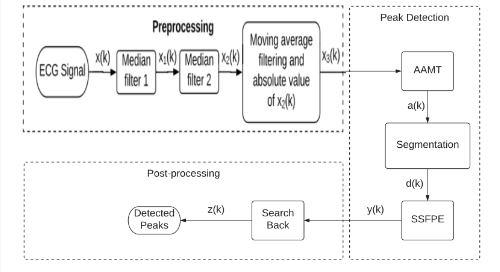
Fig 1: Block diagram of the proposed method
Detection ofPeak stageinvolves multi level thresholding byAAMT, itstarts with initiallysettingthemin peakintervalto280ms which avoidseliminationoftruepositivepeaksthatconsistsofEctopicbeats.Afterthat,thelocationsandamplitudesofthepeaksarecalculated, throughthemtheaveragewillalsobecalculated.Noiseandsignalvaluesareusedtocountthetrueaswellasignoredfalsepeaksofnoise. Twothresholdsarealsoinitializedoneofthemisalowamplitudethresholdfor eliminatingfalsenoisepeaksandotherisupperthreshold for truepeakidentification. Later,theECGsignalissegmentedwithutmostof50Ksamplesper signal.Thesegmentedsignalissenttothe next stage for the detecting of any peaks that aremissed out during the current process.
ISSN: 2321 9653; IC Value: 45.98; SJ Impact Factor: 7.538 Volume 10 Issue IX Sep 2022 Available at www.ijraset.com

After, all the statistical analysis of the segments it uses a search back stage for detecting any missed out true peaks in the ECG signal segment. If any value has a high deviation that may be very high value or very low value that value will be replaced by the previously calculated median value. Likewise, the median filtering is applied two times to reduce or nullifythe noise at more levels. After, all the statistical analysis of the segments it uses a search back stage for detecting any missed out true peaks in the ECG signal segment. The thresholdingtechniqueyieldsseveraltruepositivepeaksatthisstage. Later,asearch backstageisemployed for detectingthemissed out peaks.
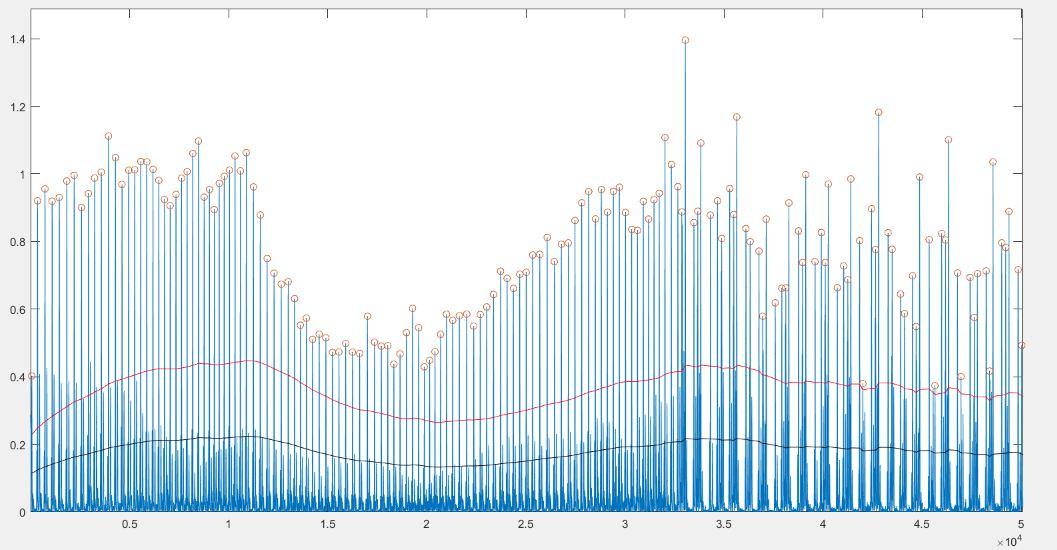
Post processing stageinvolves a statisticalanalysis of the segmented ECG samples and based on the analysis thresholds are calculated. Thosethresholdsareusedtoextractthetruepeaksthatareleftoutduringthepreviousprocess.Thethresholdingtechniqueyieldsseveral true positive peaks at this stage. Later, a search back stage is employed for detecting the missed out peaks. Search back works like feedback for the system where it checks once again for the remaining missed out true peaks. After, the segmented ECG signals are extracted, theSSFPEusesthepseudotruepeaksfor analysisandcalculatesthedifferencebetween thepeaksthatlieadjacentandamean peak to peak difference as well as their weights are also calculated.
III. RESULTS
At the initial stage which is a pre processing stage the original ECG signal is plotted.
After that, the
Fig
of
(AAMT).
noise
Detection of true peaks
multi
ISSN: 2321 9653; IC Value: 45.98; SJ Impact Factor: 7.538 Volume 10 Issue IX Sep 2022 Available at www.ijraset.com

the second stage where the QRS true peaks are almost found.
Fig 4: False Peak elimination
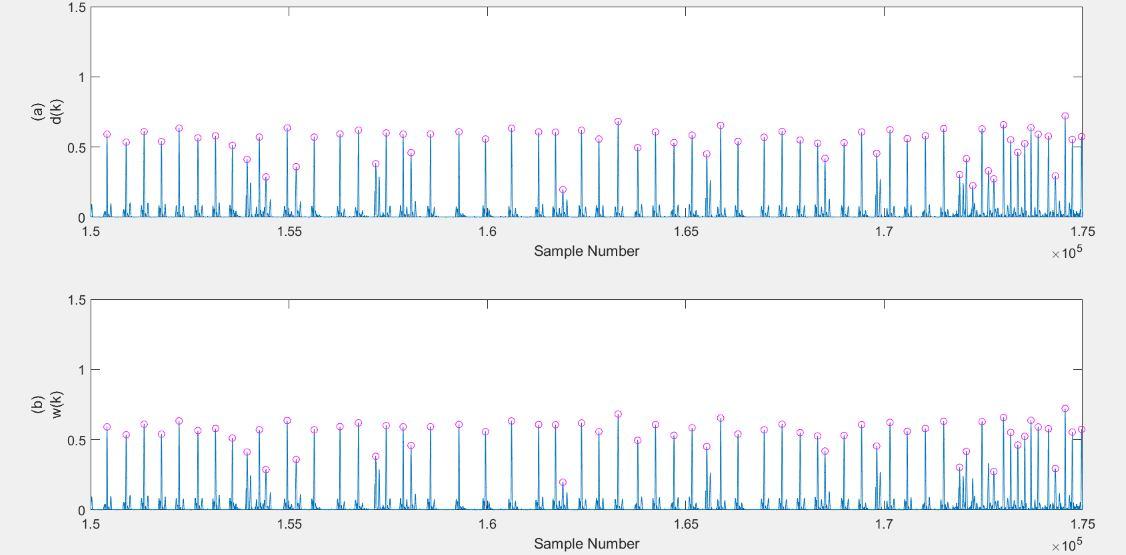
Afterthat,thefinalstagewhichisapost processingstageinwhich selectivestatisticalfalsepeakelimination(SSFPE)isapplied. Ityields true peaks of QRS through statistical thresholding. The false peaks are also eliminated in this stage.
Fig 5: Peaks detected on original signal and pre processed signal
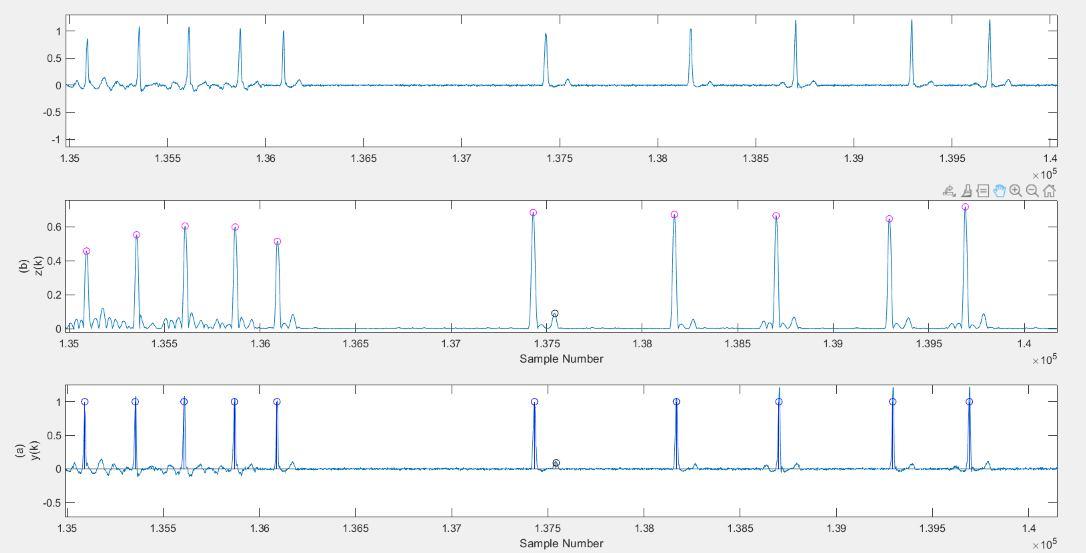
A Search back stage which is like feedback for the post processing stage, where the technique once again checks for any missed out peaksduringtheentireprocesses whichmakesthetechniqueeven morerobust. Finally, thetruepositivepeaksaredetected,thatareQRS peaks of an ECG signal. Three terms are used to see the performance of the proposed method, and these are sensitivity (Se), positive predictivity (PC), and detection error rate (DER) which are represented by,
(IJRASET
ISSN: 2321 9653; IC Value: 45.98; SJ Impact Factor: 7.538

Volume 10 Issue IX Sep 2022 Available at www.ijraset.com
where, TP is the true positive that is the number of annotated beats detected properly, FN is the false negatives that are the number of missed beats from the annotations, FP is the false positive that is the number of beats that are not annotated but still detected by the algorithm and TB is the total number of beats annotated in the record
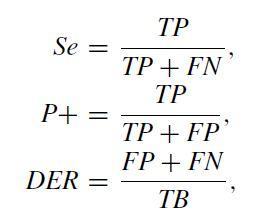
TABLE1.
RESULTS FROM THE MIT BIH ARRHYTHMIA DATABASE
Rec. No. TB DB TP FP FN Se (%) P+ (%) DER(%)
100 2273 2273 2273 0 0 100 100 0
101 1867 1864 1864 0 3 100 99.84 0.16
102 2187 2184 2184 0 3 100 99.86 0.14
103 2083 2083 2083 0 0 100 100 0
104 2229 2222 2222 0 7 100 99.69 0.31
105 2589 2594 2586 8 3 99.69 99.88 0.42
106 2033 2023 2023 0 10 100 99.51 0.49
107 2134 2133 2133 0 1 100 99.95 0.05
108 1757 1746 1745
109 2532 2526 2526 0
111 2130 2115 2115 0
112 2539 2539 2539 0
113 3550 3480 3480 0
114 1984 1983 1982 1
99.94 99.32 0.74
100 99.76 0.24
100 99.3 0.7
100 100 0
100 98.03 1.97
99.95 99.9 0.15
115 1952 1953 1952 1 0 99.95 100 0.05
116 2394 2388 2388 0
117 2546 2486 2486 0
2279 2279 2279
1988 1988
1862 1861
2476 2476
123 1519 1520 1519
124 1618 1615 1615
200 2597 2589
201 1977 1958
202 2147 2131
2846 2669
2645
207 2091 2047
208 2938
209 3006
210 2634
2749
100 99.75 0.25
100 97.64 2.36
100 100 0
100 100 0
100 99.95 0.05
100 100 0
99.93 100 0.07
99.81 0.19
99.96 99.65 0.39
99.69 98.74 1.57
99.25 0.75
99.85 93.64 6.5
99.89 0.11
99.51 97.42 3.06
99.69 0.31
99.97
99.43 0.68
213 3249 3238 3238
214 2262 2256 2255
215 3364 3347 3347
217 2205 2205 2203
219 2170 2153 2153
220 2045 2048 2045
2428 2427 2426
222 2527 2501 2494
2603 2594 2594
2042 2018 2017
2256 2256 2256
231 1577 1573 1572
232 3049 2898 2876
3076 3069 3069
2753 2753 2753
113757 113009 112934
ISSN: 2321 9653; IC Value: 45.98; SJ Impact Factor: 7.538

10 Issue IX Sep 2022 Available at www.ijraset.com
11 100 99.66 0.34
7 99.96 99.69 0.35
17 100 99.49 0.51
2 99.91 99.91 0.18
17 100 99.22 0.78
0 99.85 100 0.15
2 99.96 99.92 0.12
33 99.72 98.69 1.58
9 100 99.65 0.35
25 99.95 98.78 1.27
0 100 100 0
5 99.94 99.68 0.38
99.24 94.33 6.4
7 100 99.77 0.23
0 100 100 0
99.93 99.35 0.72
IV. DISCUSSION
The ECG signalis taken from twodatabases namely, MIT BIHArrhythmia and Fantasia databases. The ECG signal is corrupted from noise already, so, removing the noise bythe application of a combination of filters. Two Median filters along with a Moving Average filter helps in reducing thenoise toa greater extent. Noise removingis doneatthree times, bytwomedian filters and a movingaverage filter, so noise is reduced to lower level than the previously existed processes. Later, the noise removed ECG signal is moved to the AAMT for detecting the QRS Peaks. After, the QRS Peaks are detected it segmented into 50K samples of ECG signal each. These segmentsaresenttoSSFPEfor further detection ofQRStruePeaks, ifanymissedout. Later,asearch backstageisimplementedtoagain search for the QRS Peaks, this stage makes our work even more robust in determining the QRS Peaks.
METHODS
Engineering Technology (IJRASET)
ISSN: 2321 9653; IC Value: 45.98; SJ Impact Factor: 7.538

Volume 10 Issue IX Sep 2022 Available at www.ijraset.com
V. CONCLUSION
We can finallyconclude that, the QRS peaks are extracted and detected using AAMT which employs a median filtering along with a moving average filter to filter out noise and interference terms from the original ECG signal and left out true peaks are again detected with SSFPE, later,asearch backstageisemployedtomakethedetection even morerobust.Thepresenttechniqueofadvancedadaptive multi level thresholding (AAMT) gives better results compared with the previous technique of AMT where, it uses more data and thresholds for processing.
REFERENCES
[1] T.Sharmaand K. K. Sharma,‘‘QRS complexdetectioninECG signalsusinglocallyadaptiveweightedtotal variationdenoising,’’ Comput. Biol. Med., vol.87,pp. 187 199, Aug. 2017.
[2] B. U. Kohler, C. Hennig, and R. Orglmeister, ‘‘The principles of software QRS detection,’’ IEEE Eng. Med. Biol. Mag., vol. 21, no. 1, pp. 42 57, Aug. 2002R. Nicole, “Title of paper with only first word capitalized,” J. Name Stand. Abbrev., in press.
[3] R. M. Rangayyan, Biomedical Signal Analysis, 33, JohnWiley & sons, 2015X. Lu, M. Pan, andY. Yu, ``QRS detection based on improvedadaptivethreshold,''J. Healthcare Eng., vol. 2018, pp. 18, Mar. 2018.
[4] J. Pan, W.J. Tompkins, A real time QRS detection algorithm, IEEE Trans. Biomed. Eng. (3) (1985) 230 236.
[5] J.D. Drake, J.P. Callaghan, Elimination of electrocardiogram contamination from electromyogram signals: an evaluation of currently used removal techniques, J. Electromyogram Kinesiology. 16 (2) (2006) 175 187.
[6] P. S. HamiltonandW. J. Tompkins, ``Quantitative investigationofQRS detectionrulesusingthe MIT/BIH arrhythmia database,'' IEEE Trans. Biomed. Eng., vol. BME 33, no. 12, pp. 1157 1165, Dec. 1986

