
10 VIII August 2022 https://doi.org/10.22214/ijraset.2022.46542

1Department of Information Technology, Kalyani Government Engineering College, Kalyani, Nadia, West Bengal, India

2Department of Computer Science and Engineering, Narula Institute of Technology, Kolkata, West Bengal, India
Abstract: Rice is one of the important cereals which feeds more than half of the world's population. It is used frequently in a variety of flavourful recipes. In this work, a dataset of Cammeo and Osmancik species found in Turkey has been selected for the study. It have 3810 samples containing seven morphological features.

The feature ranking methods like Fisher score, FSV, infFS, Laplacian, ReliefF, MCFS and MUTinfFS are selected and applied on the above datasets for the purpose of finding key features for proper feature selection. After selecting key feature values, feature vector have been prepared. Then, Support vector machine technique was applied for classification based on the results obtained from feature ranking techniques.
Training and testing prediction accuracy was also calculated. It has been observed that the classification by SVM based on FSV performed top during training process. Whereas, classification by SVM based on Fisher score as well as based on FSV both performed top during testing.
Prediction accuracy of 93.57% was found in both the cases during testing and validation which is quite good when compared with existing work. During testing, minimum value of missed alarm percentage was found in case of fisher score and minimum value of false alarm percentage was found in the case of FSV. Furthermore, one of the main advantage of our system is that it need only four out of seven parameters for the purpose of classification. The validation statistics like sensitivity (0.91), specificity (0.96), false positive rate (0.04), false negative rate (0.09), positive predictive power (0.95) and negative predictive power (0.93) indicated promising results. This simple model enables the classification of rice grain and holds great potential for future improvements.
Keywords: Rice; Feature selection schemes; Fisher score, InfFS; FSV; Laplacian; MCFS; MutInfFS; ReliefF; Support Vector Machine;
Rice is a common cereal in Indian, Asian and cuisines of most of the countries of the world. It is used frequently in a variety of flavourful recipes. Mostly length of the grain and flavour are considered while selection. Quality of the rice also depends on amount of broken rice in it. It is desired to have vey less or nil amount of the broken rice. . People around the world love to eat rice due to its best quality.
Rice[1] mainly passes from different stages before coming into the market for consumption. The steps includes cleaning process, color sorting and classification. During cleaning process rice grains are separated from foreign matters. In color extraction, stained and striped ones are separated so that a clear whiteness on the rice surface remains. Finally, classification is done which ultimately separates broken ones with solid ones.
In this paper, we are more focussed on two species of rice that grows in Turkey. The processing stages for the planned model have been given in figure 1.
Initially, dataset of rice have been collected Various morphological feature set have been arranged Feature selection method like Fisher score have been computed for the purpose of finding key features for proper feature selection. After selecting key feature values, feature vector have been prepared. Support vector machine is applied for the purpose of classification. Testing have been carried out Finally the system has been tested and validated
& Engineering Technology (IJRASET
ISSN: 2321 9653; IC Value: 45.98; SJ Impact Factor: 7.538 Volume 10 Issue VIII Aug 2022 Available at www.ijraset.com
The paper has been outlined as follows. Introduction and plan of work has been discussed in section 1. Literature review and different feature selection methods have been described in section 2. The comprehensive work and results have been incorporated in section 3. The testing and validation have also been argued in this section. The paper concludes with section 4
It is used to extract image components that are useful in the representation and description of a region or shape [2]. It is used for quantitative description such as area, perimeter, major axis length, minor axis length etc. It helps in characterizing an object adequately so that it may be unambiguously classified. Some of the morphological features [3, 4] as given below.
1) Area: The area is the number of pixels in a shape
2) Perimeter: The perimeter is the number of pixels in the boundary of the object.
3) The major axis Length: It is the pixel distance between the major axis endpoints.
4) Minor Axis Length: It is the pixel distance between the minor axis endpoints.
5) Eccentricity: It is the ratio of the length of the short (minor) axis to the length of the long (major) axis of an object. Its value lies between 0 and 1.
6) The Convex Area: It is the area of the convex hull that encloses the object.
7) Extent: The ratio of the region formed by the rice grain to the bounding box pixels. The bounding box or bounding rectangle of an object is a rectangle which circumscribes the object. The dimensions of the bounding box are those of the major and minor axes.
In order to make good predictions on testing sets, we use several feature ranking methods [5, 6] to gain knowledge of the data. Feature selection [7] is a dimensionality reduction technique that reduces the number of attributes to a manageable size for processing and analysis It does not alter the original feature set rather selects a subset by eliminating all the features whose presence in the dataset does not positively affect the learning model. Thus preserves the original semantics of the features which makes it easy to interpret. Using a set of features a machine learning technique can perform classification [8]. Selecting an optimal subset of relevant and non redundant features is a challenging task. Since there is a trend off, if too many features are selected it causes the classifier to have a high workload which can decrease the classification accuracy.
Factor
Applied Science & Engineering Technology (IJRASET)
ISSN: 2321 9653; IC Value: 45.98; SJ Impact Factor: 7.538 Volume 10 Issue VIII Aug 2022 Available at www.ijraset.com
On the other hand, if too few features are selected there is a possibility of eliminating features that would have increased the classification accuracy. Thus, there is a need to get an optimal subset of relevant and non redundant features which will give an optimal solution without decreasing the classification accuracy.
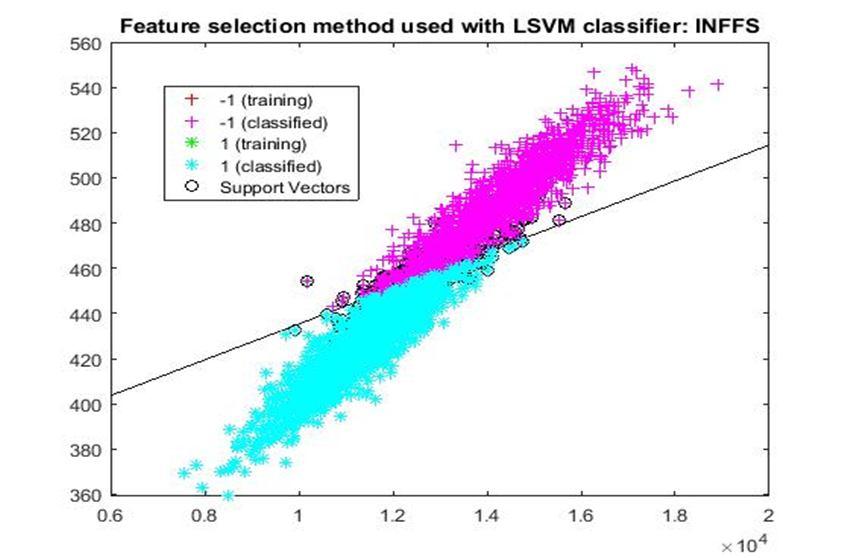
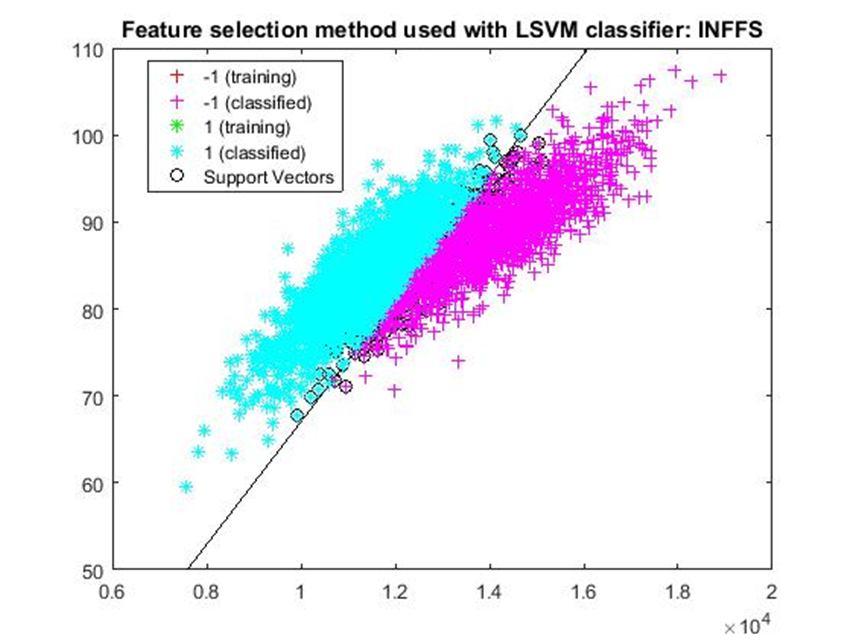
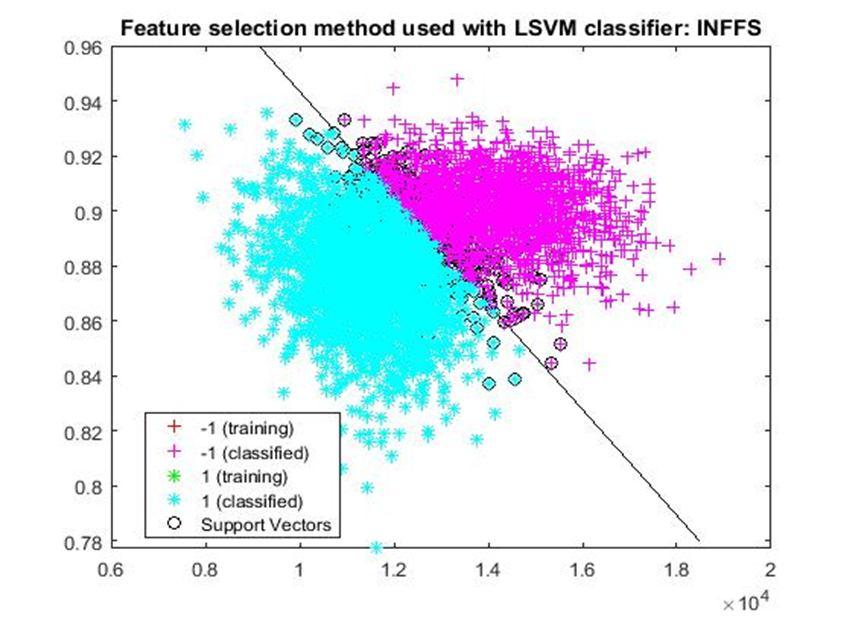
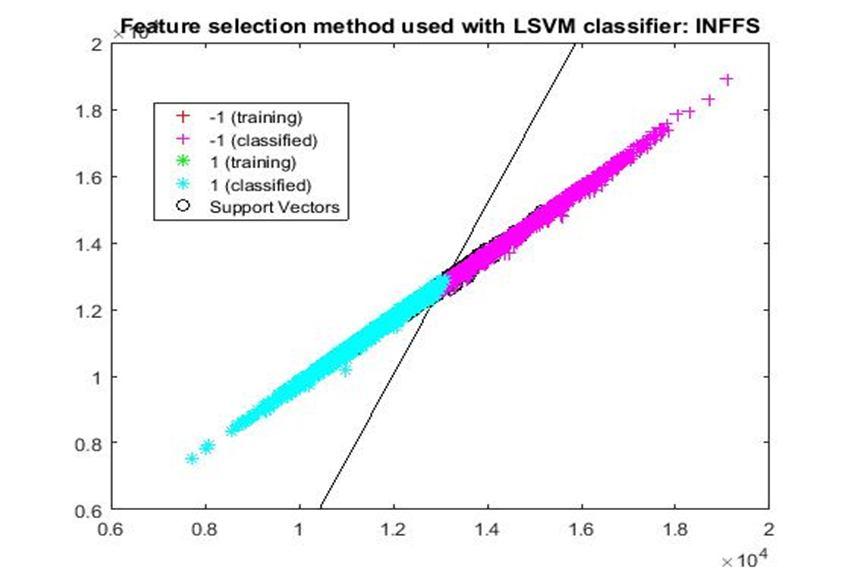
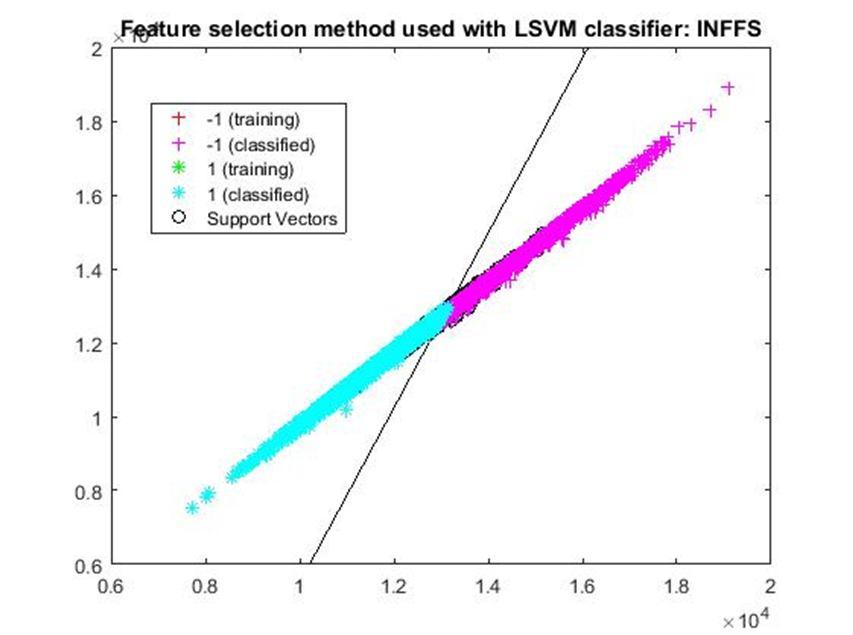
1) infFS: Infinite Feature Selection (InfFS) [9] is a graph based selection algorithm in which each feature is a node in the graph, each feature is mapped on the graph to form a path. InfFS constructs a graph by considering an infinite number of paths connecting all the features and uses the convergence properties of power series of matrices. It investigates the importance of each possible subset of features. After that, the algorithm assigns a final score to each feature of the obtained set, where the score is related to how good the feature performed in the classification task.
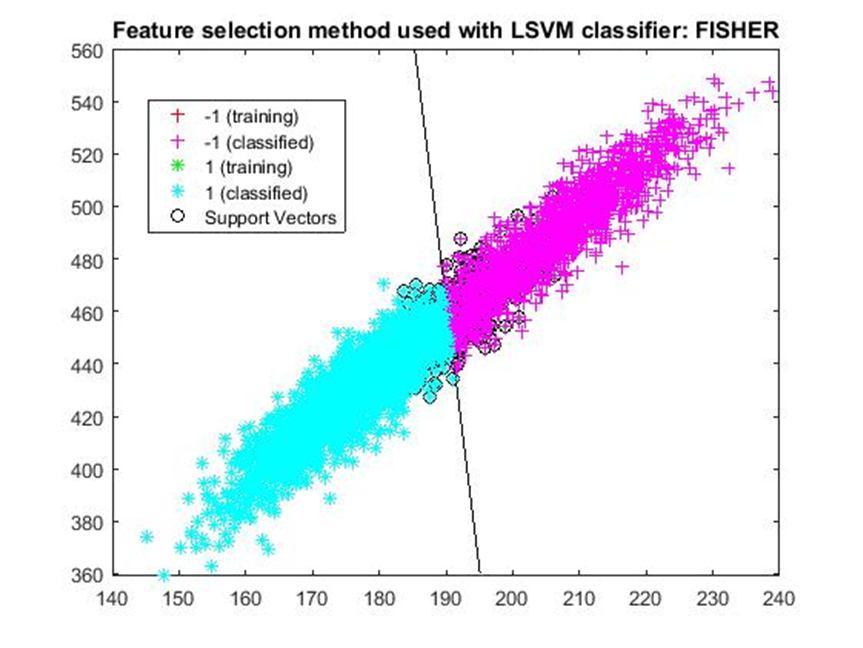
2) Fisher Score: Fisher score [10] is one of the most widely used supervised feature selection methods. However, it selects each feature independently according to their scores under the Fisher criterion, which leads to a suboptimal subset of features. Fisher filter is a fast FS technique that calculates the score of a feature w.r.t. the ratio of between class separation and within class variance.
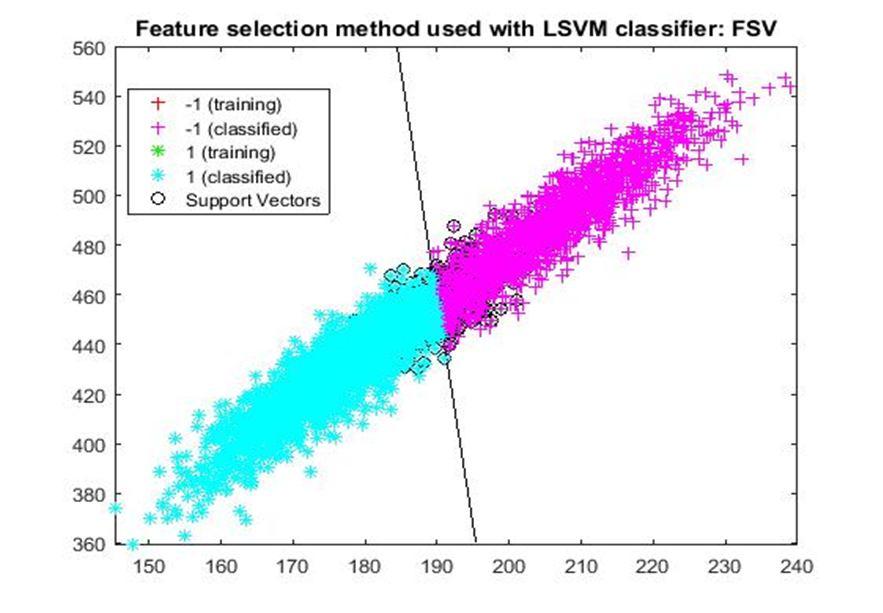
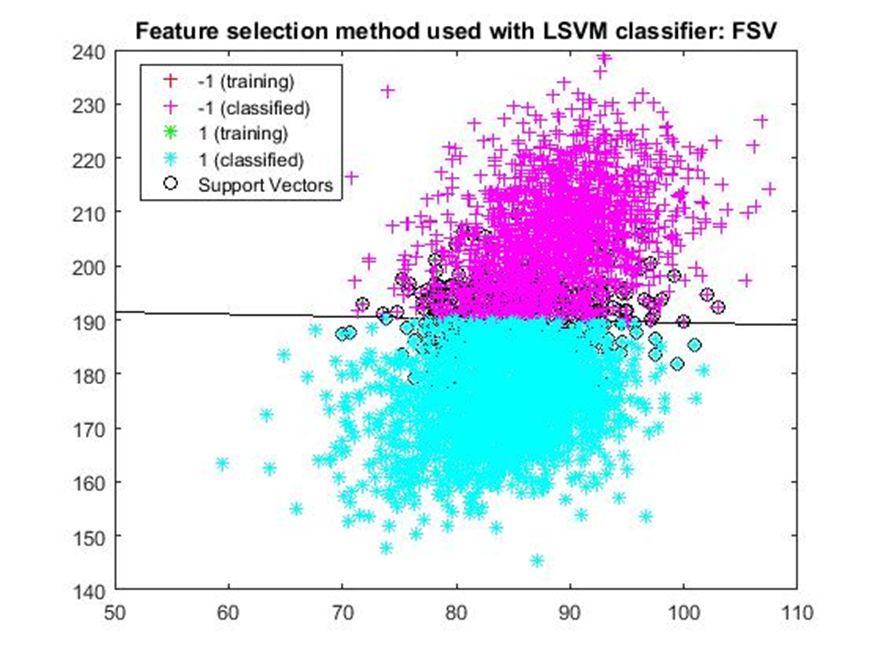
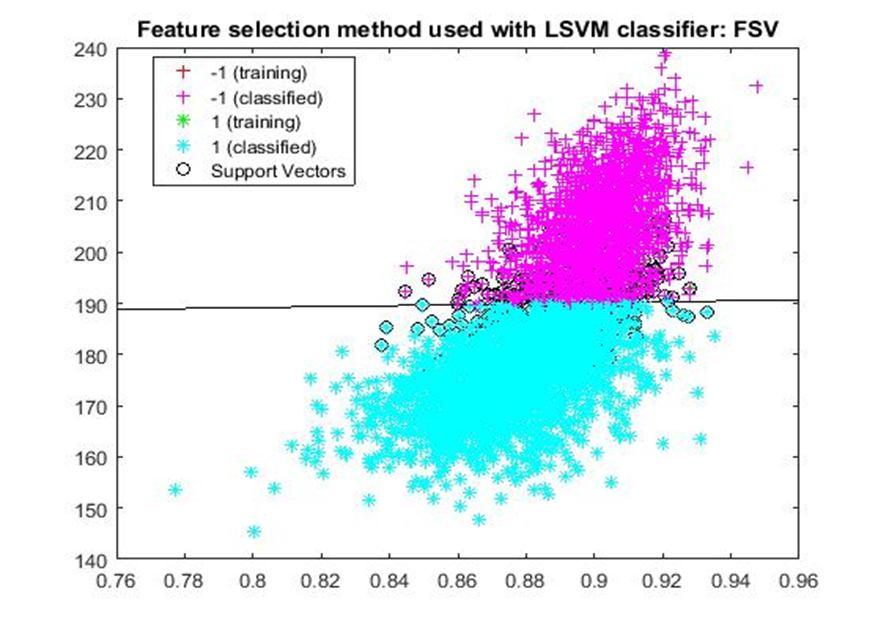
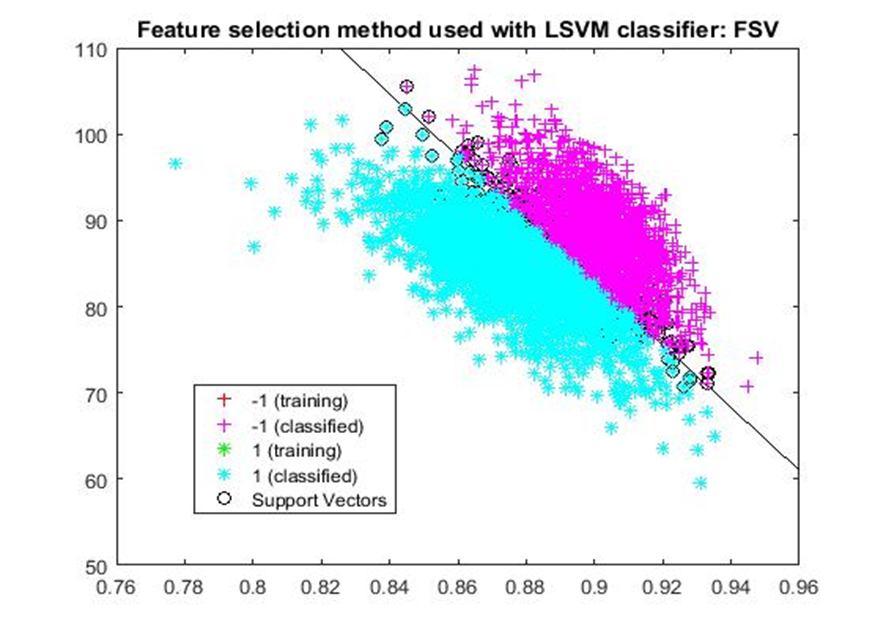
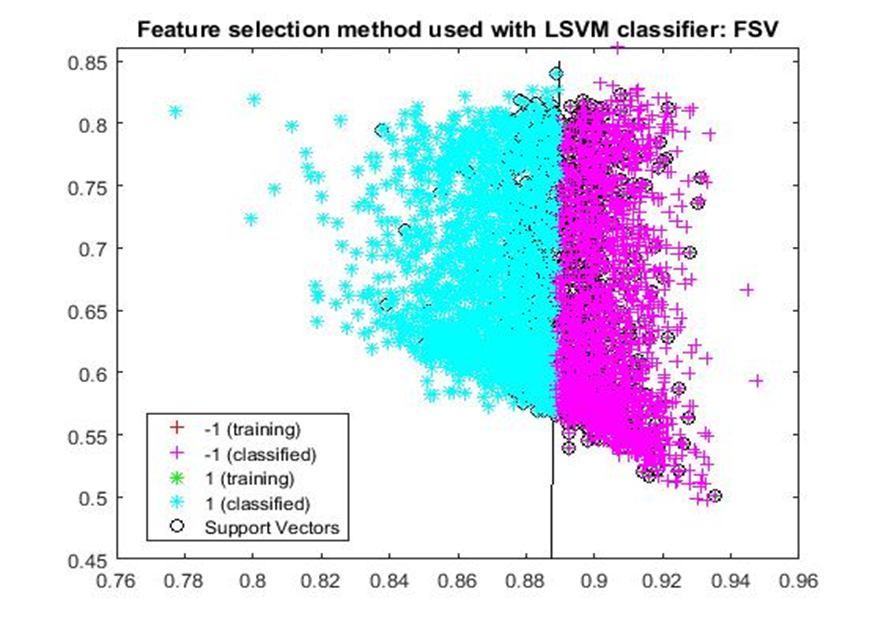
3) FSV: Feature Selection via Concave minimization (FSV) [11] is an embedded FS technique that makes use of linear programming approach to inject the FS procedure into the training phase of a support vector machine.
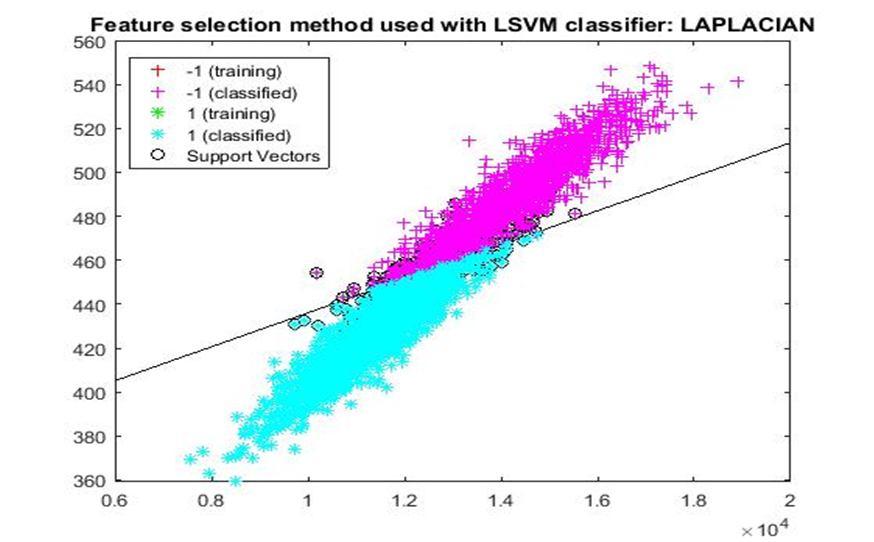
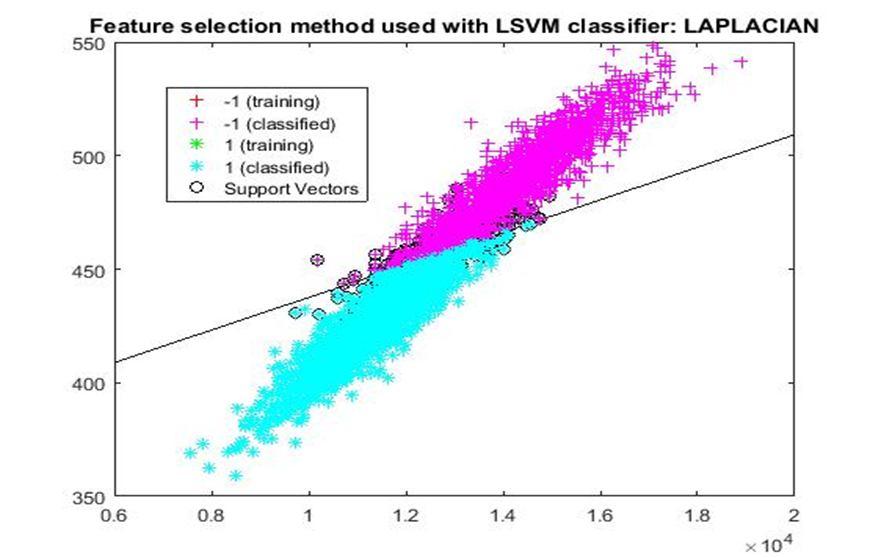
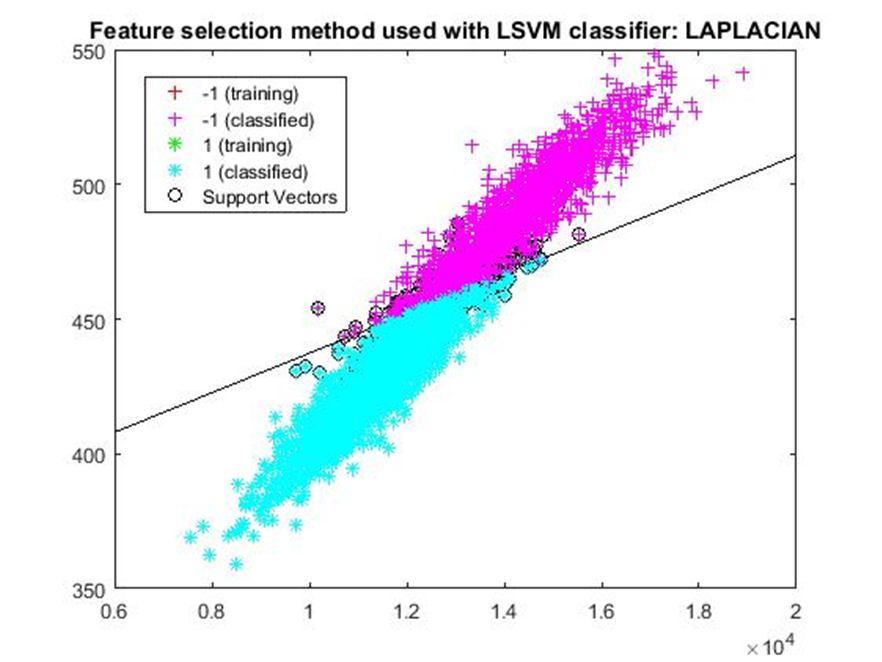
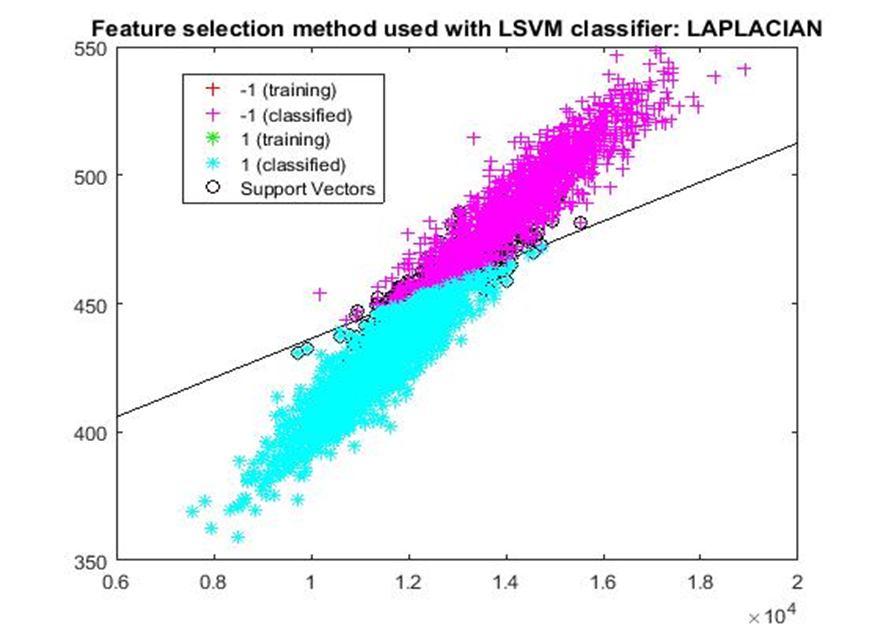
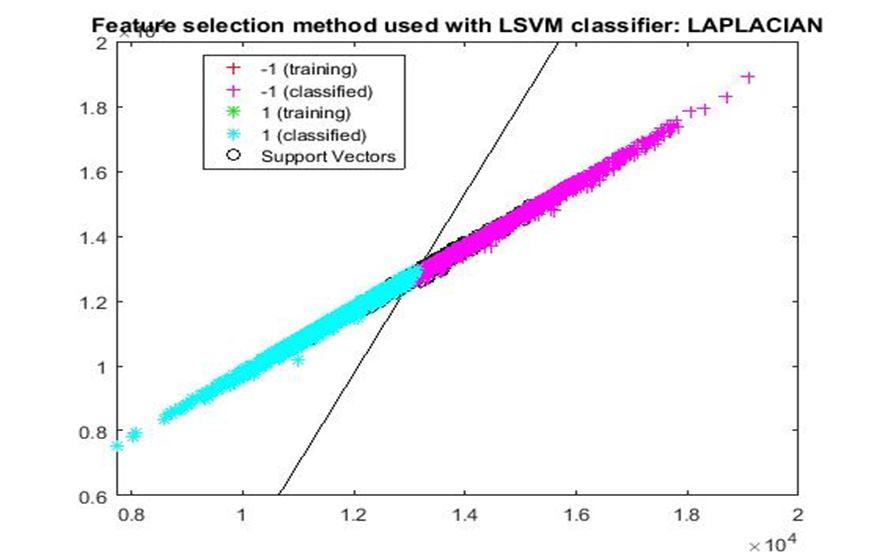
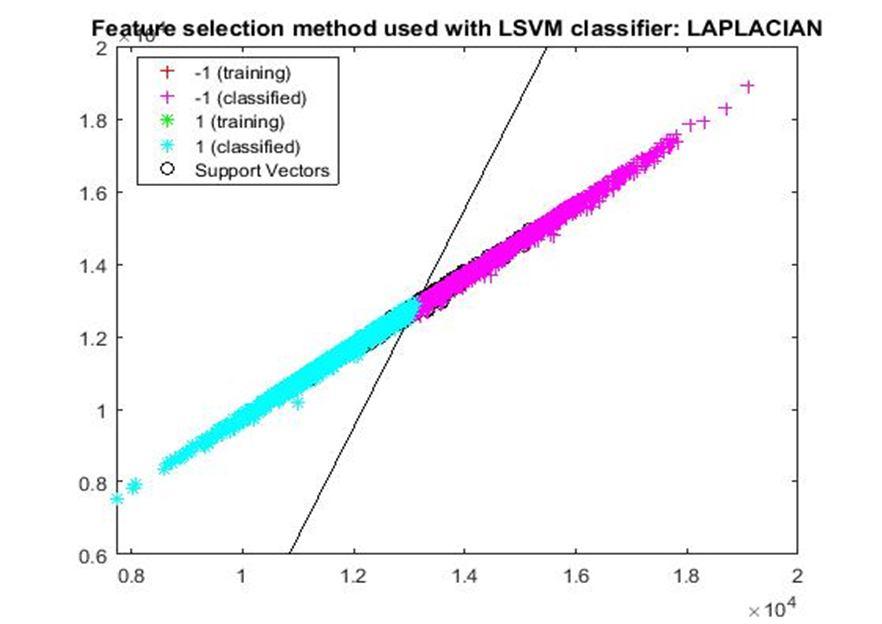
4) Laplacian Score: Laplacian Score (LS) [12] mainly relies on Laplacian Eigenmaps and Locality Preserving Projection. LS uses the locality preserving power of features in order to evaluate their importance. This has been done by means of a nearest neighbour graph, which is constructed to model the geometric structure of data.
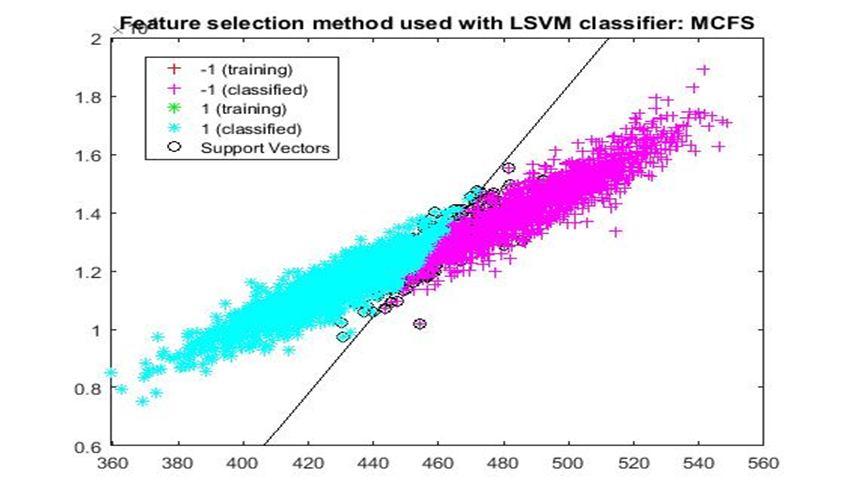
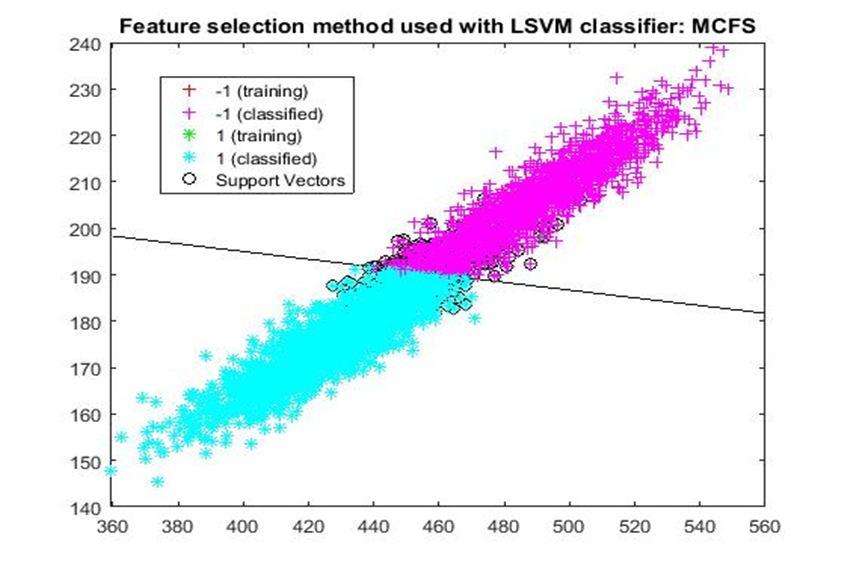
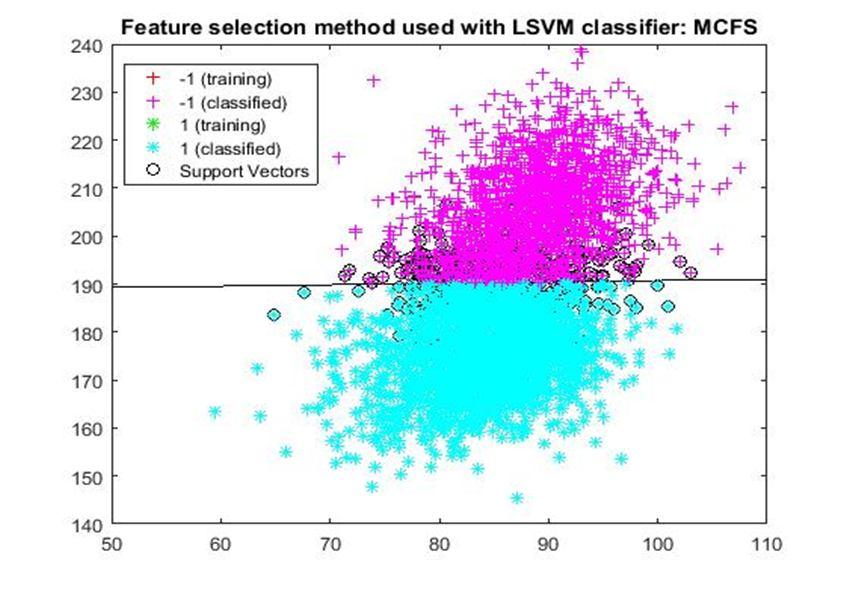
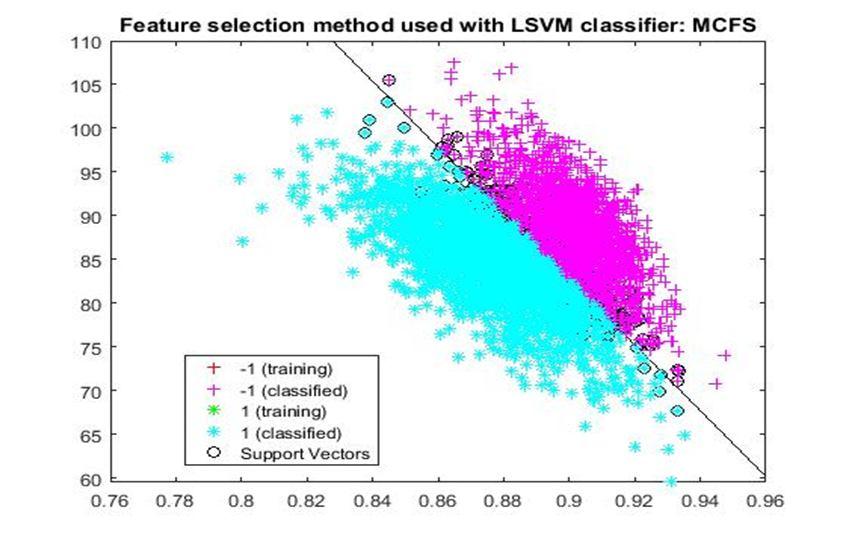
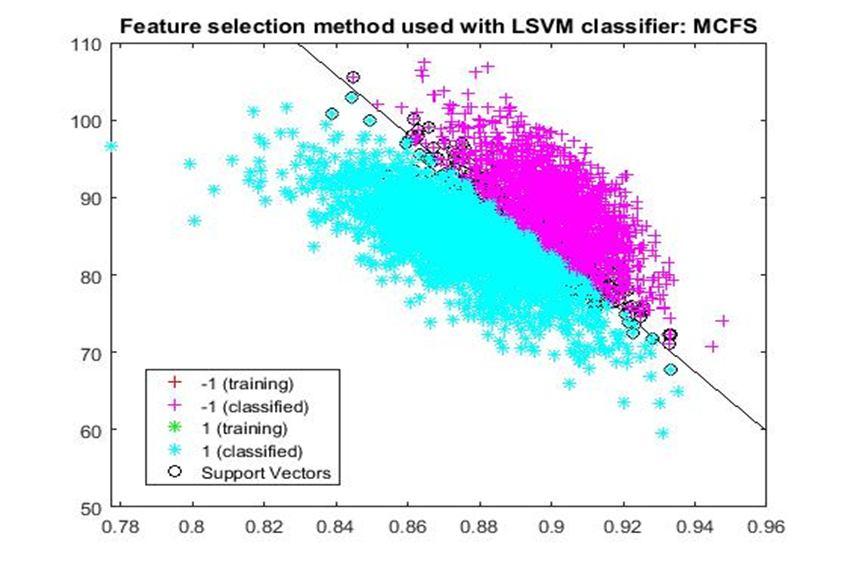
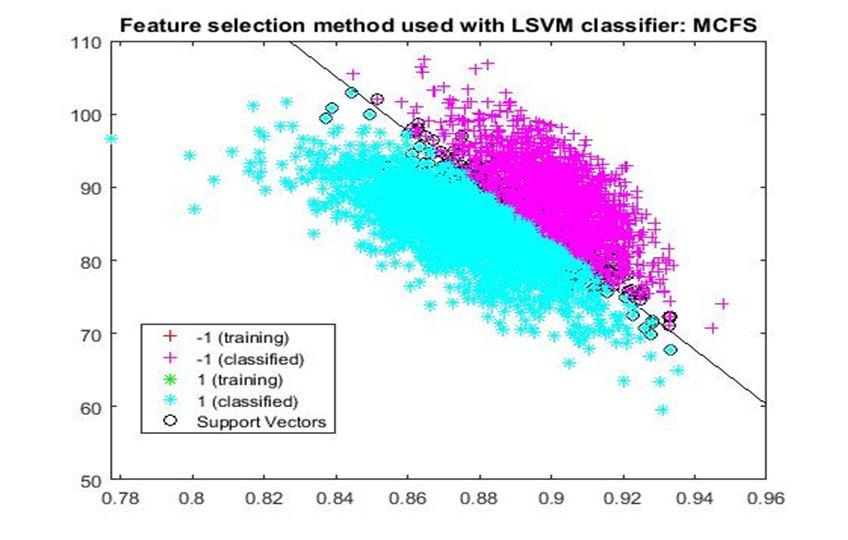
5) MCFS: Multi cluster feature selection (MCFS) [13] It assumes that the selected features should preserve the cluster structure of the data, for which the manifold structure has been used. Additionally, MCFS ensures that all possible clusters are covered using by the selected features.
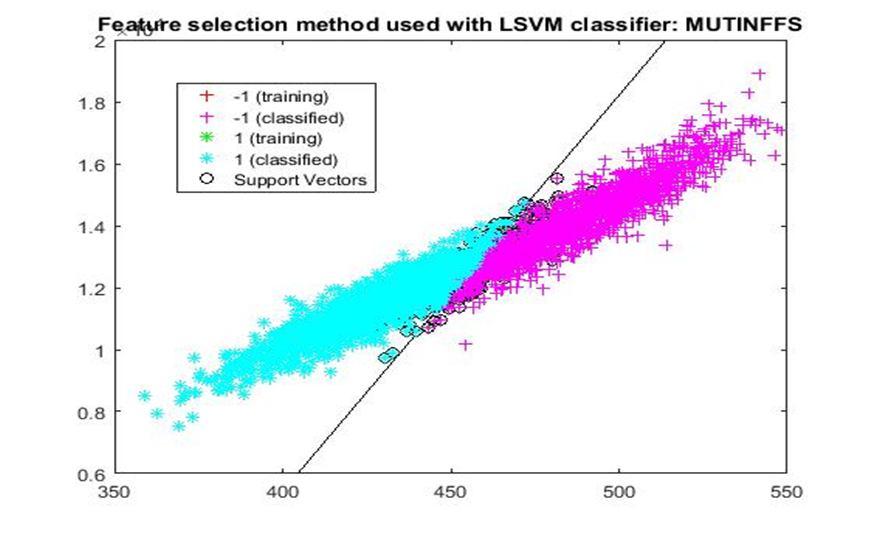
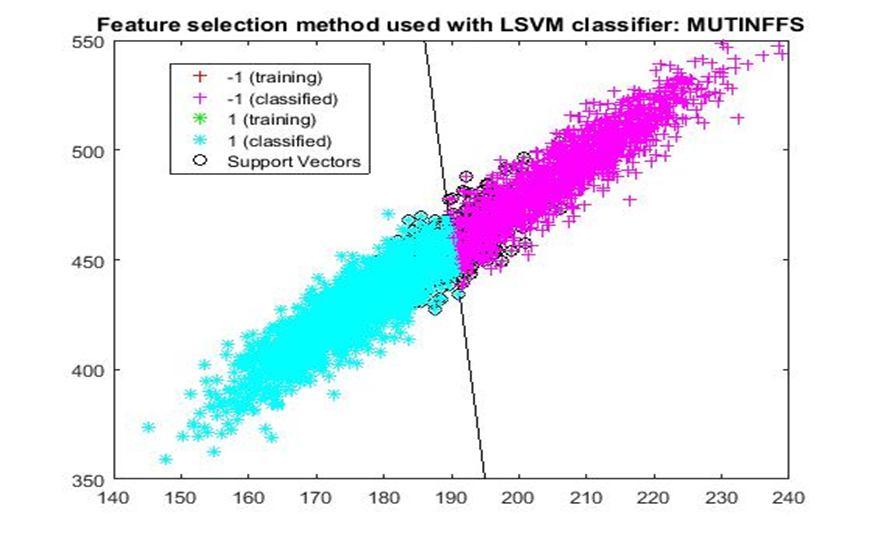
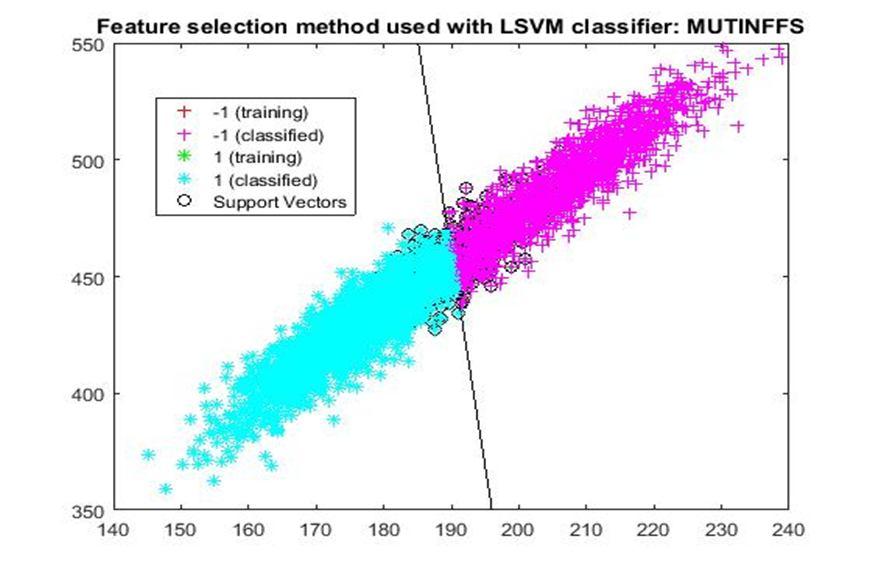
6) MUTinfFS: Mutual Information Feature Selection (MutInfFS) [14] finds the best set of features in a greedy approach. In this process, a feature with the highest influence on the class relevance is determined at each step. The selection, on the other hand, is conducted based on a proportional term, which indicates the intersection of the nominated feature and the pool of features at hand.
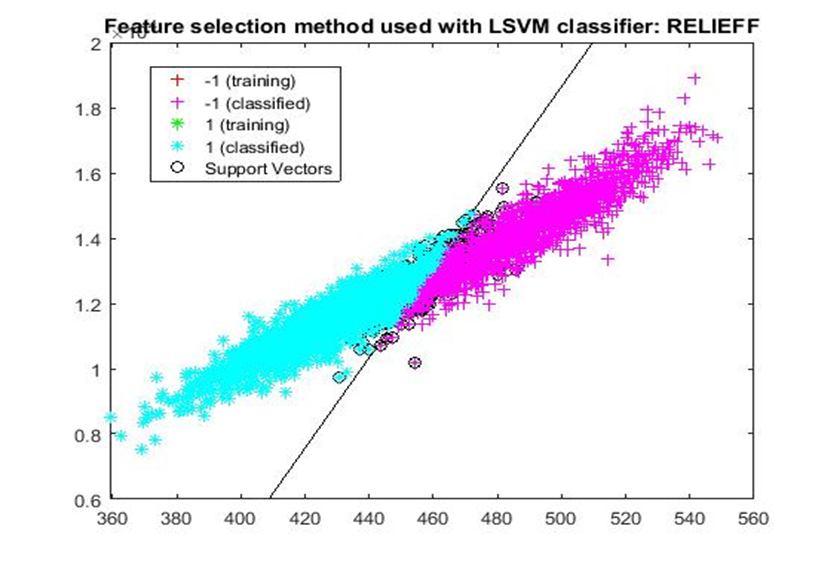
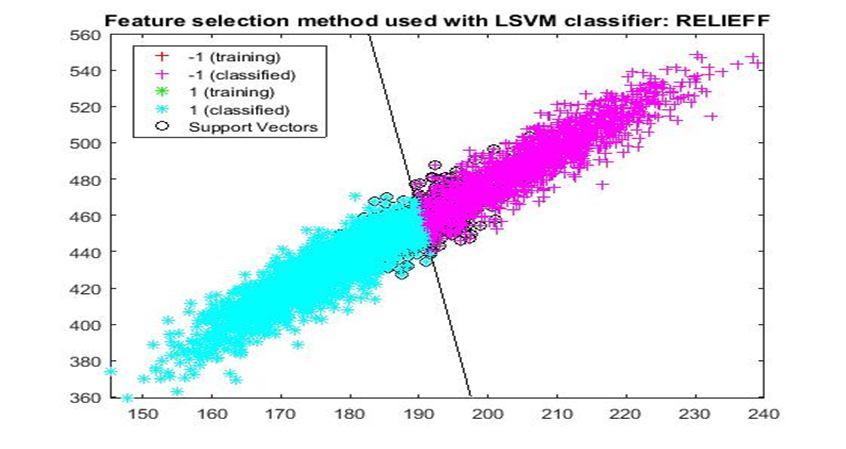
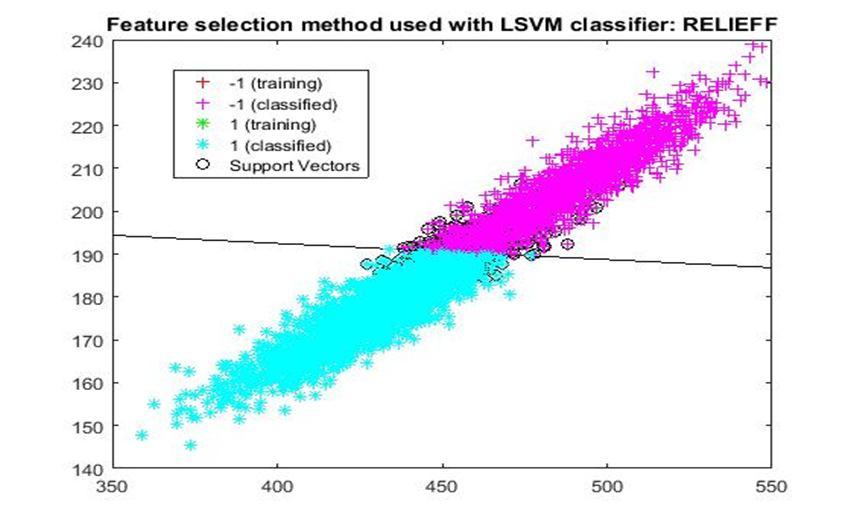
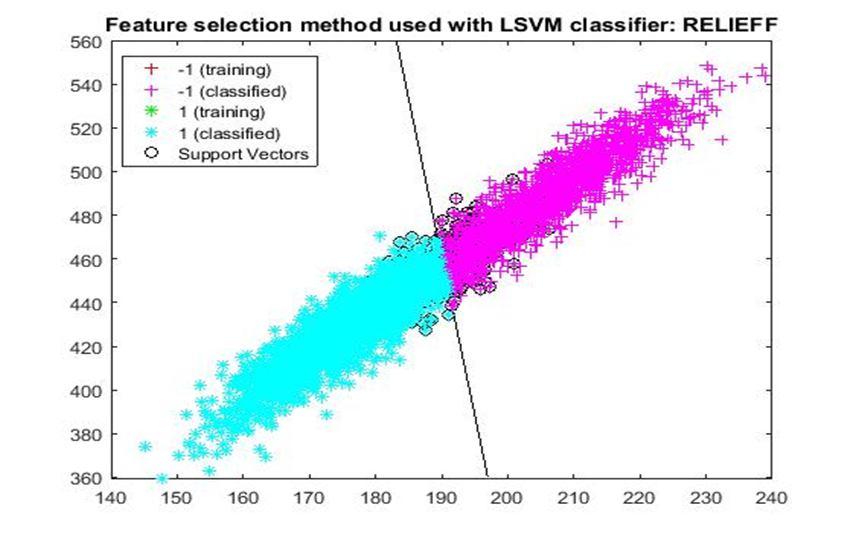
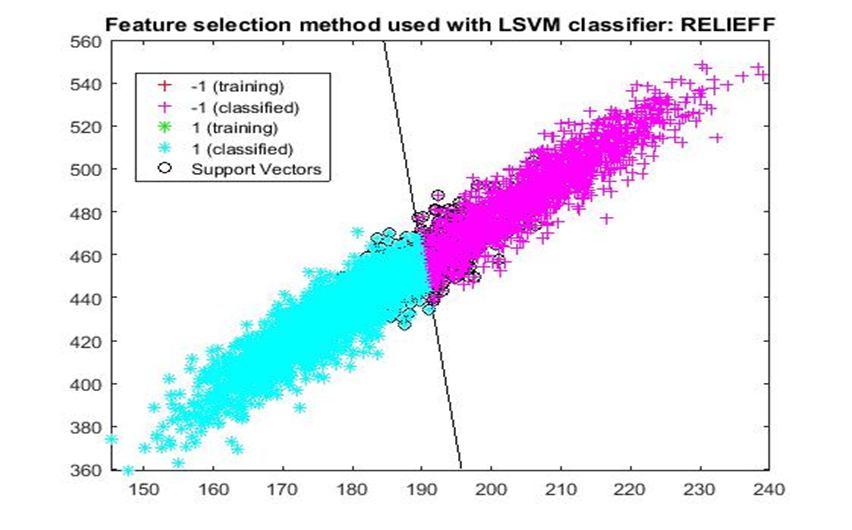
7) ReliefF: It is a supervised and randomized feature selection technique that measures feature qualities in an iterative manner. To do so, ReliefF [15] determines to what extent features values differentiate samples in a small neighbourhood. Nevertheless, feature redundancy may not be perceived by this algorithm, and, thus, the best feature set may not be attained.
Support Vector Machine (SVM) [16, 17, 18]was first heard in 1992, introduced by Boser, Guyon, and Vapnik in COLT 92. Support vector machines (SVMs) are a set of related supervised learning methods used for classification and regression. Support Vector Machine (SVM) is a classification and regression prediction tool that uses machine learning theory to maximize predictive accuracy while automatically avoiding over fit to the data.
People of Turkey mainly eat rice and two of the certified rice species are Cammeo and Osmancik. The Cammeo species grown in turkey since 2014. This species is also very famous and consumed by lots of people. The Osmancik specie are also grown in turkey since last 25 years. It has a large planting area since then. Cammeo and Osmancik species have been selected for the study. The Cammeo species [19] have wide and long, glassy and dull in appearance. The dataset has been collected directly from the University of California Irvine (UCI) Machine Learning repository, which has 3810 rows containing seven morphological features. The dataset has been created by taking a total of 3810 rice grain images of two species. They have been processed and feature values were extracted.
A dataset consisting of 3810 samples containing data for both Cammeo and Osmancik species has been taken. Morphological features[20] like Area, Perimeter, Major Axis Length, Minor Axis Length, Eccentricity, Convex Area and Extent have been selected for further studies as per given table 1.
Table 1. Morphological features and their particulars
Factor
Factor 7.894
& Engineering Technology (IJRASET
ISSN: 2321 9653; IC Value: 45.98; SJ Impact Factor: 7.538
Volume 10 Issue VIII Aug 2022 Available at www.ijraset.com
Area
The number of pixels within the boundaries of the rice grain.
Perimeter The circumference is by calculating the distance between pixels around the boundaries of the rice grain.
Major Axis Length The longest line that can be drawn on the rice grain, (the main axis distance).
Minor Axis Length The shortest line that can be drawn on the rice grain, (the small axis distance). Eccentricity It measures how round the ellipse is (the same moments as the rice grain).
Convex Area The pixel count of the smallest convex shell of the region formed by the rice grain.
Extent: The ratio of the region formed by the rice grain to the bounding box pixels
A number of features [21] are required to be selected for proper classification of Cammeo and Osmancik species rice. Though, not all features are uniformly significant for precise assignment. A few of them may be redundant or even inappropriate. We can only achieve superior outcome by neglecting those inappropriate features. Therefore, feature selection is a useful measure to differentiate among important and unimportant features. The aim of feature selection is to take out important features with lower dimensionality whereas conserve satisfactory information and thereby improved feature separability in feature space. The features are ranked based on statistical computation A non parametric statistical assessment such as Laplacian score, Fisher score are more frequently used in literature. We have selected seven feature ranking methods as Fisher score [22], FSV [11], infFS [9], Laplacian [23], ReliefF [15], MCFS [13] and MUTinfFS [14] The accuracy, error rate and confusion matrix have been calculated for different number of features
Feature set Number of features
{Area, Perimeter}
{Area, Perimeter, Major Axis Length }
{Area, Perimeter, Major Axis Length, Minor Axis Length }
{Area, Perimeter, Major Axis Length, Minor Axis Length , Eccentricity }
{Area, Perimeter, Major Axis Length, Minor Axis Length , Eccentricity, Convex Area }
{Area, Perimeter, Major Axis Length, Minor Axis Length, Eccentricity, Convex Area, Extent}
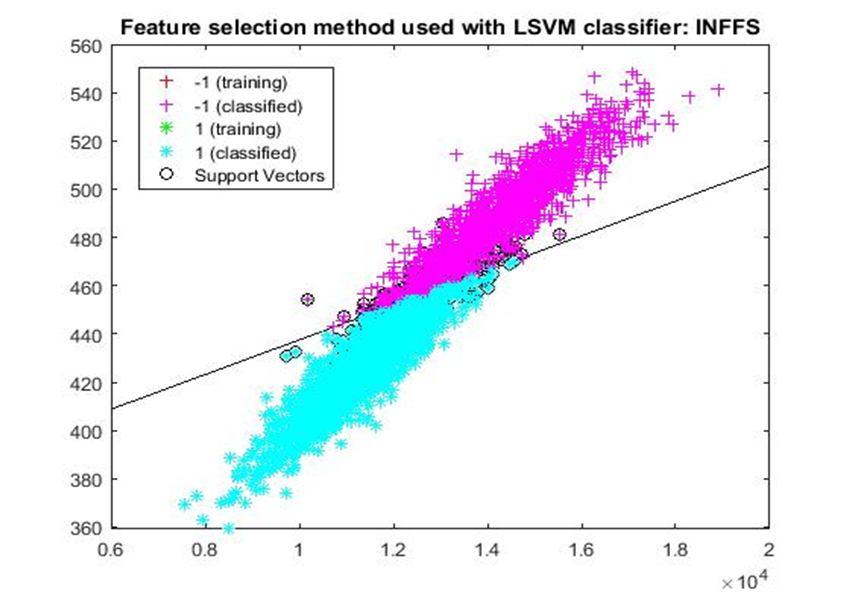
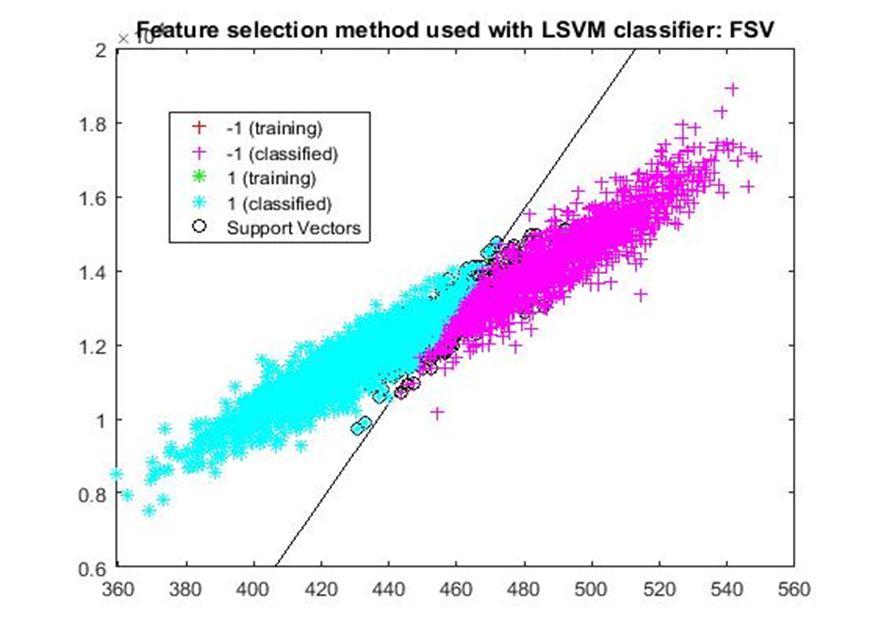
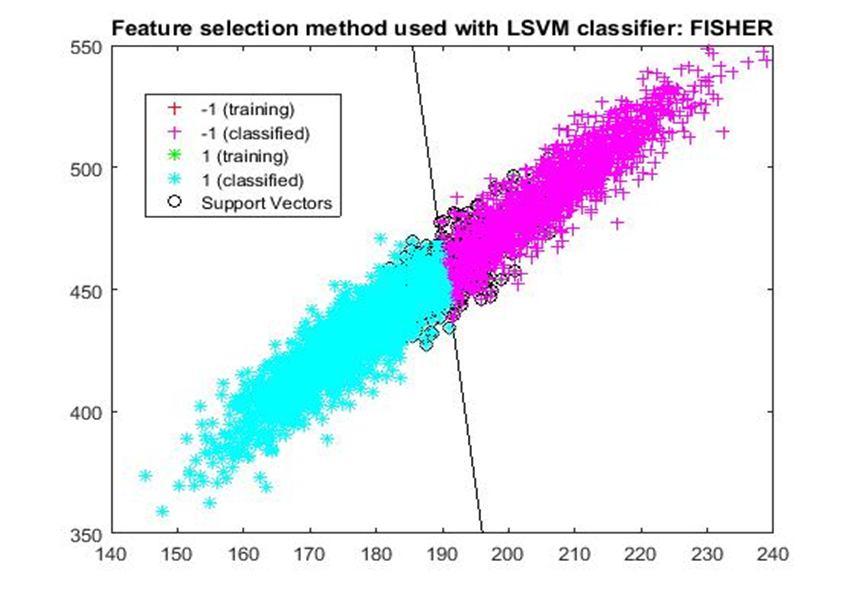
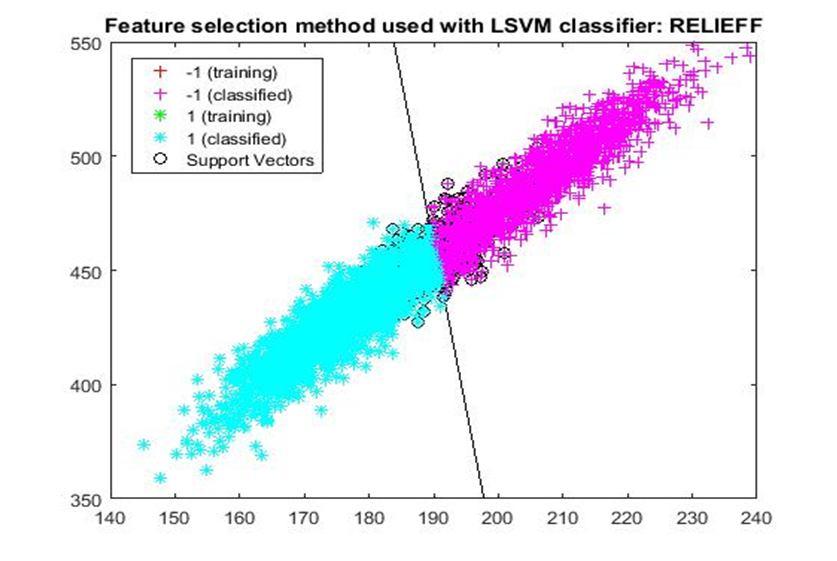
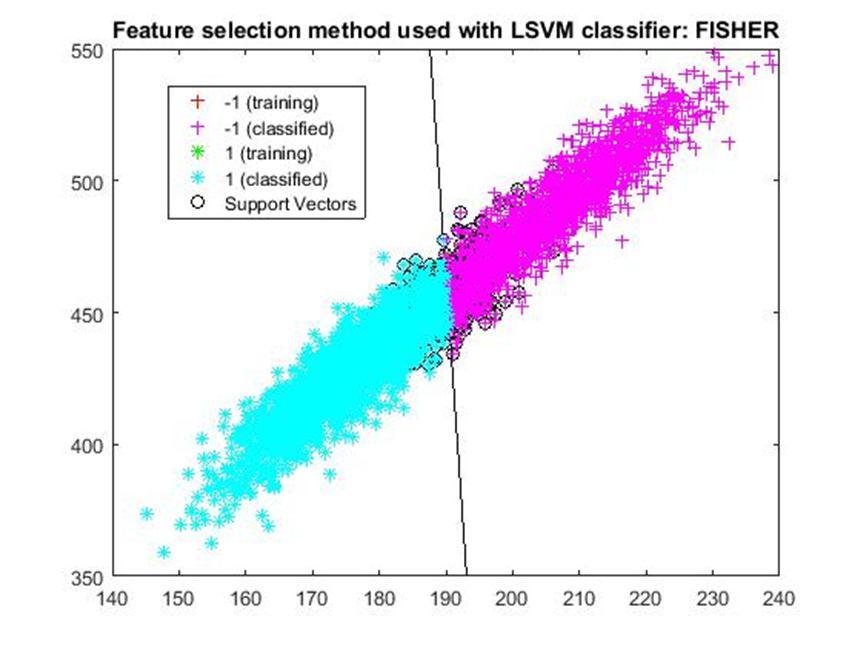
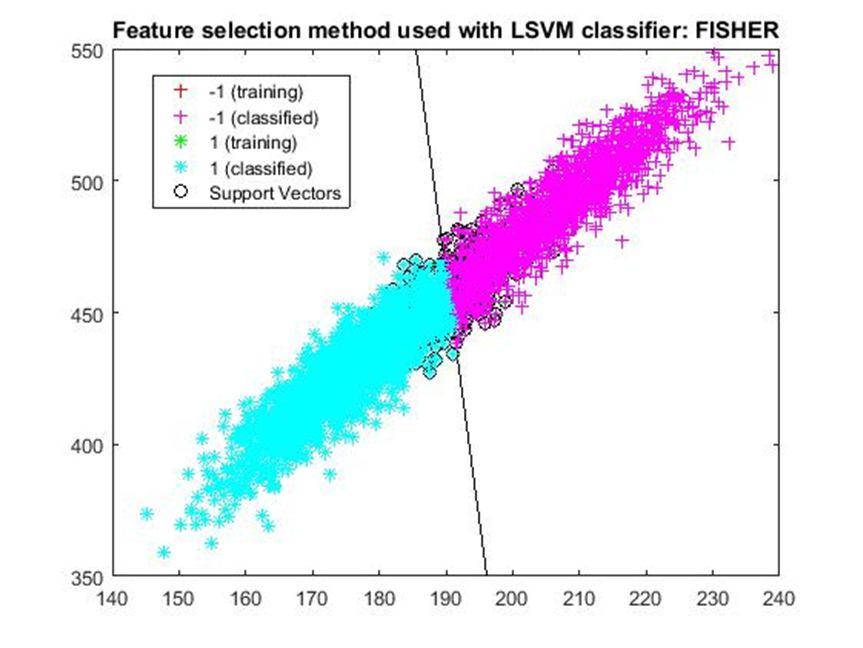
D. Application of linear Support Vector Machine classifier on different feature selection methods Various feature selection methods as given above has been taken and linear support vector machine [24] have been applied to get the boundary line and classification. The results have been given below.
Table 3: Training Accuracy for different types of feature ranking methods.
Ranking Method Number of features 2 3 4 5 6 7
infFS 92.62% 92.09% 92.62% 92.22% 87.76% 87.50%
Fisher 91.09% 92.75% 92.29% 92.55% 92.52% 92.85% FSV 91.96% 93.14% 92.16% 93.36% 92.55% 77.53% Laplacian 92.13% 92.16% 92.39% 92.19% 87.99% 87.57% MCFS 92.42% 92.62% 92.45% 92.42% 92.39% 92.42%
MUTinfFS 92.49% 92.26% 92.39% 92.72% 92.45% 93.36% Relief F 92.32% 92.88% 92.45% 92.75% 93.27% 92.42%
Factor
Factor 7.894
International Journal for Research in Applied Science & Engineering Technology (IJRASET)
ISSN: 2321 9653; IC Value: 45.98; SJ Impact Factor: 7.538 Volume 10 Issue VIII Aug 2022 Available at www.ijraset.com
Table 4: Training error rate for different types of feature ranking methods.
Ranking Method
Number of features 2 3 4
infFS 0.07 0.08 0.07 0.08 0.12 0.13
Fisher 0.09 0.07 0.08 0.07 0.07 0.07
FSV 0.08 0.07 0.08 0.07 0.07 0.22
Laplacian 0.08 0.08 0.08 0.08 0.12 0.12
MCFS 0.08 0.07 0.08 0.08 0.08 0.08
MUTinfFS 0.08 0.08 0.08 0.07 0.08 0.07
Relief F 0.08 0.07 0.08 0.07 0.07 0.08
After training process it was observed that the classification using SVM based on FSV performs better (Classification accuracy 93.36%). It takes only five features. Furthermore, MUTinfFS also displays similar classification accuracy (93.36%), but it considers seven features. Working with less number of features during classification is always better choice. Hence, we are considering classification using SVM based on FSV as best performer in training process.
Table 5: Testing Accuracy for different types of feature ranking methods.
Ranking Method
Number of features 2 3 4 5 6 7
infFS 90.03% 91.73% 91.86% 93.57% 87.66% 89.11%
Fisher 93.18% 91.99% 93.57% 92.52% 92.78% 91.73%
FSV 92.39% 89.76% 93.57% 93.18% 91.86% 80.31%
Laplacian 92.26% 91.47% 91.21% 91.99% 87.40% 89.24%
MCFS 90.81% 92.39% 93.04% 92.81% 92.78% 92.52%
MUTinfFS 90.81% 93.31% 92.78% 91.47% 93.44% 93.18% Relief F 91.34% 91.34% 93.04% 91.86% 89.90% 92.91%
Table 6: Testing error rate for different types of feature ranking methods.
Ranking Method
Number of features 2 3 4 5 6 7
infFS 0.10 0.08 0.08 0.06 0.12 0.11 Fisher 0.07 0.08 0.06 0.07 0.07 0.08 FSV 0.08 0.10 0.06 0.07 0.08 0.20
Laplacian 0.08 0.09 0.09 0.08 0.12 0.11
MCFS 0.09 0.08 0.07 0.07 0.08 0.07
MUTinfFS 0.09 0.07 0.07 0.09 0.08 0.07 Relief F 0.09 0.09 0.07 0.08 0.07 0.07
Based on the similar argument as mentioned above, during testing, we are considering Classification using SVM based on Fisher Score (Classification Accuracy 93.57%) as well as FSV (Classification Accuracy 93.57%) as top performer. Both of them considers only four features for classification.
Rights are Reserved
SJ Impact Factor 7.538 | ISRA Journal Impact Factor 7.894
Issue VIII

at
10 Issue VIII
2022
at

Issue

Issue VIII

2022
at
Issue VIII

ISSN: 2321 9653; IC Value: 45.98; SJ Impact Factor: 7.538 Volume 10 Issue VIII Aug 2022 Available at www.ijraset.com
Number of Features
Figure 9: a represents classification accuracy, and b represents error rate during testing process.
After analysis it is found that During training FSV performed best result while selecting five features whereas during testing both FSV and fisher score produces the best result and selecting four features. The four features are as given below.
Table 7: Selected feature names
Rank Column Name 1 Area 2 Perimeter 3 Major Axis Length 4 Minor Axis Length
Correct prediction (true positive and true negative) and errors (false negative or missed alarm and false positive or false alarm) have been calculated. These terms are defined by a confusion matrix as given in the table 8.
Table8: Confusion matrix Really Correct Yes or No Really Correct (Yes) Not Really Correct (No) Correct Predicted Yes or No Correct Predicted (Yes) True Positive False Positive Not Correct Predicted (No) False Negative True Negative
True positive values are the incidents where model has correctly detected rice species. False positive or false alarm is the situation where the model has detected a particular rice species but actually it is not. False negative or missed alarm is the instance where the model has detected a different rice species in place of actual rice species. True negative values are the incidents where the model has correctly detected different rice species In the validation 762 sample rows (20%) have been taken and experiments have been performed and the results have been validated in terms of true positive, true negative, false positive and false negative values as furnished in table 9.
Total no. Of samples
True Positive (TP)
True Negative (TN) False Positive (False Alarm) (FP) False Negative (Missed Alarm) (FN)
309 404 17 32
Factor
Factor
Table 10: Validation statistics
No. StatisticalAttributes Value
Positive (TP)
Positive (FP)
Negative (FN)
Negative (TN)
predictive
positive
negative
Prediction Accuracy
Attributes Value
International Journal for Research in Applied Science & Engineering Technology (IJRASET)
ISSN: 2321 9653; IC Value: 45.98; SJ Impact Factor: 7.538 Volume 10 Issue VIII Aug 2022 Available at www.ijraset.com
The Prediction accuracy has been calculated and furnished below in table 13. Figure 9 shows the false alarm percentage and missed alarm percentage. It also displays correct prediction percentage for heavy, medium and no landslide regions for best, worst and all cases.
False Alarm in % Missed Alarm in %
SVM based on FSV during Training
SVM based on FSV During Testing
Correct Prediction in %
SVM based on Fisher Score during Testing
It has been observed that the classification by SVM based on infFS performed top during training process. Whereas, classification by SVM based on Fisher score as well as based on FSV both performed top during testing. Prediction accuracy of 93.57% was found in both the cases during testing and validation. During testing, minimum value of missed alarm percentage was found in case of fisher score and minimum value of false alarm percentage was found in the case of FSV. Cinar, and Koklu (2019) also used the dataset for classification. They found highest value of prediction accuracy (93.02%) by applying logistic regression (LR). Furthermore, Our System performed better and an accuracy of 93.54% was found. One of the main advantage of our system is that it need only four out of seven parameters for the purpose of classification
[1] Cinar, I. and Koklu, M. (2019). Classification of Rice Varieties Using Artificial Intelligence Methods. International Journal of Intelligent Systems and Applications in Engineering, vol.7, no.3 (Sep. 2019), pp.188 194. https://doi.org/10.18201/ijisae.2019355381
[2] Mapari, R., Kakarwal, S. and Deshmukh, R., MRI Brain Tumor Image Classification Using Morphological operations and Neural Network Algorithm.
[3] Setyawan, D., Wibowo, M.E. and Murhandarwati, E., 2022. Classification of plasmodium falciparum based on textural and morphological features. International Journal of Electrical & Computer Engineering (2088 8708), 12(5).
[4] Assadzadeh, S., Walker, C.K., McDonald, L.S. and Panozzo, J.F., 2022. Prediction of milling yield in wheat with the use of spectral, colour, shape, and morphological features. Biosystems Engineering, 214, pp.28 41.
[5] Santana Morales, P., Merchán, A.F., Márquez Rodríguez, A. and Tallón Ballesteros, A.J., 2022. Feature Ranking for Feature Sorting and Feature Selection: FR4 (FS). In International Work Conference on the Interplay Between Natural and Artificial Computation (pp. 545 550). Springer, Cham.
[6] Tripathi, D., Reddy, B.R. and Shukla, A.K., 2022. CFR: collaborative feature ranking for improving the performance of credit scoring data classification. Computing, 104(4), pp.893 923.
[7] Tounsi, S., Kallel, I.F. and Kallel, M., 2022, March. Breast cancer diagnosis using feature selection techniques. In 2022 2nd International Conference on Innovative Research in Applied Science, Engineering and Technology (IRASET) (pp. 1 5). IEEE.
[8] Parisi, L., RaviChandran, N. and Manaog, M.L., 2018. Feature driven machine learning to improve early diagnosis of Parkinson's disease. Expert Systems with Applications, 110, pp.182 190.
[9] G. Roffo, S. Melzi, and M. Cristani, “Infinite feature selection,” in 2015 IEEE International Conference on Computer Vision (ICCV). Los Alamitos, CA, USA: IEEE Computer Society, dec 2015, pp. 4202 4210.
[10] Huang, S., Liu, Z., Jin, W. and Mu, Y., 2022. A Fisher score based multi instance learning method assisted by mixture of factor analysis. Neurocomputing
[11] P. S. Bradley and O. L. Mangasarian, “Feature selection via concave minimization and support vector machines,” in Proceedings of the Fifteenth International Conference on Machine Learning, ser. ICML 98. San Francisco, CA, USA: Morgan Kaufmann Publishers Inc., 1998, p. 8290.
[12] X. He, D. Cai, and P. Niyogi, “Laplacian score for feature selection,” in Proceedings of the 18th International Conference on Neural Information Processing Systems, ser. NIPS05. Cambridge, MA, USA: MIT Press, 2005, p. 507514.
[13] D. Cai, C. Zhang, and X. He, “Unsupervised feature selection for multicluster data,” in Proceedings of the 16th ACM SIGKDD International Conference on Knowledge Discovery and Data Mining, ser. KDD 10. New York, NY, USA: Association for Computing Machinery, 2010, p.333342.
SJ Impact Factor 7.538
ISRA Journal Impact Factor 7.894
Journal for Research in Applied Science & Engineering Technology (IJRASET)
ISSN: 2321 9653; IC Value: 45.98; SJ Impact Factor: 7.538
Volume 10 Issue VIII Aug 2022 Available at www.ijraset.com
[14] R. Battiti, “Using mutual information for selecting features in supervised neural net learning,” IEEE Transactions on Neural Networks, vol. 5, no. 4, pp. 537 550, July 1994.
[15] Robnik Šikonja & Kononenko (2003) Robnik Šikonja M, Kononenko I. Theoretical and empirical analysis of ReliefF and RReliefF. Machine Learning. 2003;53:23 69.
[16] Chen, B., Lu, Y., Pan, W., Xiong, J., Yang, Z., Yan, W., Liu, L. and Qu, J., 2019. Support vector machine classification of nonmelanoma skin lesions based on fluorescence lifetime imaging microscopy. Analytical chemistry, 91(16), pp.10640 10647.
[17] Mishra, A. and Singh, D.K., 2022, May. Classification of Anomalous Data using SVM Classifier. In 2022 International Conference on Applied Artificial Intelligence and Computing (ICAAIC) (pp. 1133 1138). IEEE.
[18] Ibrahim, M.A.R., Shapiee, M.N.A., Abdullah, M.A., Razman, M.A.M., Musa, R.M. and Majeed, A.P., 2022. The Classification of Skateboarding Tricks: A Support Vector Machine Hyperparameter Evaluation Optimisation. In Recent Trends in Mechatronics Towards Industry 4.0 (pp. 1013 1022). Springer, Singapore.
[19] Koklu, M., Cinar, I. and Taspinar, Y.S., 2021. Classification of rice varieties with deep learning methods. Computers and electronics in agriculture, 187, p.106285.
[20] Joe, A.A.F., Veeramuthu, A. and Ashokkumar, K., 2022. A NOVEL APPROACH TO COMBINE NIR AND IMAGE FEATURES FOR NON DESTRUCTIVE ASSAY OF INDIAN WHEAT VARIETIES. Malaysian Journal of Computer Science, pp.74 87.
[21] H. Liu and H. Motoda, Computational Methods of Feature Selection (Chapman & Hall/Crc Data Mining and Knowledge Discovery Series). Chapman & Hall/CRC, 2007.
[22] Q. Gu, Z. Li, and J. Han, “Generalized fisher score for feature selection,” in Proceedings of the Twenty Seventh Conference on Uncertainty in Artificial Intelligence, ser. UAI11. Arlington, Virginia, USA: AUAI Press, 2011, p. 266273.
[23] M. Belkin and P. Niyogi, “Laplacian Eigenmaps and Spectral Techniques for Embedding and Clustering,” Advances in Neural Information Processing Systems, Vol. 14, 2001.
[24] Sathiaseelan, J.G.R., Performance Analysis of SVM in Breast Cancer Classification: A Survey.
Factor